
Brandon and Olivia win the week with two excellent looking charts that I will definitely crown as 'Diamonds' today. There are two "runners" selected by George and Valentina and Carla came in with a very interesting play. Remember, all of you can join in with your own selections for Diamonds on Thursdays, or just symbols you are wondering about.
** IMPORTANT NEWS for my current Diamonds subscribers, in August the price of Diamonds Reports will be doubling to $50/mo. YOU do NOT need to concern yourself. Your rate will stay where it is as long as your subscription continues in good standing. Other good news! I will be incorporating a 1-hour trading room once a week for Diamond subscribers only (what day would you like?)! It will be an opportunity for us to talk live. I'll be reviewing current and past Diamonds for possible entries and taking your questions and symbol requests in this intimate trading room. There will also be a once a week free trading room for 1 hour. But wait, there's more! I will be adding a Friday Diamonds Review where I will look at the performance of that week's Diamonds and their prospects moving forward. Over the weekend we clean the slate and start over again. I hope you enjoy the new changes that will be underway soon! **
Welcome to DecisionPoint Daily Diamonds, wherein I highlight five "diamonds in the rough." These are selected from the results of my DecisionPoint scans, which search for stocks that could benefit from the trend and condition of the market. Remember, these are not recommendations to buy or sell, but are the most interesting of the stocks that surfaced in my scans. My objective is to save you the work of the initial, tedious culling process, but you need to apply your own analysis to see if these stocks pique your interest as well. There are no guaranteed winners here!
Blooming' Brands Inc (BLMN) - Earnings: 11/5/2020 (BMO)
Bloomin' Brands, Inc. engages in the acquisition, operation, design, and development of restaurant concepts. It operates through the following segments: U.S. and International. The U.S. segment operates in USA and Puerto Rico. The International segment operates in Brazil, South Korea, Hong Kong, and China. Its brands include Outback Steakhouse, Carrabba's Italian Grill. Bonefish Grill, and Fleming's Prime Steakhouse & Wine Bar.
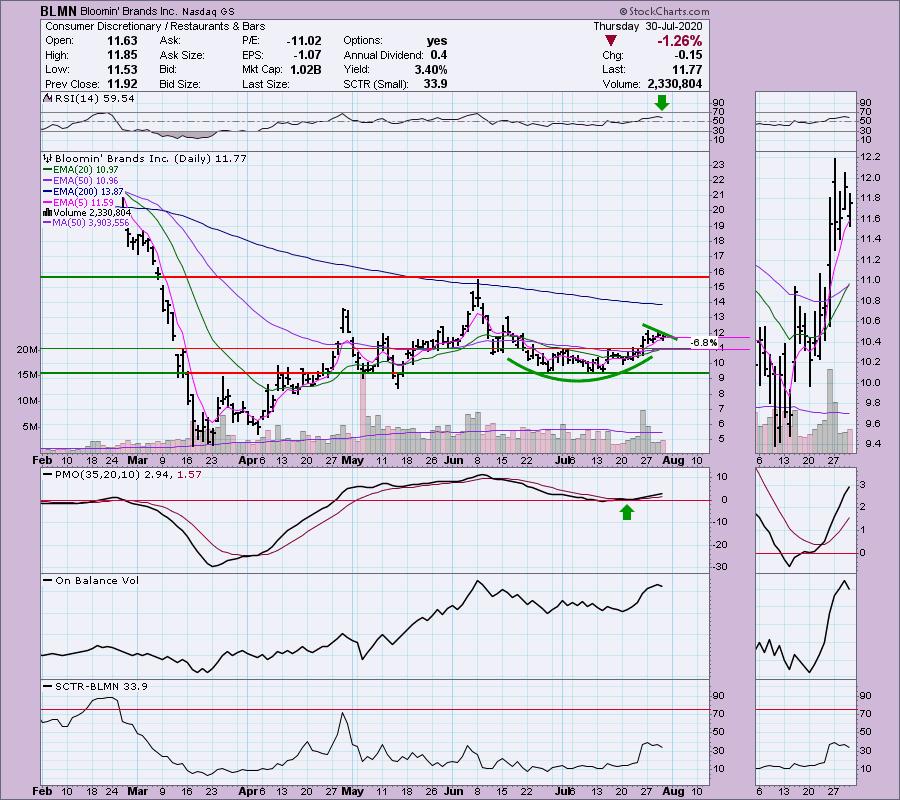
This is one of my favorite charts today even though it is down 1.1% in after hours trading. We have what appears to be a cup and handle formation. These are bullish. Even with a 1.26% decline today, the PMO is unfazed. The negative volume that came in was only a tick lower on the OBV. The RSI is positive sitting above net neutral (50). You could set a stop around the 20-EMA or just below.
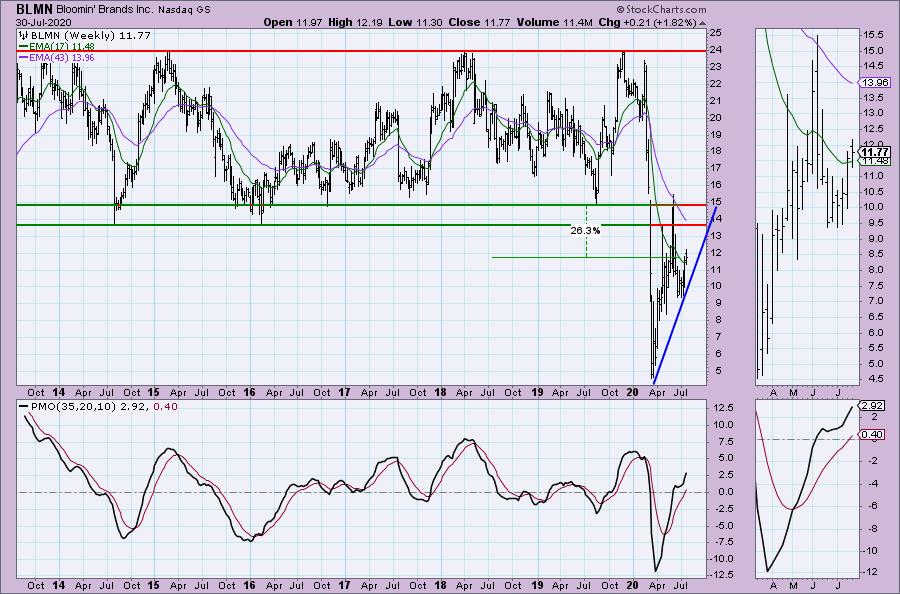
The weekly chart and upside potential are very enticing. The weekly PMO has accelerated higher.
Capital One Financial Corp (COF) - Earnings: 10/22/2020 (AMC)
Capital One Financial Corp. operates as a financial holding company, which engages in the provision of financial products and services. It operates through the following segments: Credit Card, Consumer Banking, and Commercial Banking. The Credit Card segment offers domestic consumer and small business card lending, and international card lending businesses. The Consumer Banking segment consists of branch-based lending and deposit gathering activities for consumers and small businesses. The Commercial Banking segment comprises of lending, deposit gathering and treasury management services to commercial real estate and commercial and industrial customers.
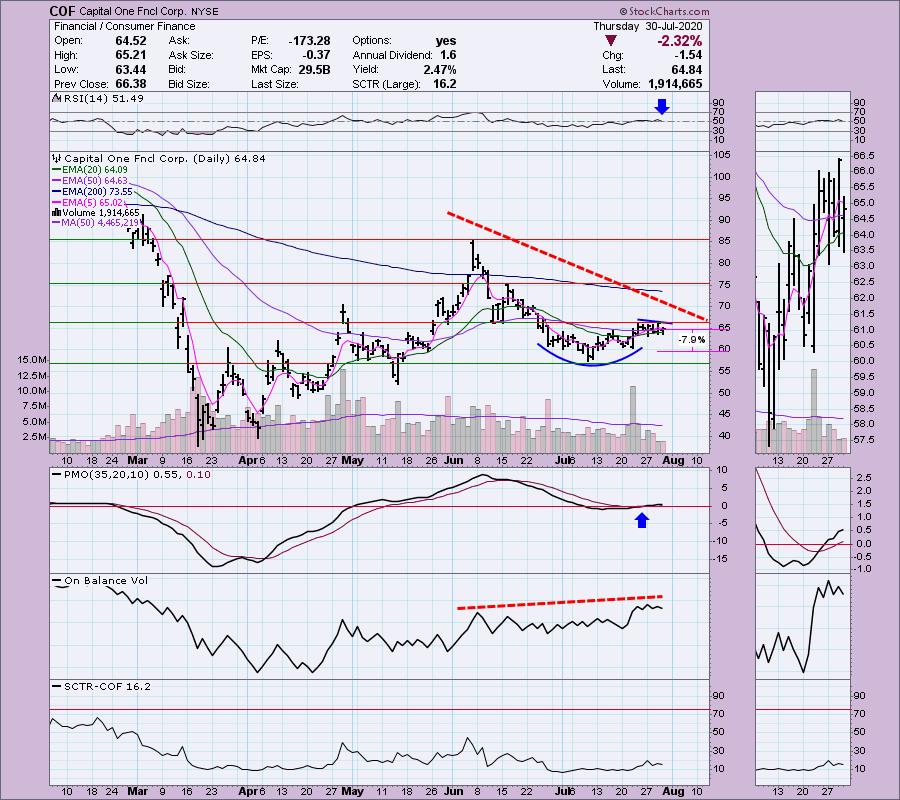
This is my other favorite today. In this case, COF is up +0.31% in after hours trading. We have another cup and handle formation. The RSI is still just above net neutral (50). The PMO is on a BUY signal. One thing that does bother me somewhat is the reverse divergence with the OBV. A lot of volume has come in as annotated on the OBV, but price is far from breaking out above the June top. I will forgive that because I like the PMO configuration. Again, we had a huge decline and the PMO only decelerated a small amount. Price is above the 20/50-EMAs currently.
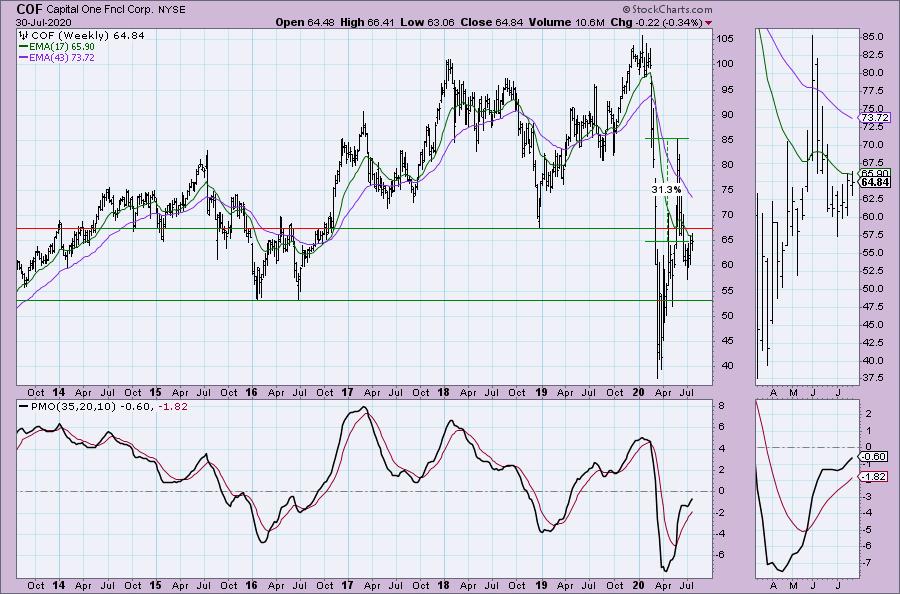
Lots of possible upside potential. That 31% gain would be getting price back to last month's high! The weekly PMO is rising nicely and nearing positive territory.
Don't forget, on Thursdays I look at reader-requested symbols, so shoot me an email at erin@decisionpoint.com. I read every email I receive and try to answer them all!
Lithium Americas Corp (LAC) - Earnings: 8/13/2020 (BMO)
Lithium Americas Corp. is a resource company, which engages in lithium development projects. Its projects include: Thacker Pass and Caucharí-Olaroz.
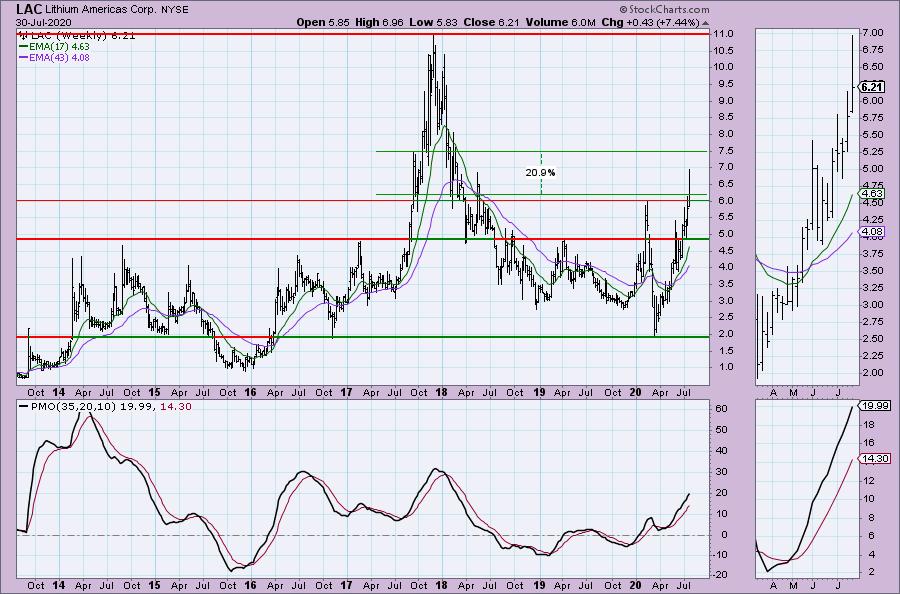
I do like LAC and apparently so do investors tonight as it is up +3.54% in after hours trading! When I first looked at the chart I was concerned that it was getting ready to test the bottom of the rising trend channel. If, based on after hours trading it may've formed a third bottom that didn't hit the bottom of the channel. That is very bullish. The PMO isn't especially overbought and it is still rising. The RSI is no longer overbought but remains positive.
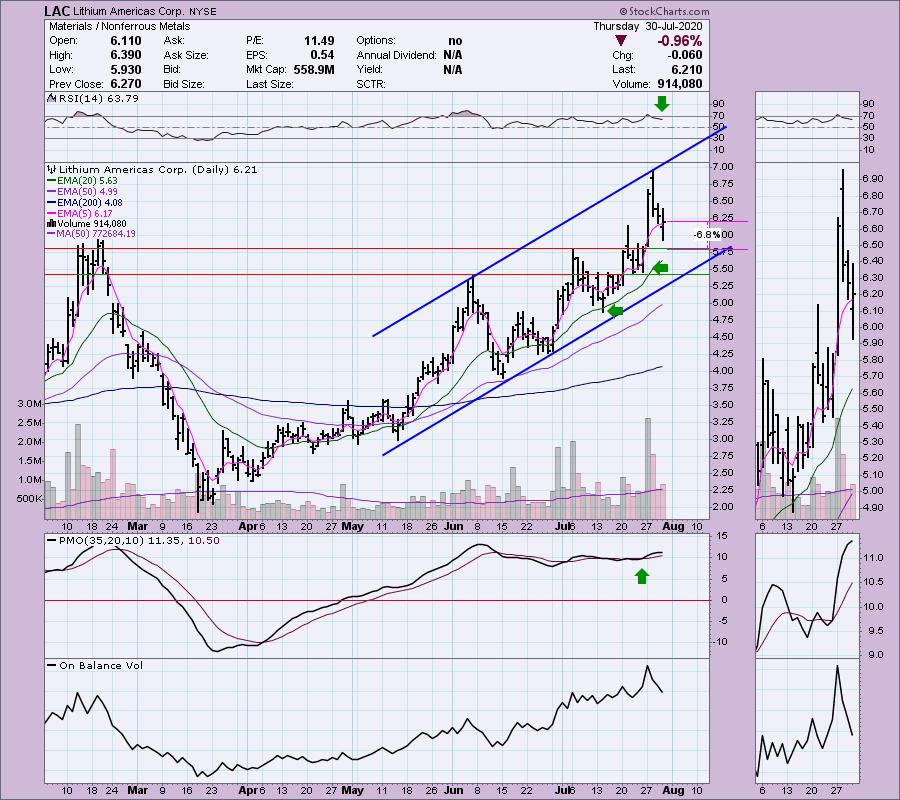
The weekly PMO is rising and is not overbought. Upside potential just to the 2017 mid year top would still give us a 21% gain. If it were to move to the 2017 top, that would be an 80% gain...I'm not counting my chickens on that.
Novavax Inc (NVAX) - Earnings: 8/5/2020 (AMC)
Novavax, Inc. is operates as a clinical-stage biotechnology company, which focuses on the discovery, development and commercialization of vaccines to prevent infectious diseases. It produces vaccine candidates to respond to both known and emerging disease threats by using the proprietary recombinant nanoparticle vaccine technology. The firm's vaccine candidates include ResVax and NanoFlu. It also develops immune stimulating saponin-based adjuvants through its wholly owned Swedish subsidiary, Novavax AB.
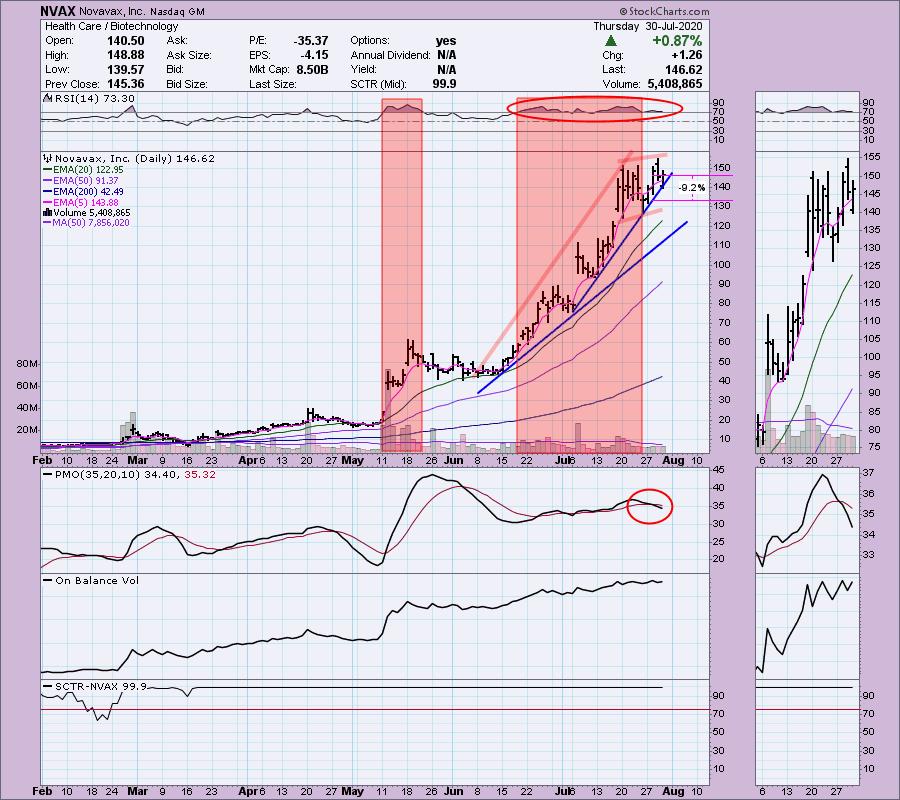
This is a strong stock but it is showing signs of deterioration. It is up +0.38% in after hours trading which is good. I'd like to see that PMO SELL signal go away before getting in on this one. I've highlighted how overbought it is. That isn't always a problem as you can see that it has maintained overbought conditions during the rising trend. However, I think this one is ready for a pullback. If it can hold the $130 area, it is forming a bull flag. I think this one is a 'wait and see'.
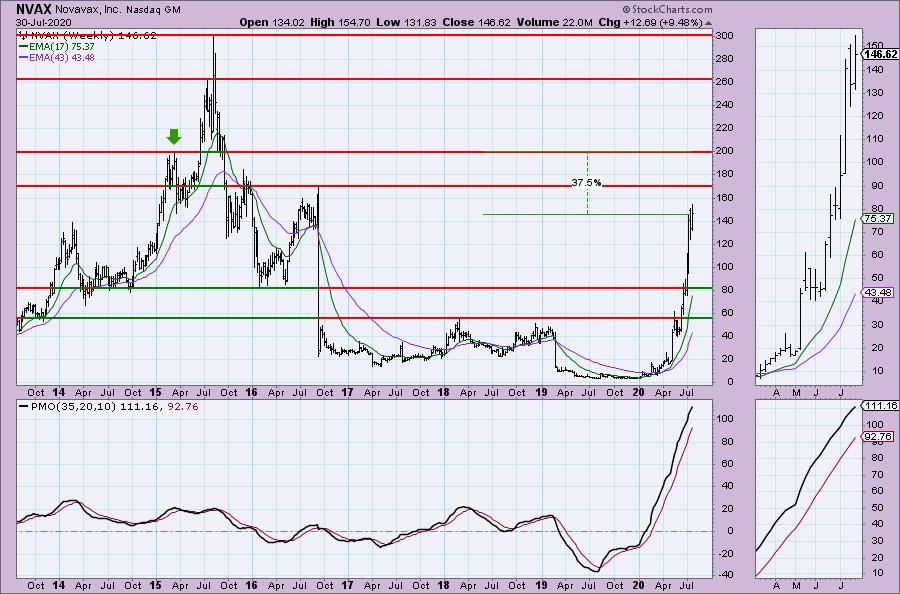
Can't argue with the weekly chart except to say that it is a vertical parabolic rise. Those generally don't end well, but if it can continue higher, I would set a target around $200.
Xilinx Inc (XLNX) - Earnings: 4/22/2020 (AMC)
Xilinx, Inc. engages in the design and development of programmable logic semiconductor devices and the related software design tools. It also provides design services, customer training, field engineering, and technical support.
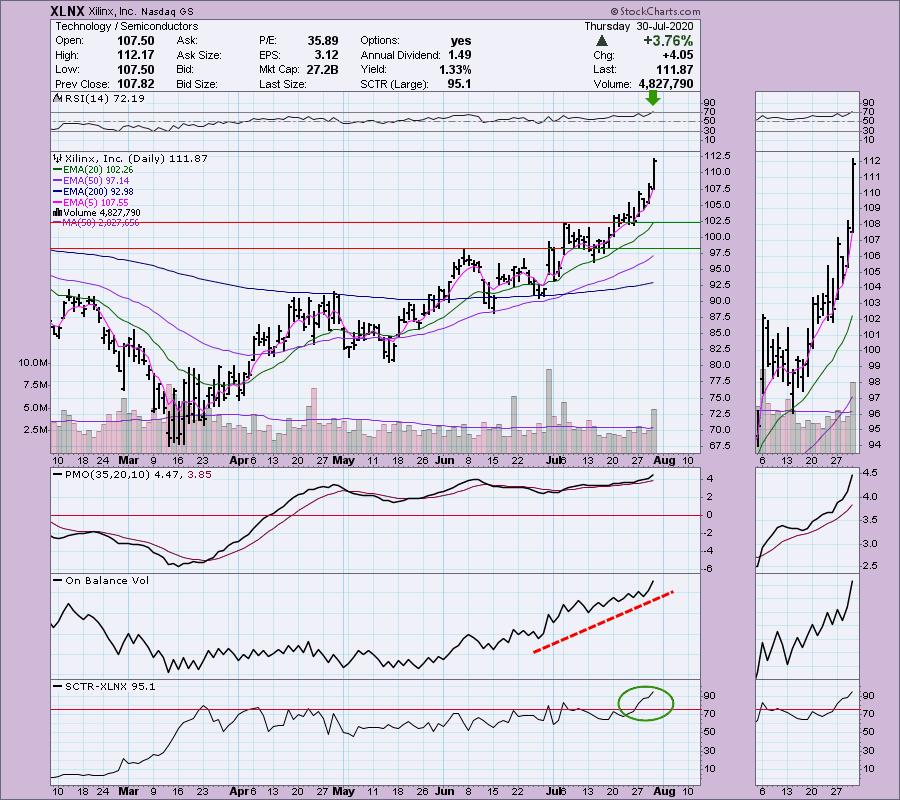
This one is definitely a runner. It reported earnings today which is why the giant leap in price. However, it currently is down 2.59% in after hours trading. That could give us a better entry. Price right now is very overbought. The PMO appears very overbought, but since it has tested the -6 area in March, it can certainly oscillate to +6. the OBV is very positive. The RSI is overbought right now. The SCTR has moved into the "hot zone". Mary Ellen McGonagle often says that "winners keep on winning" and this could be the case here.
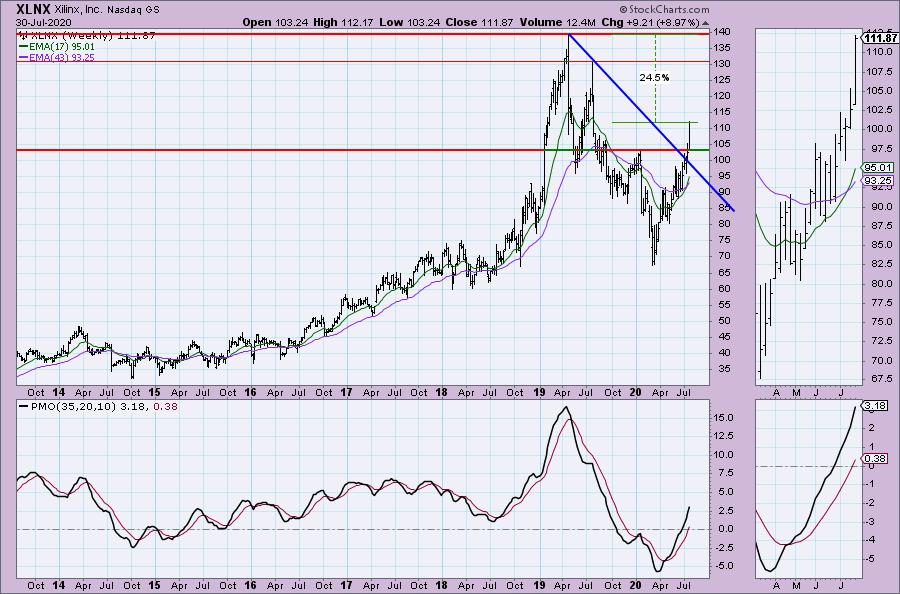
The weekly chart certainly suggest that it will keep on winning. It has broken out of the declining trend this past few weeks and the PMO is rising very nicely and is far from being overbought. If you wanted to, you could make a case for a giant bull flag on this chart with flagpole starting at 2014 low and flag forming in 2019.
Current Market Outlook:
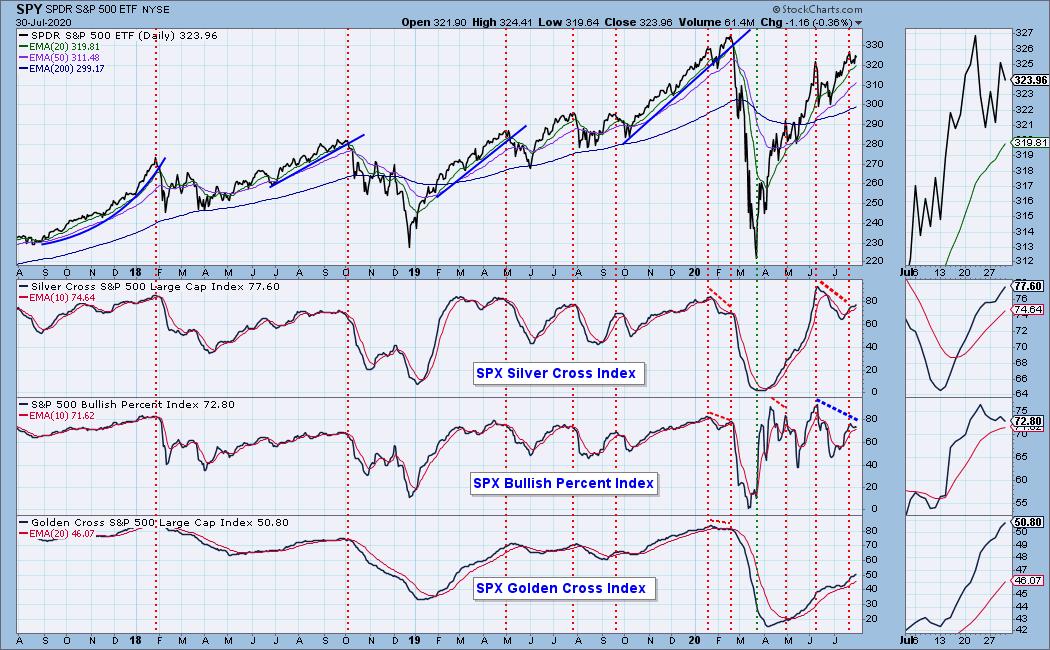
Market Environment: It is important to consider the odds for success by assessing the market tides. The following chart uses different methodologies for objectively showing the depth and trend of participation for intermediate- and long-term time frames.
- The Silver Cross Index (SCI) shows the percentage of SPX stocks on IT Trend Model BUY signals (20-EMA > 50-EMA)
- The Golden Cross Index (GCI) shows the percentage of SPX stocks on LT Trend Model BUY signals (50-EMA > 200-EMA)
- The Bullish Percent Index (BPI) shows the percentage of SPX stocks on Point & Figure BUY signals.
Don't forget that as a "Diamonds" member, you have access to our GCI/SCI curated ChartList on DecisionPoint.com. You'll find it under "Members Only" links on the left side on the Blogs and Links Page.
Here is the current chart:
Diamond Index:
- Diamond Scan Results: 4
- Diamond Dog Scan Results: 7
- Diamond Bull/Bear Ratio: 0.57
Full Disclosure: I added RGEN and LXP to my portfolio. I'm about 65% invested right now as I've closed a few positions on trailing stop triggers. I did add RGEN and LXP to my portfolio this morning. 35% is in 'cash', meaning in money markets and readily available to trade with.
Technical Analysis is a windsock, not a crystal ball.
Happy Charting!
- Erin
erin@decisionpoint.com
ANNOUNCEMENT:
The MoneyShow Las Vegas has been canceled "in person", but I will still be presenting during their video production. As soon as I have information, I will forward it! In the meantime, if you haven't already, click to get your free access pass!

Watch the latest episode of DecisionPoint with Carl & Erin Swenlin on Thursdays 8:00a EST or on the DecisionPoint playlist on the StockCharts TV YouTube channel here!
NOTE: The stocks reported herein are from mechanical trading model scans that are based upon moving average relationships, momentum and volume. DecisionPoint analysis is then applied to get five selections from the scans. The selections given should prompt readers to do a chart review using their own analysis process. This letter is not a call for a specific action to buy, sell or short any of the stocks provided. There are NO sure things or guaranteed returns on the daily selection of "diamonds in the rough."
Helpful DecisionPoint Links:
DecisionPoint Shared ChartList and DecisionPoint Chart Gallery
Price Momentum Oscillator (PMO)
Swenlin Trading Oscillators (STO-B and STO-V)
For more links, go to DecisionPoint.com!