
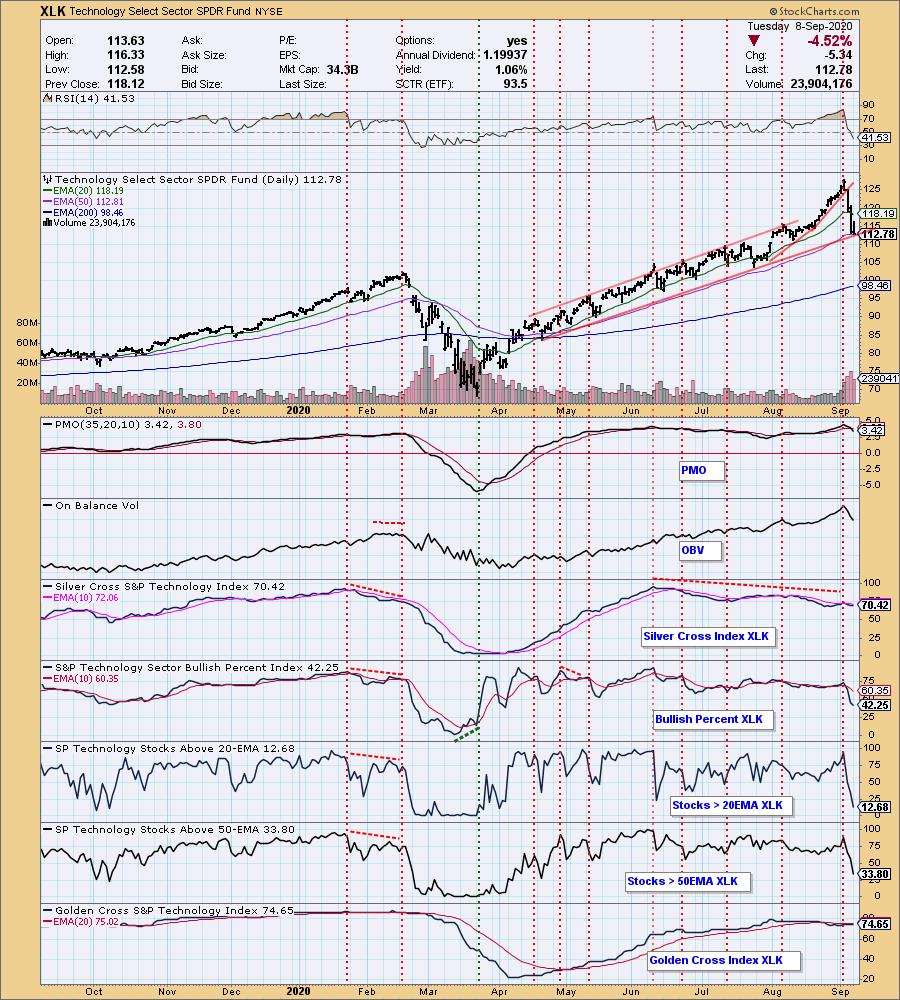
Technology hit the skids. How bad is it? The Technology sector (XLK) chart below shows you the correction. I would say there are two good things about this deep correction. First, of course, is that this sector has been overvalued and run-up to a degree that couldn't be sustained. It needed a pullback or correction. This will eventually open up some bargains in some solid technology companies when it is over. Second good thing would be that price may have found some support at the 50-EMA and rising trend. You can see that today's intraday low is still above the rising trend that began in mid-April. Notice on the chart below how participation has completely fallen as member stocks lose price support at their 20/50-EMAs. Consequently, I do not have any technology stocks in today's Diamond Report.
 Diamond Mine Information:
Recording from Friday (9/4/2020) is at this link. The password to view the recording is: 4DDe4g8+
Register in advance for the next "DecisionPoint Diamond Mine" trading room on Friday (9/11) 12:00p EST:
Here is this week's registration link. Password: wisdom
Please do not share these links! They are for Diamonds subscribers ONLY!

Click here to register in advance for the recurring free DecisionPoint Trading Room (Next one is 9/14)! Did you miss the 8/31 trading room? Here is a link to the recording (password: V#^P89Yv).
Welcome to DecisionPoint Daily Diamonds, wherein I highlight five "diamonds in the rough." These are selected from the results of my DecisionPoint scans, which search for stocks that could benefit from the trend and condition of the market. Remember, these are not recommendations to buy or sell, but are the most interesting of the stocks that surfaced in my scans. My objective is to save you the work of the initial, tedious culling process, but you need to apply your own analysis to see if these stocks pique your interest as well. There are no guaranteed winners here!
GFL Environmental Holdings Inc (GFL)
EARNINGS: 11/5/2020 (AMC)
GFL Environmental, Inc. engages in the provision of ecological solutions. It operates through the following segments: Solid Waste; Infrastructure and Soil Remediation; Liquid Waste; and Corporate. The Solid Waste segment includes hauling, landfill, transfers, and material recovery facilities. The Infrastructure and Soil Remediation provides remediation of contaminated soils as well as complementary services, including civil, demolition, excavation, and shoring services. The Liquid Waste segment collects, transports, processes, recycles, and disposes liquid wastes from commercial and industrial customers. The company was founded by Patrick Dovigi in 2007 and is headquartered in Vaughan, Canada.
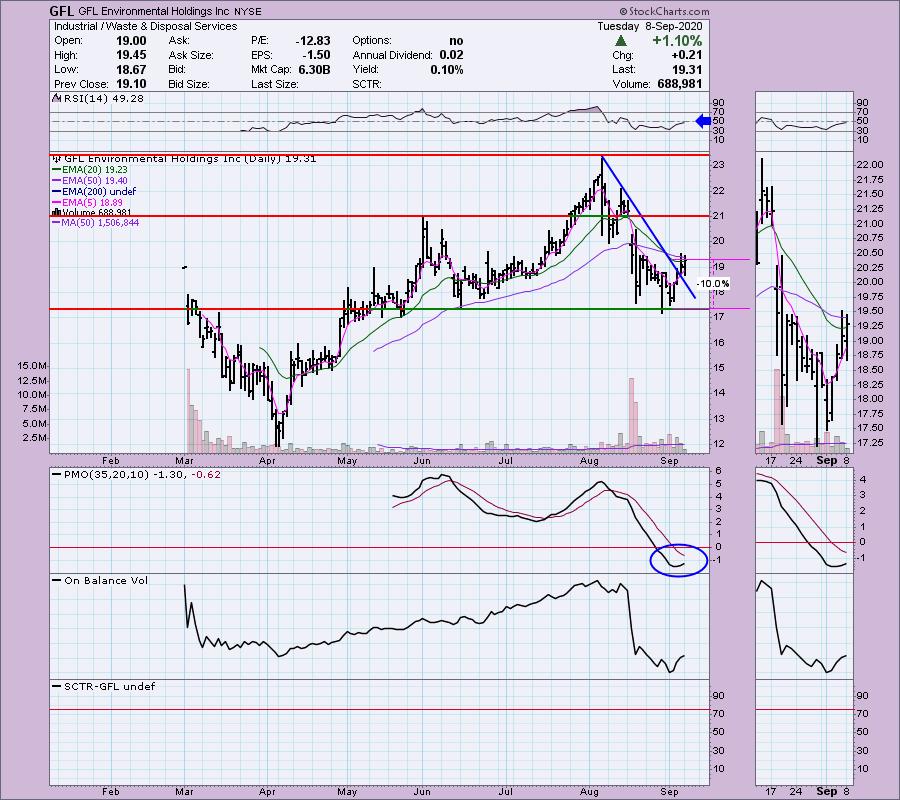
Up slightly (+0.05%) in after hours trading, GFL is in the Waste & Disposal Services industry group. With technology plunging downward, I am looking for stocks that could be considered "defensive" and this one fits that bill. On Friday GFL broke out of its steep declining trend. Currently the RSI is negative, but it should hit positive territory soon. This is a new stock and unfortunately that means we don't have a lot of data to judge whether the PMO is oversold or not. What we do know is that the PMO is turning up. It's deep stop unfortunately, but if you time your entry, you may be able to mitigate that somewhat.
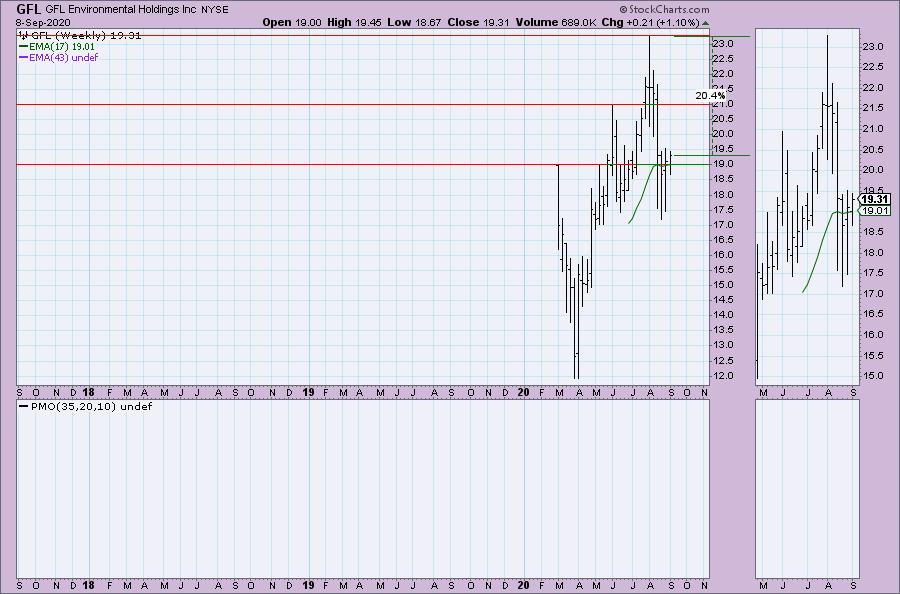
If price can recapture its 2020 high, that would be a 20% gain. As I noted above, there isn't enough price data to calculate a weekly PMO.
Heron Therapeutics Inc (HRTX)
EARNINGS: 11/9/2020 (AMC)
Heron Therapeutics, Inc. is a biotechnology company, which engages in the development of pharmaceutical products for patients suffering from cancer. Its products portfolio include SUSTOL, Cinvanti, HTX-011, and HTX-034. The company was founded in February 1983 and is headquartered in Redwood City, CA.
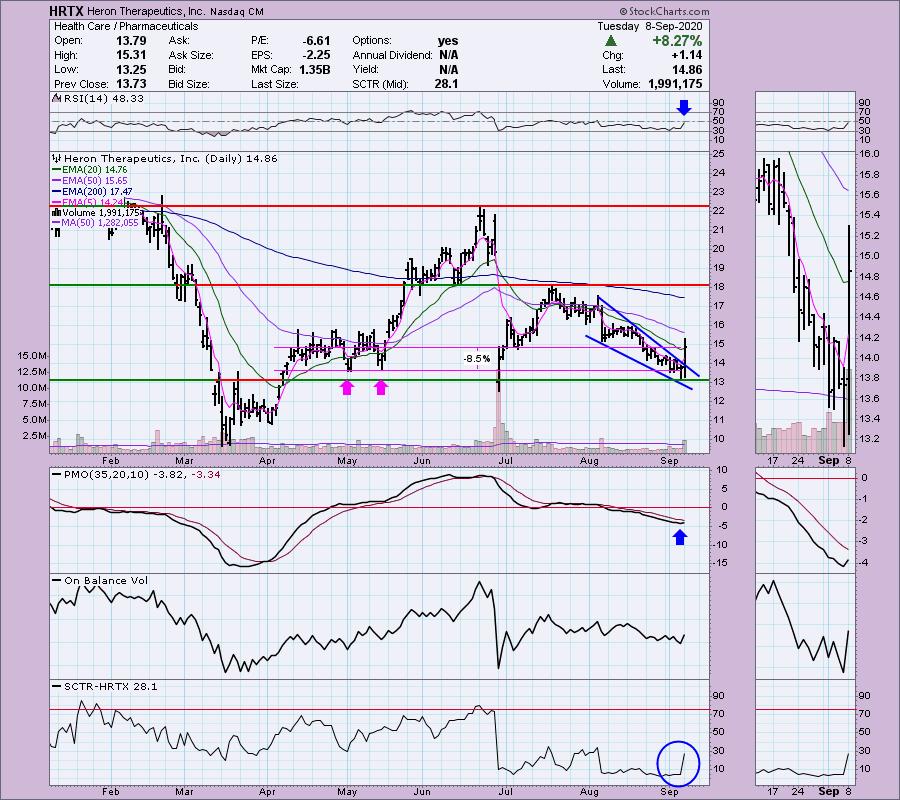
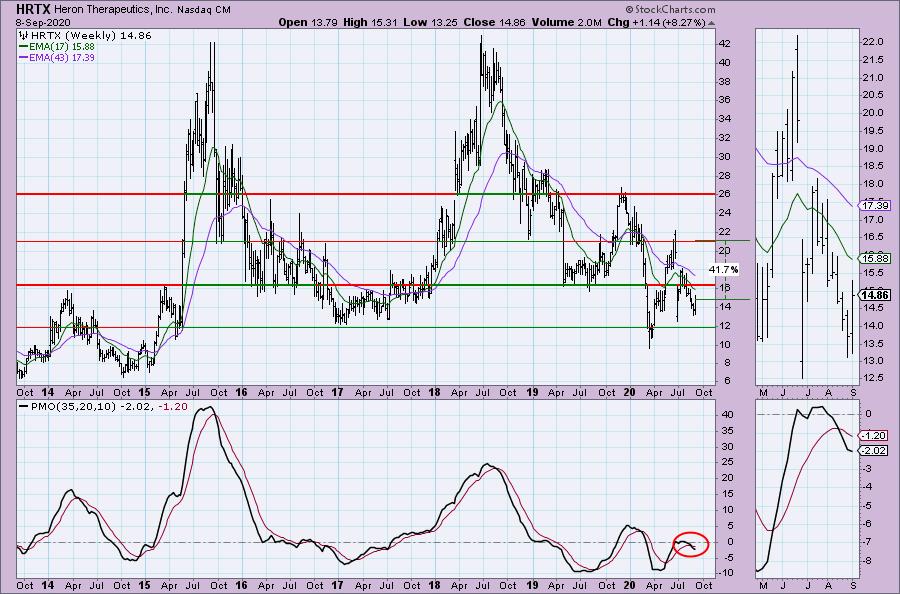
Currently down -0.57% in after hours trading, there could be some profit taking going on. I would want to watch it on a 5-min bar chart before entering. Today's breakout executed a bullish falling wedge pattern. Price found its way back above the 20-EMA after a month below it. The PMO has turned up and we did see quite a bit of volume come in on this pop. I lined up the stop level low on the May bottoms rather than the September low; mainly so I could avoid a 11-12% stop level.
There is overhead resistance waiting just above $16 that could pose a problem, but if it can move above it, there is plenty of upside potential. The weekly PMO is declining, but at least it is decelerating.
Don't forget, on Thursdays I look at reader-requested symbols, so shoot me an email at erin@decisionpoint.com. I read every email I receive and try to answer them all!
QuinStreet Inc (QNST)
EARNINGS: 11/5/2020 (AMC)
QuinStreet, Inc. engages in the provision of media management services. It operates through the United States and International geographical segments. Its platform offers performance marketing products based from number of clicks, inquiries, calls, applications, and full customer acquisitions. The company was founded by Douglas Valenti on April 16, 1999 and is headquartered in Foster City, CA.
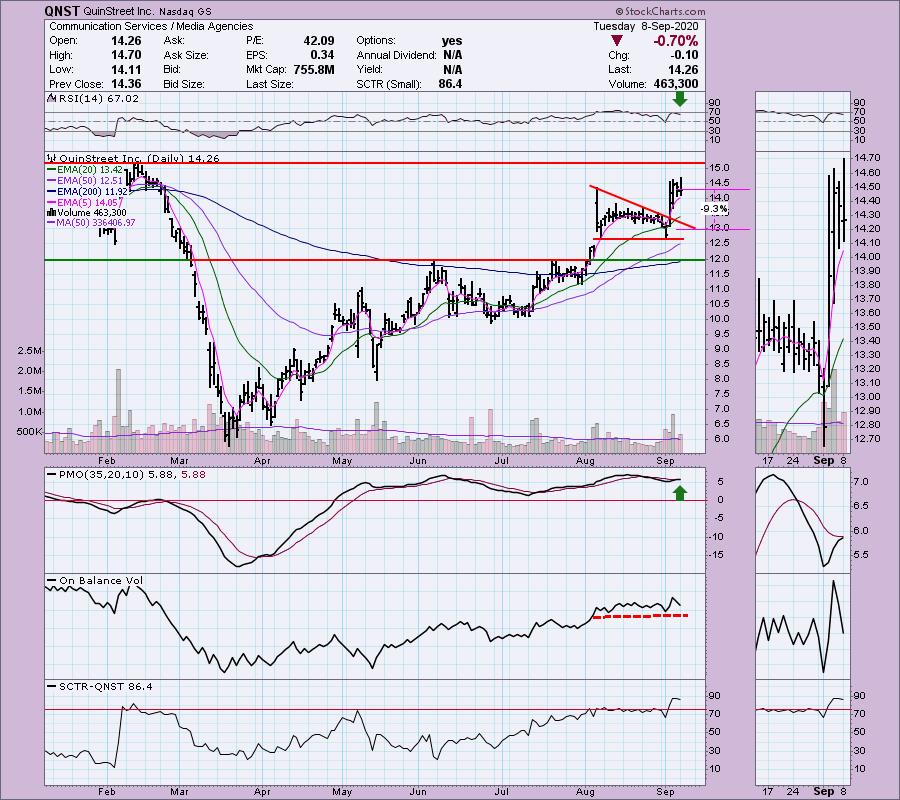
QuinStreet (QNST) was one of the two Diamond PMO Scan results today. The other scan result was Tupperware (TUP), but I felt it was too overbought. I see a short-term bull flag on an upside breakout from a bearish descending triangle. I always like stocks that buck the bearish chart pattern. The PMO is about to give us a BUY signal and the RSI, while falling, is now out of overbought territory. OBV bottoms were rising slightly as price bottoms were flat. I set the stop level at the mid-August price bottoms.
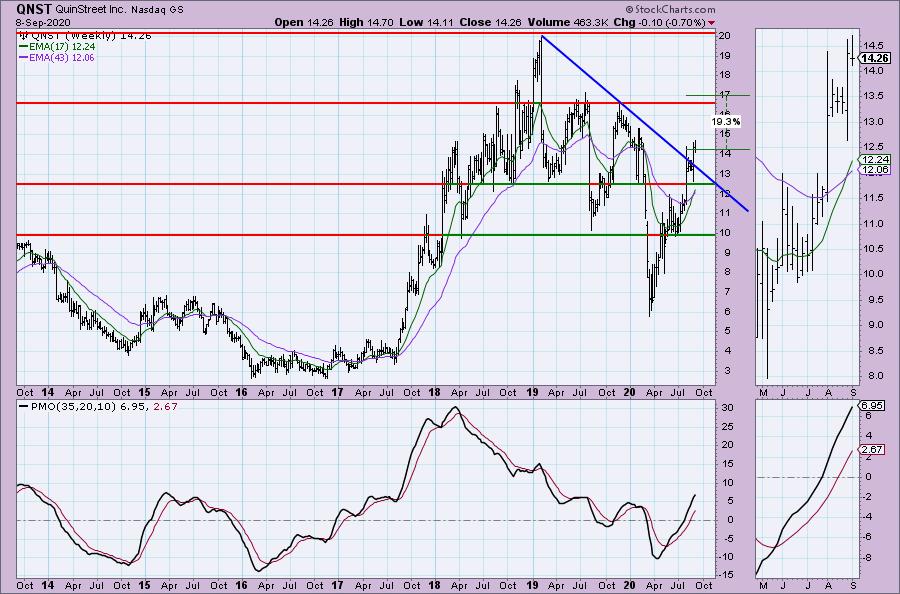
I like the weekly PMO and on an intermediate-term basis, price has broken out of a declining trend that began after the 2019 top. If price can get back above those 2019 tops, it's an almost 20% gain.
Scorpio Tankers Inc (STNG)
EARNINGS: 11/5/2020 (BMO)
Scorpio Tankers, Inc. engages in the provision of marine transportation of petroleum products. It operates through the following segments: Handymax, MR, LR1/Panamax, and LR2/Aframax. The company was founded by Emanuele A. Lauro on July 1, 2009 and is headquartered in Monaco.
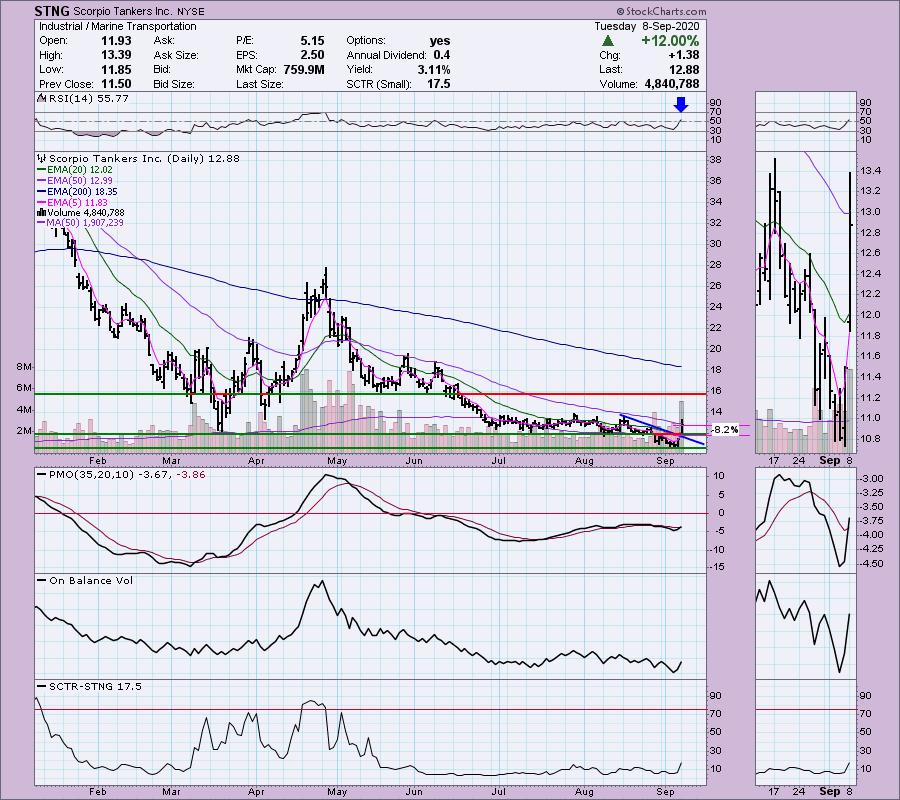
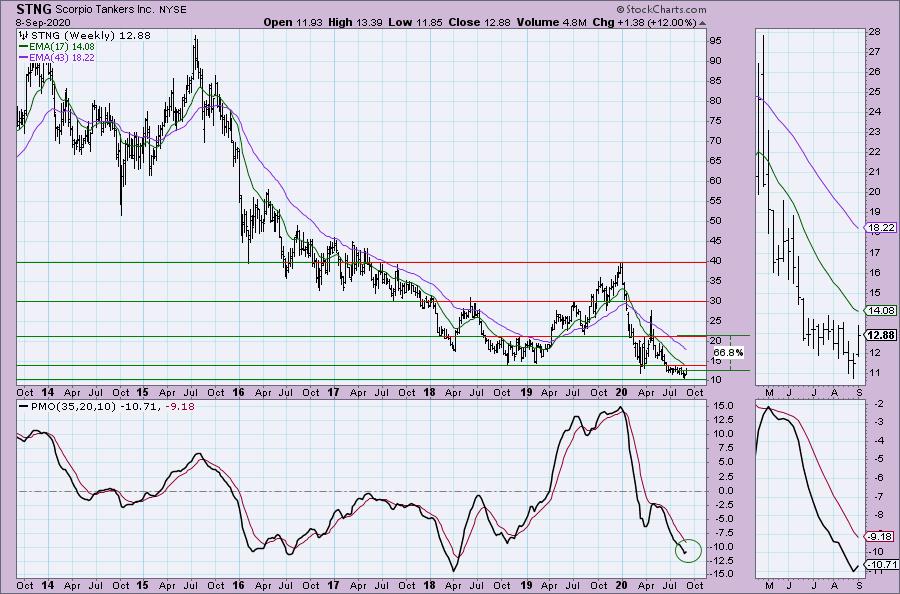
Down -0.15% in after hours trading, I really struggled with including this one. The set-up is great, but after a 12% gain, it definitely could use a pullback. The breakout was notable today. I looked up news on STNG to figure out why it popped today. Apparently they are buying back stock, so I have to wonder if we will see some follow-through on today's rally. Based on currently analytics, it looks pretty good. The PMO triggered a BUY signal and the RSI moved into positive territory. I would set up a stop at the July lows. You should be aware that STNG hit it's all-time intraday low on Friday.
Upside potential is huge here. It was really hurt with the virus and could continue to be vulnerable. The PMO ticked upward, mainly on the 12% gain today. We will have to see if we get followthrough.
ZYNEX Inc (ZYXI)
EARNINGS: 10/27/2020 (AMC)
Zynex, Inc. engages in the design, manufacture, and marketing of medical devices. It sells electrotherapy medical devices used for pain management and rehabilitation. The company also develops a new blood volume monitor for use in hospitals and surgery centers. Zynex was founded by Thomas Sandgaard in 1996 and is headquartered in Englewood, CO.
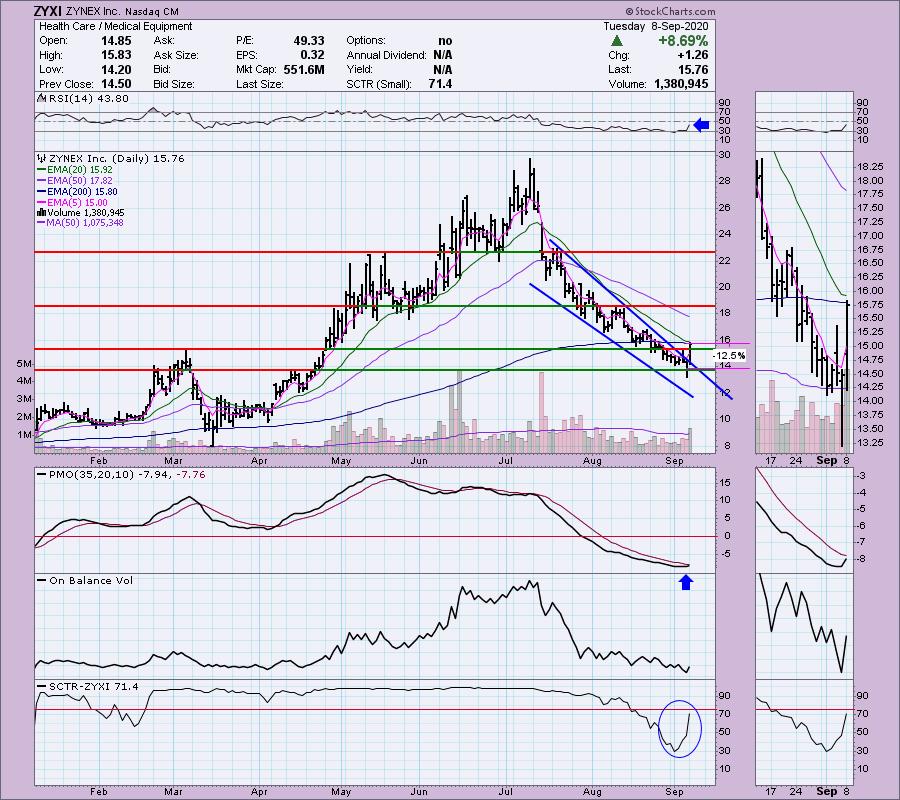
Down -0.38% in after hours trading, ZYXI was a reader request from the June 18th Diamond Report. For the record, I was bullish on that pick at $24.50. It did rise past $29, but since that peak it has been sliding lower. Granted it was an 8.69% gain today so it isn't surprising to see the PMO rising in oversold territory and the RSI improving. The SCTR really popped this month. Price hasn't closed above the 200-EMA yet and I think that will be crucial if we expect a follow-on rally. Keep it on the watch list and determine if today's pop was a precursor to better things. I believe it is, but I would want to time my entry appropriately. The stop is very deep here which is another reason to look for a better entry if possible.
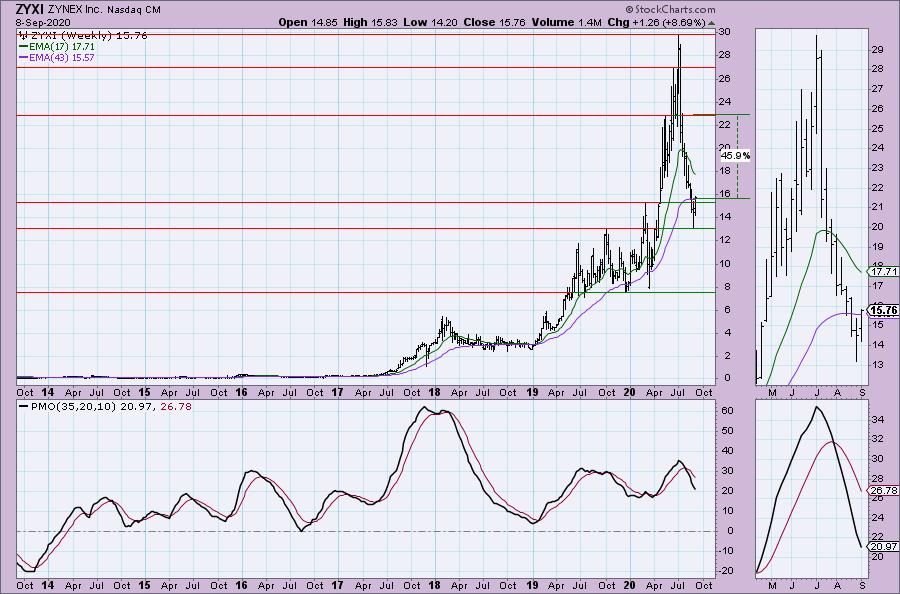
Price moved above that early 2020 high and actually closed above the 43-week EMA again. Unfortunately, the weekly PMO is stinky and not in line with an intermediate-term horizon.
Full Disclosure: I do not trust the market right now and am not adding any new positions. I'm about 50% invested and 50% is in 'cash', meaning in money markets and readily available to trade with.
Current Market Outlook:
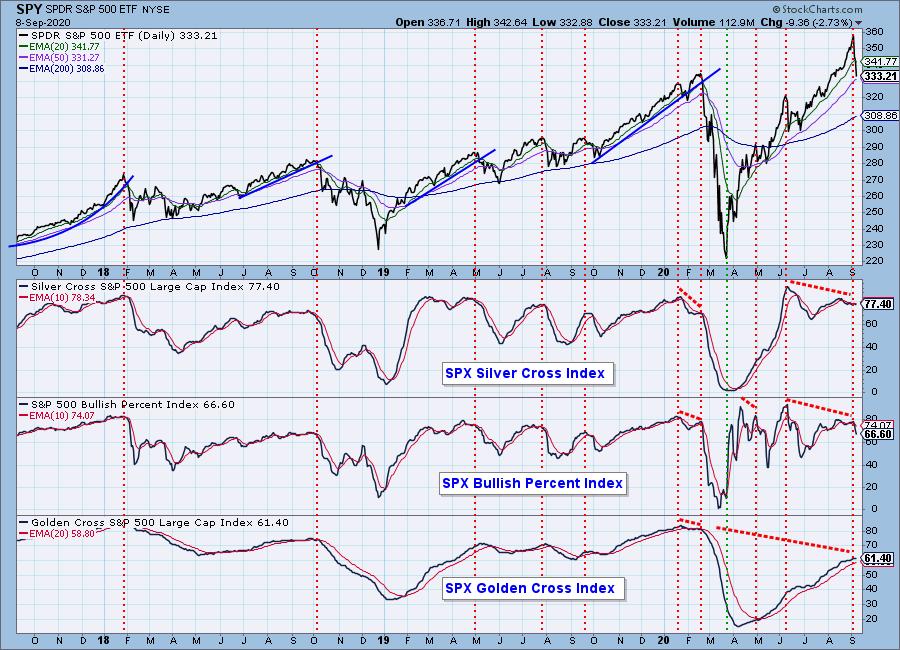
Market Environment: It is important to consider the odds for success by assessing the market tides. The following chart uses different methodologies for objectively showing the depth and trend of participation for intermediate- and long-term time frames.
- The Silver Cross Index (SCI) shows the percentage of SPX stocks on IT Trend Model BUY signals (20-EMA > 50-EMA)
- The Golden Cross Index (GCI) shows the percentage of SPX stocks on LT Trend Model BUY signals (50-EMA > 200-EMA)
- The Bullish Percent Index (BPI) shows the percentage of SPX stocks on Point & Figure BUY signals.
Don't forget that as a "Diamonds" member, you have access to our GCI/SCI curated ChartList on DecisionPoint.com. You'll find it under "Members Only" links on the left side on the Blogs and Links Page.
Here is the current chart:
Diamond Index:
- Diamond Scan Results: 2
- Diamond Dog Scan Results: 11
- Diamond Bull/Bear Ratio: 0.18
Technical Analysis is a windsock, not a crystal ball.
Happy Charting!
- Erin
erin@decisionpoint.com
Watch the latest episode of DecisionPoint with Carl & Erin Swenlin on Mondays 7:00p EST or on the DecisionPoint playlist on the StockCharts TV YouTube channel here!
NOTE: The stocks reported herein are from mechanical trading model scans that are based upon moving average relationships, momentum and volume. DecisionPoint analysis is then applied to get five selections from the scans. The selections given should prompt readers to do a chart review using their own analysis process. This letter is not a call for a specific action to buy, sell or short any of the stocks provided. There are NO sure things or guaranteed returns on the daily selection of "diamonds in the rough."
Helpful DecisionPoint Links:
DecisionPoint Shared ChartList and DecisionPoint Chart Gallery
Price Momentum Oscillator (PMO)
Swenlin Trading Oscillators (STO-B and STO-V)
For more links, go to DecisionPoint.com!