
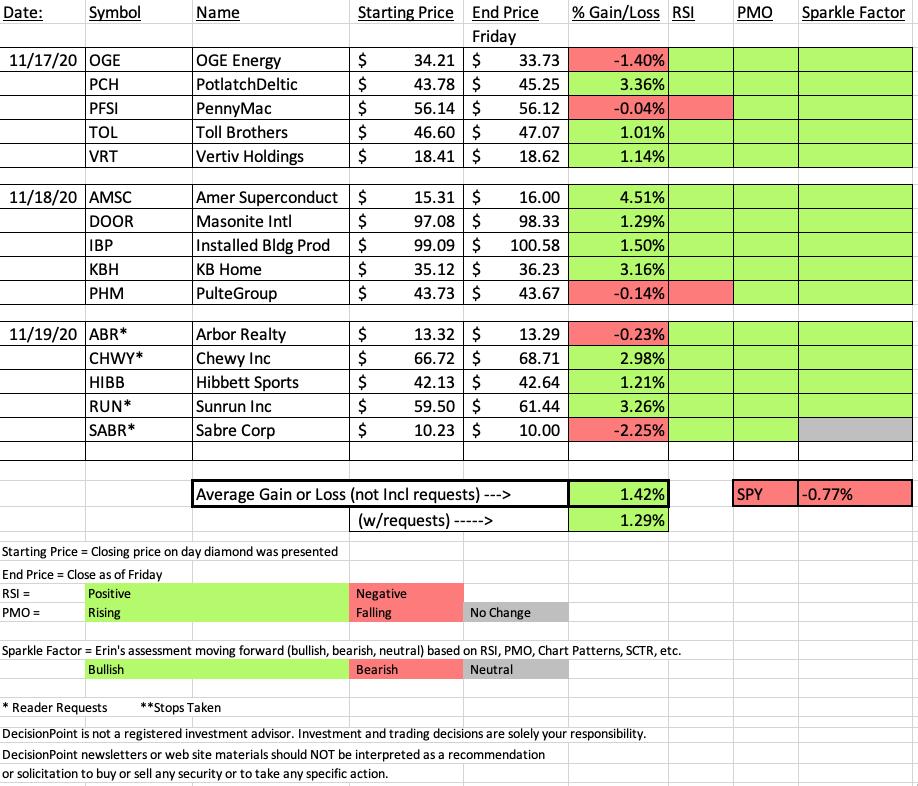
The purpose of the Diamonds Report is to do the scanning for you, select candidates that are bullish based on the DecisionPoint Analysis Process and then explain the analysis. It's not really a stock picking service, but we do recap the week and if our Diamonds outperform the SPY, I will of course let you know! This week we beat the SPY by 2.19%! Best week since I've been tracking recaps! I have begun to save the recap spreadsheets so I can go back and check on the progress of those Diamonds. I did a quick relook at last week's recap. We only have one loser and it is down about 2.7%.
This week's biggest gainer was American Superconductor (AMSC) which finished the week up 4.51%. The biggest loser of mine was OGE Energy (OGE) which is down only -1.4%. I'll take a relook at both of these stocks. You'll also notice that I'm bullish going forward on all but one and that one is a Neutral.
The new Diamond Mine registration link is available below. PLEASE NOTE: There will not be a Diamond Mine trading room next Friday. Publishing schedule for DP Diamonds next week: Mon/Tue (11 "diamonds in the rough" total) and a Diamond Recap on Friday afternoon.
 Diamond Mine Information:
Here is today's (11/20/2020) recording link. Access Passcode: @f#x+6qP
Register in advance for the next "DecisionPoint Diamond Mine" trading room on Friday (12/4/2020) 12:00p ET:
Here is the registration link for Friday, 12/4/2020. Password: turkey
Please do not share these links! They are for Diamonds subscribers ONLY!
A few items about the spreadsheet: I decided it only fair to denote "reader requests" as I shouldn't get to take credit if they turn out great! I've put on the spreadsheet whether the RSI is positive (green) or negative (red). The PMO column tells you if it is rising (green) or falling (red). Finally I've added my own "Sparkle Factor" that gives you my assessment going forward, bullish (green), bearish (red) or neutral (gray). The Sparkle Factor is basically my thoughts on whether I expect it to rise or fall. A neutral means it could really go either way so it could be added to a watch list. If you're in a stock I consider "neutral" going forward, the ball is in your court.

It's FREE!
***Click here to register for this recurring free DecisionPoint Trading Room!***
Did you miss the 10/26 (no meeting on 11/2) trading room? Here's a link to the recording (Passcode: X+2gJfpd)
For best results, copy and paste the password to avoid typos.
DUD:
OGE Energy Corp. (OGE)
EARNINGS: 2/25/2021 (BMO)
OGE Energy Corp. is a holding company, which engages in the provision of physical delivery and related services for both electricity and natural gas. It operates through the Electric Utility and Natural Gas Midstream Operations segments. The Electric Utility segment generates, transmits, distributes, and sells electric energy in Oklahoma and Western Arkansas. The Natural Gas Midstream Operations segment involves gathering, processing, transporting, storing, and marketing of natural gas. The company was founded in August 1995 and is headquartered in Oklahoma City, OK.
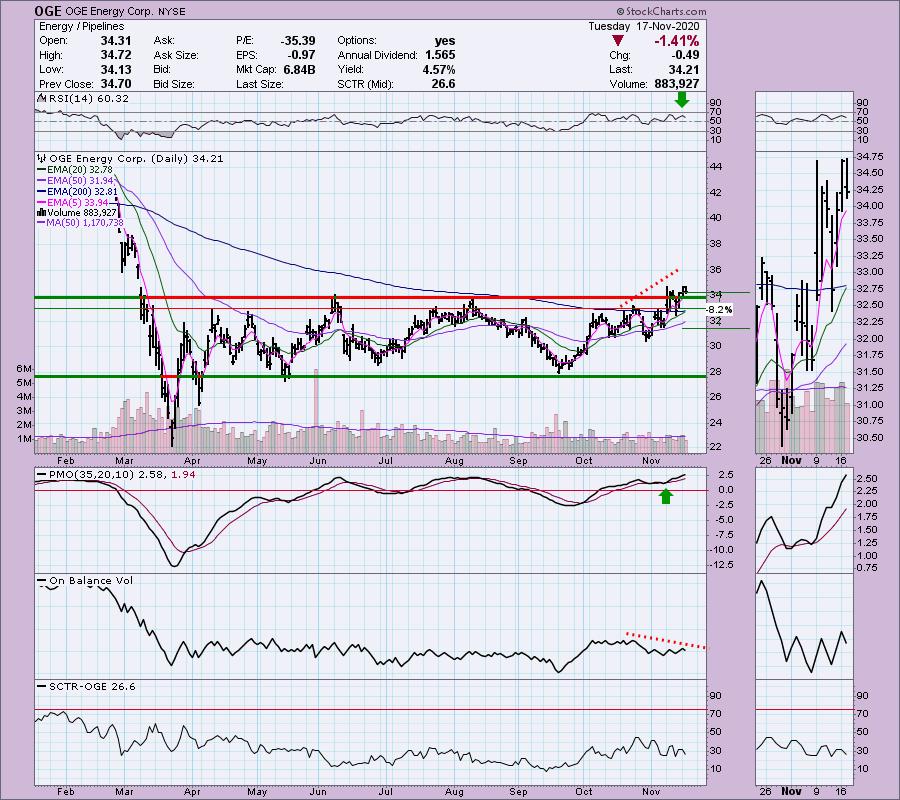
Below is the chart and write-up from Tuesday 11/17:
"This Energy sector chart caught my eye due to its recent breakout above its longer-term trading range. Yesterday's breakout was accompanied by a pullback today which generally means a good entry is soon. The PMO is on a BUY signal but is a bit overbought. It's overbought right now, but price is not overextended as the RSI is positive and not overbought. I'm not thrilled with the OBV negative divergence. The SCTR is very low, but that seems symptomatic of the Energy sector as a whole. The main thing is that it is in a newly hot sector of the market, it has a great breakout, momentum is positive and the RSI is positive. I set the stop based on the earlier November low. If price drops below the 50-EMA, you don't want this one."
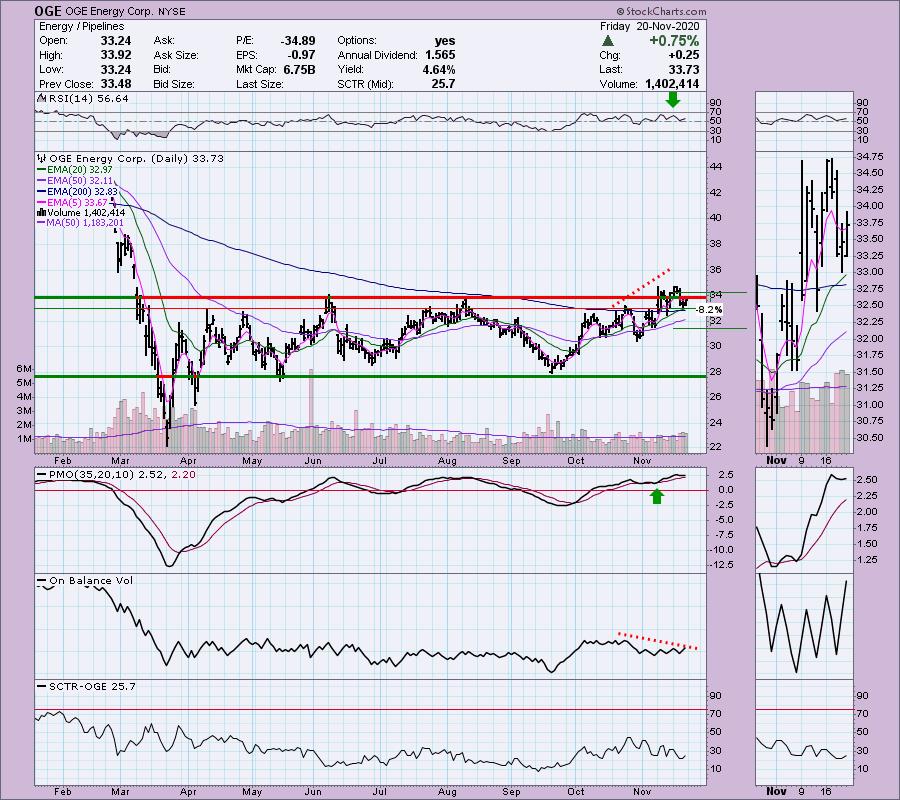
Let's look at the updated chart. Price wasn't able to hold the breakout, but it did hold the 20-EMA. I would be willing to keep this one around and look for that all important breakout from this intermediate-term trading range. A sustained breakout would be excellent. The PMO had turned down, but it is moving higher again, forming a bottom above the signal line. The OBV negative divergence is still in play unfortunately, but this one is poised to do well if that breakout can hold.
Don't forget, on Thursdays I look at reader-requested symbols, so shoot me an email at erin@decisionpoint.com. I read every email I receive and try to answer them all!
Darling:
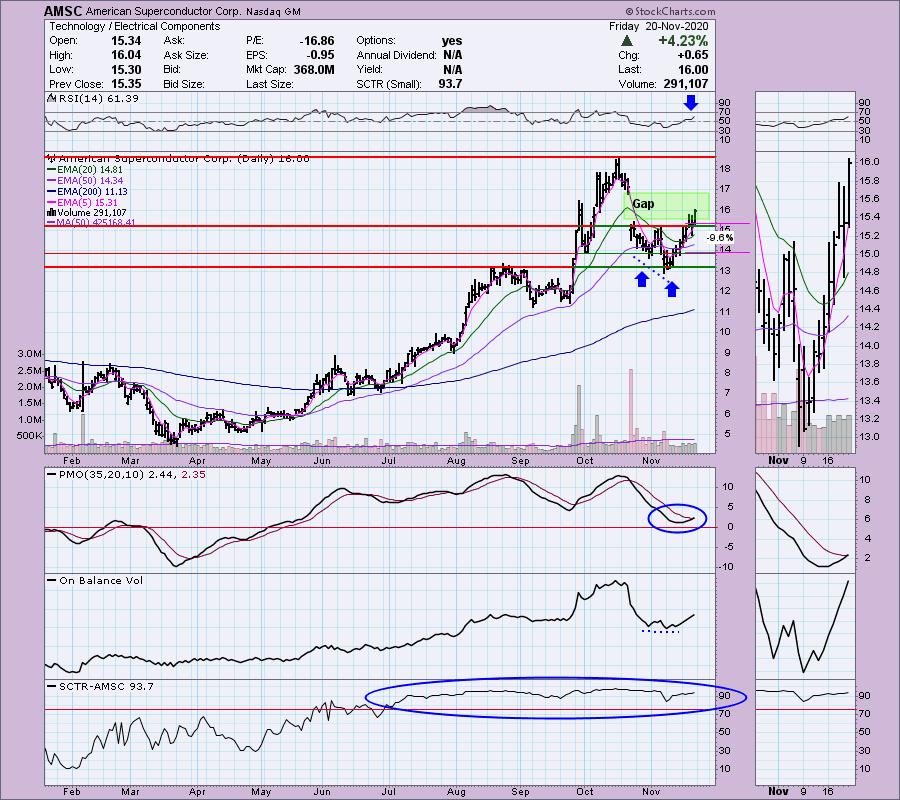
American Superconductor Corp. (AMSC)
EARNINGS: 2/3/2021 (AMC)
American Superconductor Corp. engages in provision of megawatt-scale power solutions which improve the performance of the power grid and lower the cost of wind power. It operates through Grid and Wind segments. The Grid segment enables electric utilities and renewable energy project developers to connect, transmit, and distribute power with efficiency, reliability, security, and affordability. The Wind segment permits the manufacturers to field wind turbines with power output, reliability, and affordability. The company was founded by Yet-Ming Chiang, David A. Rudman, John B. Vander Sande, and Gregory J. Yurek on April 9, 1987 and is headquartered in Ayer, MA.
Here is Wednesday's write-up on AMSC:
"Up +1.18% in after hours trading, AMSC is a semiconductor. Technology is not showing leadership right now, but small-caps are and the setup is pretty sweet. Many of the charts these days have double-bottoms and of course not all of them will execute, but if they are accompanied by positive indicators, their chances of resolving upward are high. The double-bottom on AMSC executed today. Price popped above the confirmation line and then pulled back during the day but held support. There is strong gap resistance to muddle through, but the RSI is positive and rising and the PMO is bottoming above the zero line. This is a small-cap and we are seeing them outperforming so that is a plus too. While we don't have a perfect OBV positive divergence, I do note that the OBV bottoms are flat while the double-bottom has a sharply lower low. The SCTR is great too."
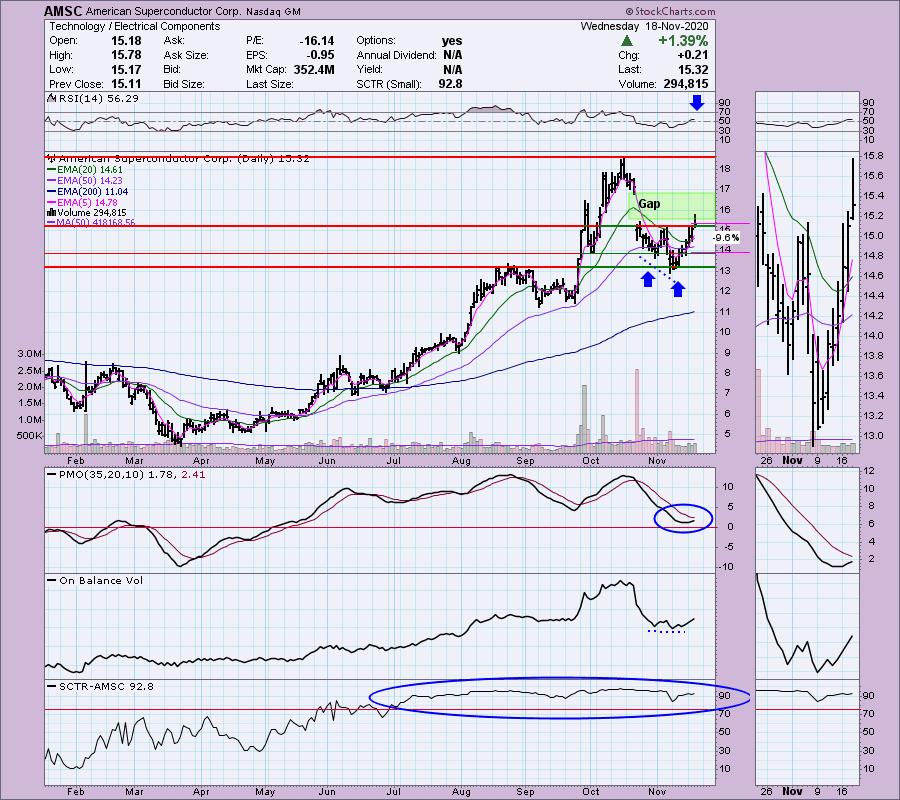
I love the follow-through on AMSC. While it still must make its way through the gap and that could be somewhat difficult. However, given the very positive indicators, I don't think it will have too much trouble.
THIS WEEK's Sector Performance:
CONCLUSION:
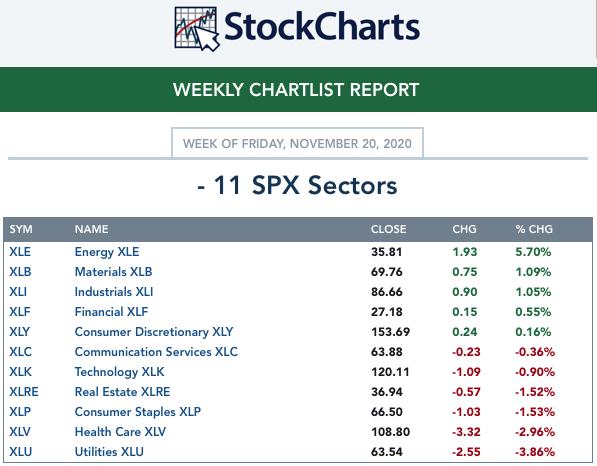
The market continues to look weak going forward, but I am finding that "diamonds in the rough" are outperforming regardless and therefore, if there are bullish scan results to be had, I will find them. I believe we may still be able to find some Energy (XLE) sector stocks next week, but I suspect Materials (XLB) and Financials (XLF) will be where the scan results lead.
Sector to Watch: Energy Sector (XLE)
Industry Group to Watch: Integrated Oil & Gas ($DJUSOL)
Go to our Sector ChartList on DecisionPoint.com to get an in depth view of all the sectors.
Have a Great Weekend! Happy Charting!
- Erin
erin@decisionpoint.com
Full Disclosure: I'm about 45% invested right now and 55% is in 'cash', meaning in money markets and readily available to trade with.
Technical Analysis is a windsock, not a crystal ball.
Watch the latest episode of DecisionPoint with Carl & Erin Swenlin on Mondays 7:00p EST or on the DecisionPoint playlist on the StockCharts TV YouTube channel here!
NOTE: The stocks reported herein are from mechanical trading model scans that are based upon moving average relationships, momentum and volume. DecisionPoint analysis is then applied to get five selections from the scans. The selections given should prompt readers to do a chart review using their own analysis process. This letter is not a call for a specific action to buy, sell or short any of the stocks provided. There are NO sure things or guaranteed returns on the daily selection of "diamonds in the rough."
Helpful DecisionPoint Links:
DecisionPoint Shared ChartList and DecisionPoint Chart Gallery
Price Momentum Oscillator (PMO)
Swenlin Trading Oscillators (STO-B and STO-V)
For more links, go to DecisionPoint.com!