
I had been wondering why I wasn't seeing many Energy sector stocks coming through on my scans when it occurred to me that except for a few bottom fishing scans, my regular scans all require the 50-EMA to be greater than the 200-EMA which means it would be on a "Golden Cross" as far as our Golden Cross Index is concerned.
Well the Energy sector has been extraordinarily beat down this year due to COVID and a large decrease in demand. I decided to do a search using just the sector summary and industry group summaries on StockCharts.com. I zeroed in on a few Energy sector stocks that could be poised to continue their run higher. I only found one that appealed to me in the Pipelines industry group, but I will be keeping an eye on this area as long as Energy remains hot (no pun intended).
Real Estate has been awakening and I found a stock in this sector through my Momentum Sleepers Scan. I continue to crow the virtues of the Industrial sector so not surprisingly, I have included one.
I have a stock from the Financial sector, another one where we are seeing relative strength. This stock has been a fixture in my scans, but until today, I felt it wasn't ready to be a "diamond in the rough".
The final stock is from Consumer Discretionary. That sector isn't particularly "hot", but I did find a stock that is set-up nicely and is a bit of an Industrial sector crossover.
Today's "Diamonds in the Rough" are: OGE, PCH, PFSI, TOL and VRT.
 Diamond Mine Information:
Here is Friday November 6th's recording link. I apologize, but I forgot to hit the record button for last Friday's Diamond Mine. I have left the recording link available from 11/6 using the Access Passcode: #g8G^J&3
Register in advance for the next "DecisionPoint Diamond Mine" trading room on Friday (11/20/2020) 12:00p ET:
Here is the registration link for Friday, 11/20/2020. Password: resource
Please do not share these links! They are for Diamonds subscribers ONLY!

It's Free!
***Click here to register for this recurring free DecisionPoint Trading Room on Mondays at Noon ET!***
Did you miss the 11/16 free trading room? Here is a link to the recording. Access Code: =8STr92*
For best results, copy and paste the access code to avoid typos.
Welcome to DecisionPoint Daily Diamonds, wherein I highlight five "diamonds in the rough." These are selected from the results of my DecisionPoint scans, which search for stocks that could benefit from the trend and condition of the market. Remember, these are not recommendations to buy or sell, but are the most interesting of the stocks that surfaced in my scans. My objective is to save you the work of the initial, tedious culling process, but you need to apply your own analysis to see if these stocks pique your interest as well. There are no guaranteed winners here!
OGE Energy Corp. (OGE)
EARNINGS: 2/25/2021 (BMO)
OGE Energy Corp. is a holding company, which engages in the provision of physical delivery and related services for both electricity and natural gas. It operates through the Electric Utility and Natural Gas Midstream Operations segments. The Electric Utility segment generates, transmits, distributes, and sells electric energy in Oklahoma and Western Arkansas. The Natural Gas Midstream Operations segment involves gathering, processing, transporting, storing, and marketing of natural gas. The company was founded in August 1995 and is headquartered in Oklahoma City, OK.
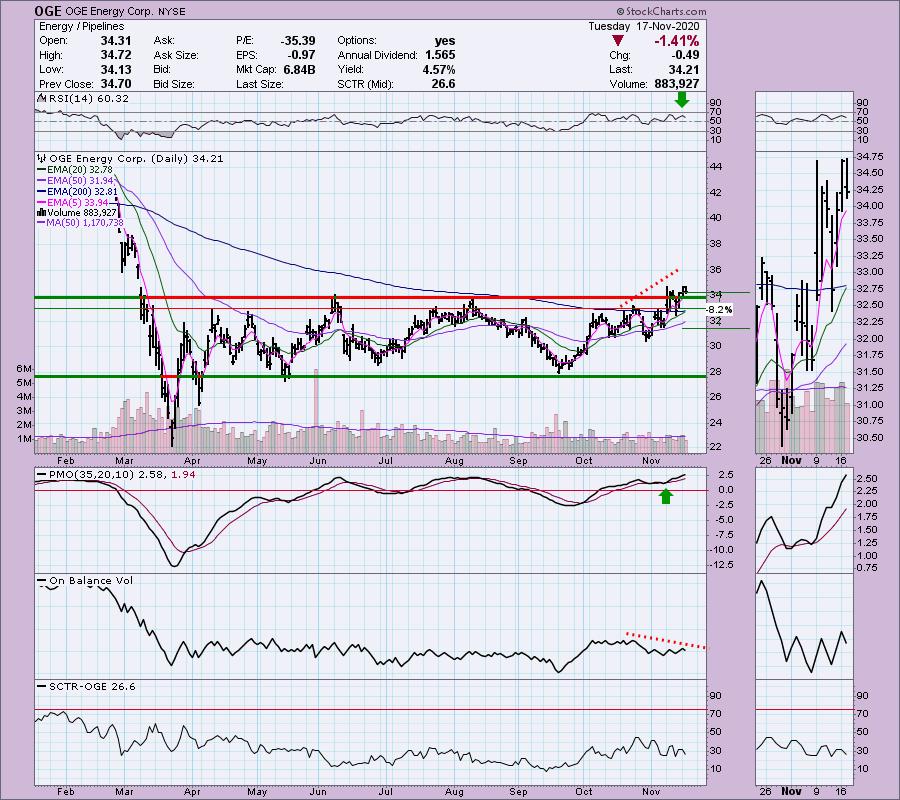
This Energy sector chart caught my eye due to its recent breakout above its longer-term trading range. Yesterday's breakout was accompanied by a pullback today which generally means a good entry is soon. The PMO is on a BUY signal but is a bit overbought. It's overbought right now, but price is not overextended as the RSI is positive and not overbought. I'm not thrilled with the OBV negative divergence. The SCTR is very low, but that seems symptomatic of the Energy sector as a whole. The main thing is that it is in a newly hot sector of the market, it has a great breakout, momentum is positive and the RSI is positive. I set the stop based on the earlier November low. If price drops below the 50-EMA, you don't want this one.
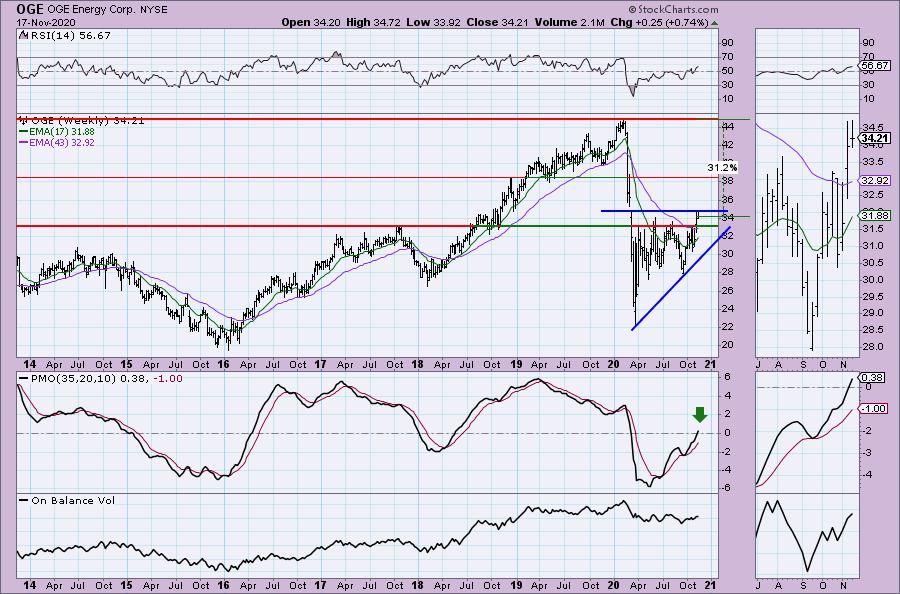
This might be the best weekly chart of the day. The PMO is not only on a BUY signal, it has reached positive territory for the first time since the bear market. Upside potential is great and given the bullish ascending triangle, I am looking for a breakout to cover the gap made in March.
PotlatchDeltic Corp. (PCH)
EARNINGS: 2/1/2021 (AMC)
PotlatchDeltic Corp. operates as a real estate investment trust. The firm engages in the ownership and management of acres of timberlands. It operates through the following segments: Resource, Wood Products and Real Estate. The Resource segment includes planting and harvesting trees, building and maintaining roads, hunting leases, recreation permits, biomass production and carbon sequestration. The Wood Products segment produces and trades lumber, plywood and residuals. The Real Estate segment markets and sells land holdings. The company was founded in 1903 and is headquartered in Spokane, WA.
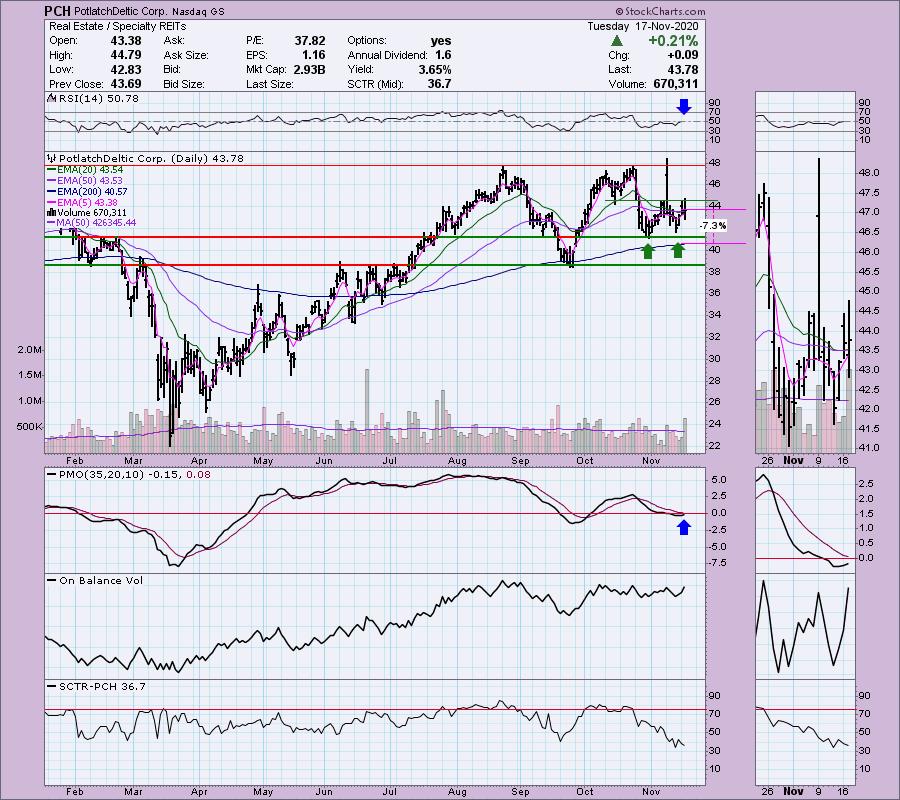
I chose this Real Estate sector stock based on the short term. I have marked a bullish double-bottom, but I am not using the top of the "Pinocchio" bar as Martin Pring likes to call those OHLC bars. The close was well within the pattern so I've adjusted the confirmation line lower. The PMO is turning up just as the RSI is reaching positive territory. I've set the stop below the pattern on the 200-EMA.
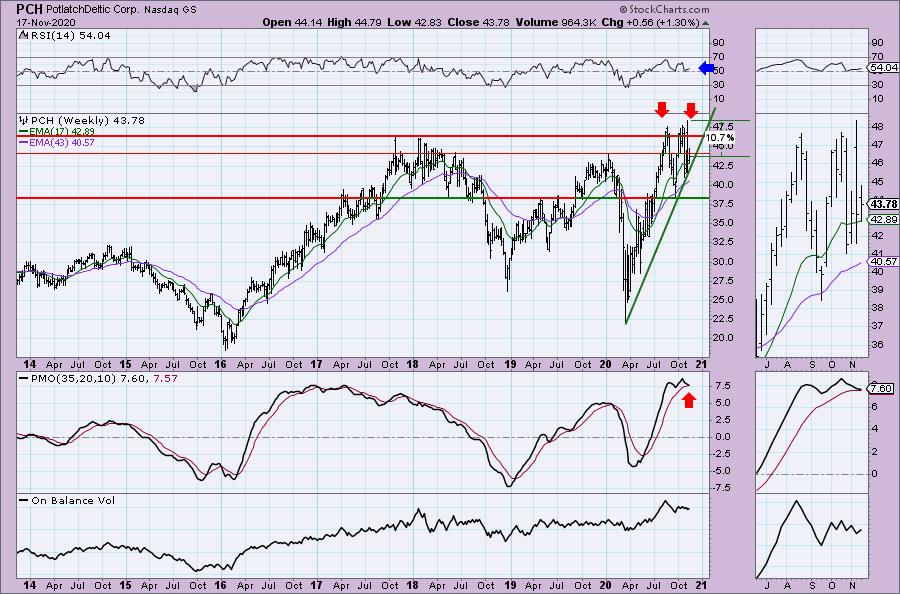
The weekly PMO appears ready to trigger a SELL signal in the intermediate term. We do have an IT double-top, but the rising trend hasn't been breached yet and the RSI is positive. We should be able to get past the all-time high.
Don't forget, on Thursdays I look at reader-requested symbols, so shoot me an email at erin@decisionpoint.com. I read every email I receive and try to answer them all!
PennyMac Financial Services, Inc. (PFSI)
EARNINGS: 2/4/2021 (AMC)
PennyMac Financial Services, Inc. is a holding company, which engages in the production and servicing of U.S. residential mortgage loans. It operates through the following segments: Production, Servicing, and Investment Management. The Production segment includes mortgage loan origination, acquisition, and sale activities. The Servicing segment offers servicing of newly originated mortgage loans; and execution and management of early buyout transactions. The Investment Management segment consists of sourcing; performing diligence; bidding and closing investment asset acquisitions; managing correspondent production activities; and managing the acquired assets. The company was founded by Stanford L. Kurland on July 2, 2008 and is headquartered in Westlake Village, CA.
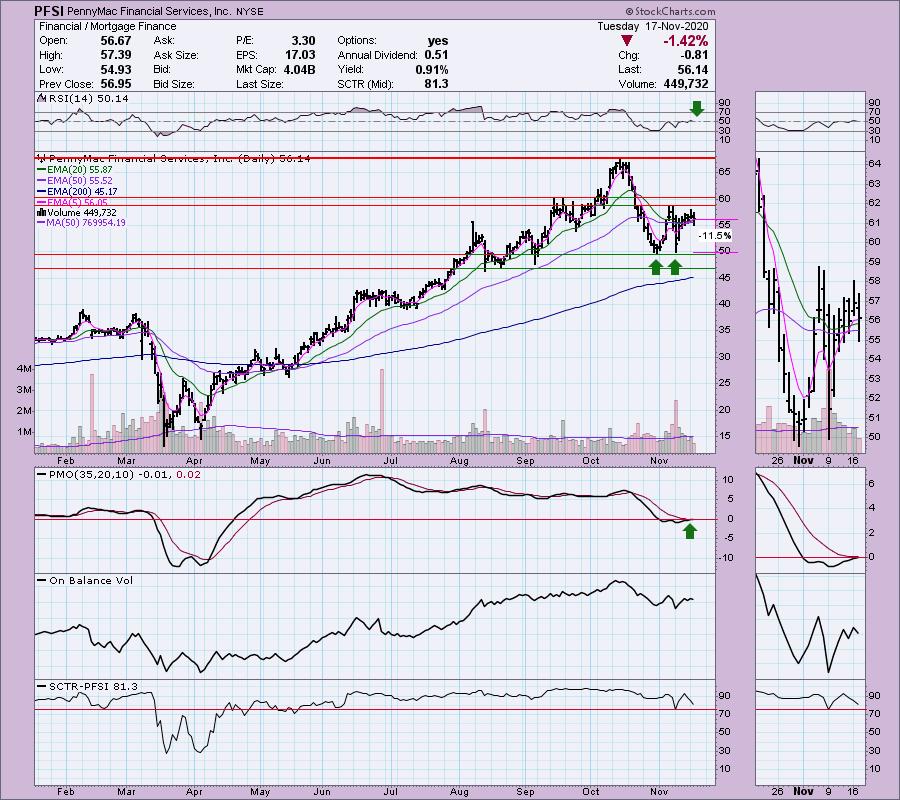
As I noted in the intro, PFSI has been sitting in my scan results for about four days. You can see that not much happened over that time, but now that the PMO has triggered the BUY signal and the RSI moved positive, I think it is ready for prime time. There is a weird looking double-bottom, but it is a double-bottom nonetheless. Price hasn't tested the confirmation line successfully, but it hasn't lost its short-term rising trend either. The stop level is rather deep. I would likely not wait for it to drop that far. If it can't successfully hold the 20/50-EMAs, it is likely ready to test the November low before breaking out.
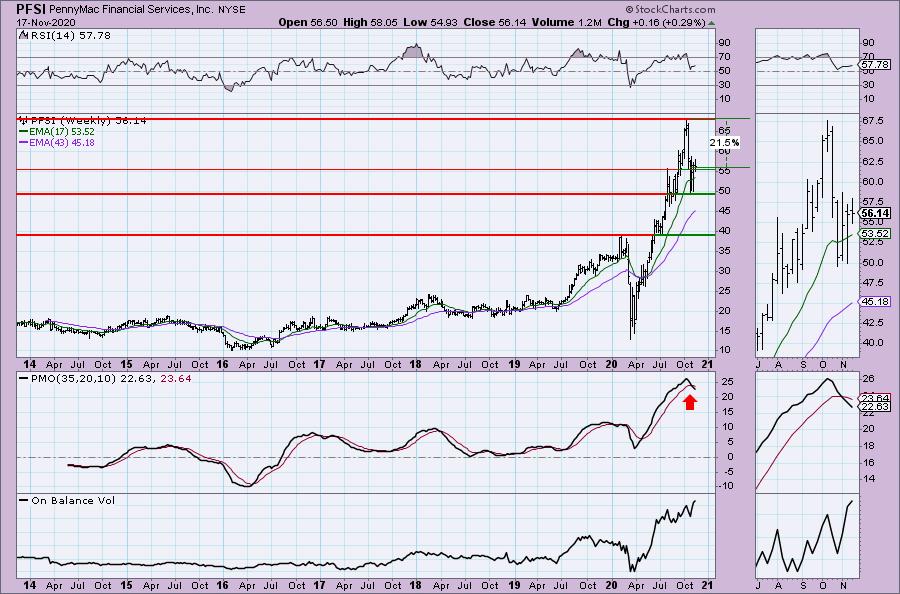
Not a pretty weekly chart except for the positive RSI. We have a reverse divergence between OBV tops and price tops which are declining. So despite volume pouring in, price hasn't been able to test its all-time high. The PMO is on a SELL signal. I'd keep this one on a short-term leash.
Toll Brothers, Inc. (TOL)
EARNINGS: 12/7/2020 (AMC)
Toll Brothers, Inc. engages in the design, building, marketing, and arranging of financing for detached and attached homes in residential communities. It operates through the following segments: Traditional Home Building and City Living. The Traditional Home Building segment builds and sells homes for detached and attached homes in luxury residential communities in affluent suburban markets and and cater to move-up, empty-nester, active-adult, age-qualified, and second-home buyers. The City Living segment builds and sells homes in urban infill markets through Toll Brothers City Living. The company was founded by Robert I. Toll and Bruce E. Toll in May 1986 and is headquartered in Horsham, PA.
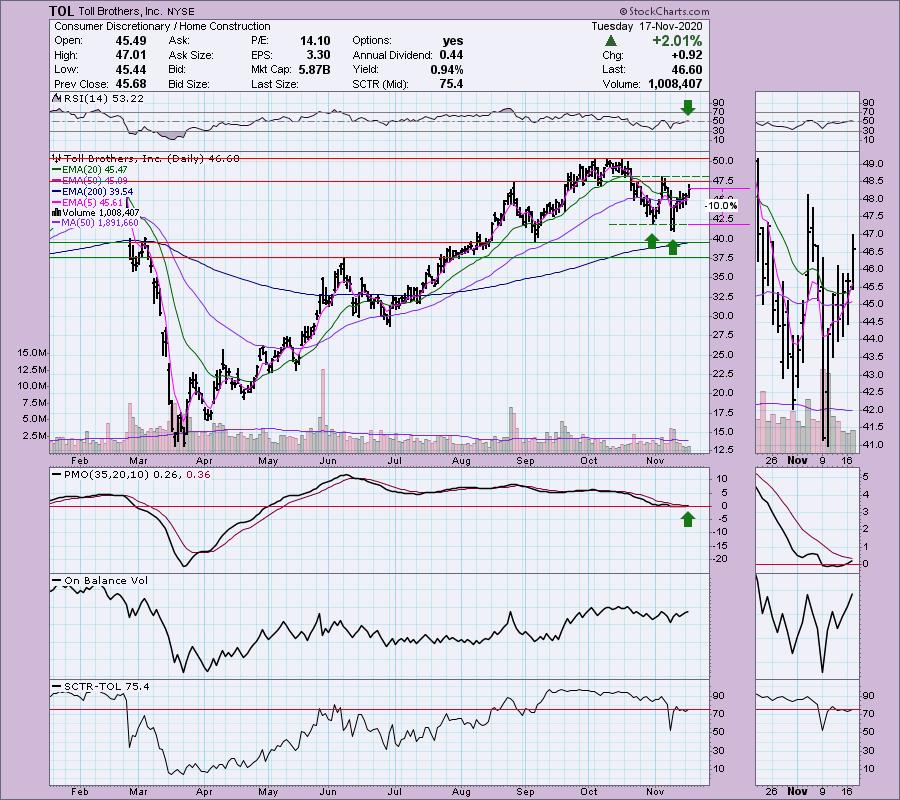
Toll Brothers has formed a bullish double-bottom and is making its way up to the confirmation line. The RSI just moved positive and the PMO is just about ready to trigger a BUY signal. The SCTR just poked up into the "hot zone" above 75. The stop level is deep even set at the first bottom of the double-bottom pattern. This is another where I would likely pass on it or sell it should it fail at the confirmation line. I don't think I would ride down that low.
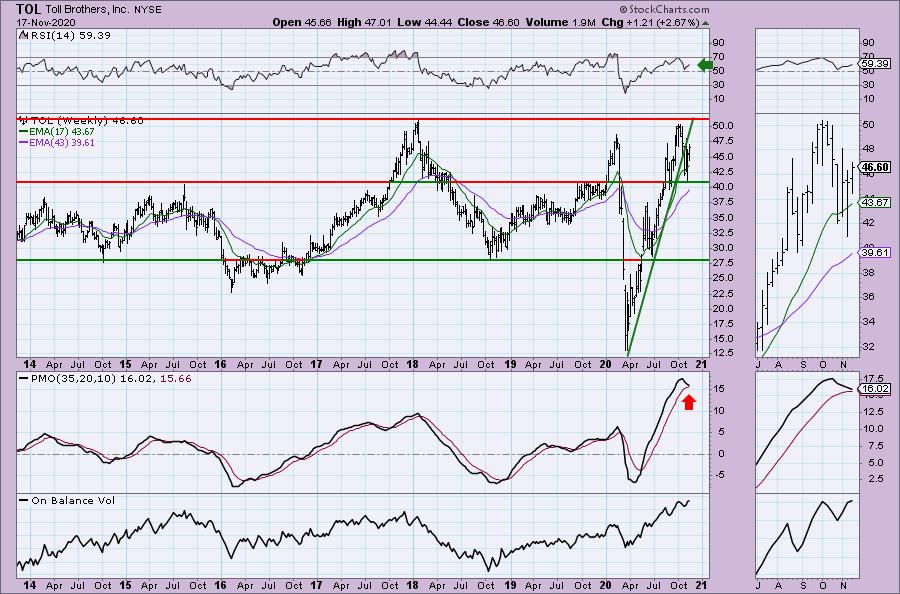
Another not so pretty weekly chart except for the positive RSI. The rising trend has been broken, the PMO is readying for a SELL signal. Volume is confirming the rally and we should note that price pulled back to a strong support area at the 2015 top and bounced upward. I believe we could make new all-time highs despite the PMO (which, btw, is flattening and could avoid the SELL signal).
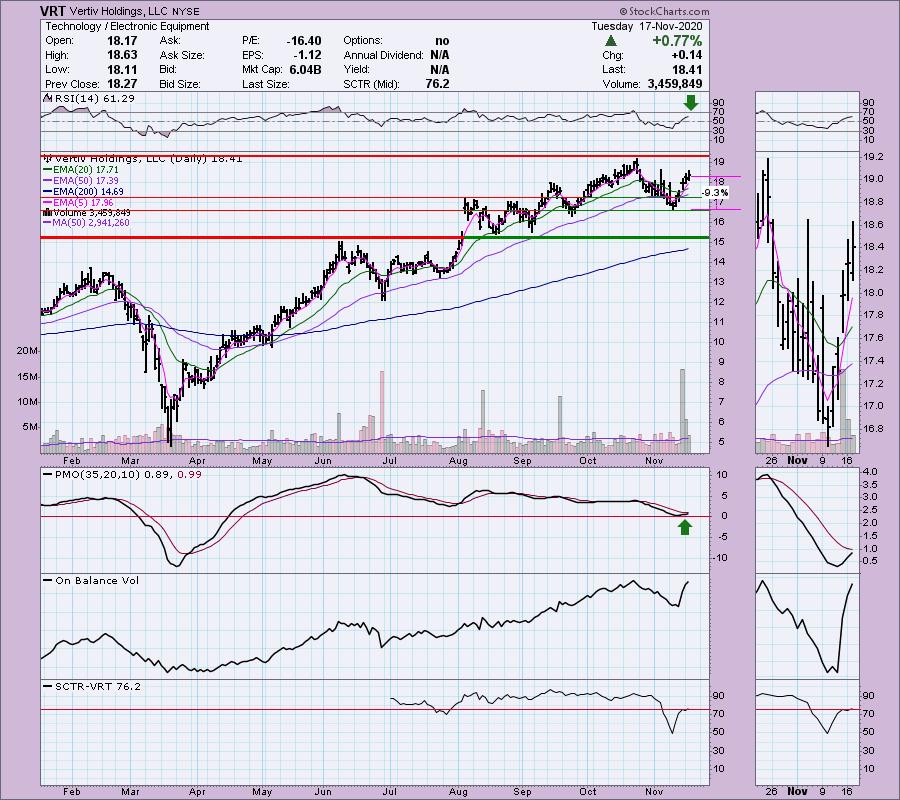
Vertiv Holdings, LLC (VRT)
EARNINGS: 3/10/2021 (BMO)
Vertiv Holdings Co. engages in the design, manufacturing, and servicing of critical digital infrastructure technology that powers, cools, deploys, secures and maintains electronics that process, store and transmit data. It also offers power management products, thermal management products, integrated rack systems, modular solutions, and management systems for monitoring and controlling digital infrastructure. It carries out its operations in the following geographical segments: Americas, Asia Pacific, and EMEA. The company was founded on February 7, 2020 and is headquartered in Columbus, OH.
I nearly didn't include this one because it is an LLC which can complicate tax preparation on your investments. However, the chart is so bullish I couldn't resist. The PMO turned up just above the zero line. It's been in a steady rising price trend and its "personality" is to test the 50-EMA and move higher. This time price stretched out below the 50-EMA, but it has made a nice recovery. The RSI is positive and not overbought and the SCTR just reached the "hot zone" above 75.
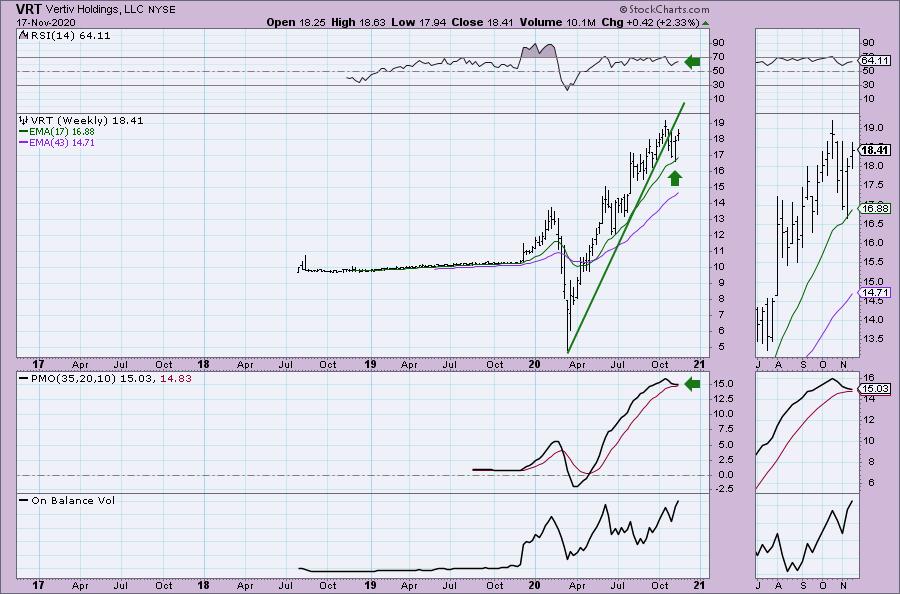
I note that we don't have much information on the weekly chart, but the RSI is positive and although the PMO is topping, it is also flattening as price rebounds off the 17-week EMA.
Full Disclosure: I'm about 40% invested and 60% is in 'cash', meaning in money markets and readily available to trade with.
Current Market Outlook:
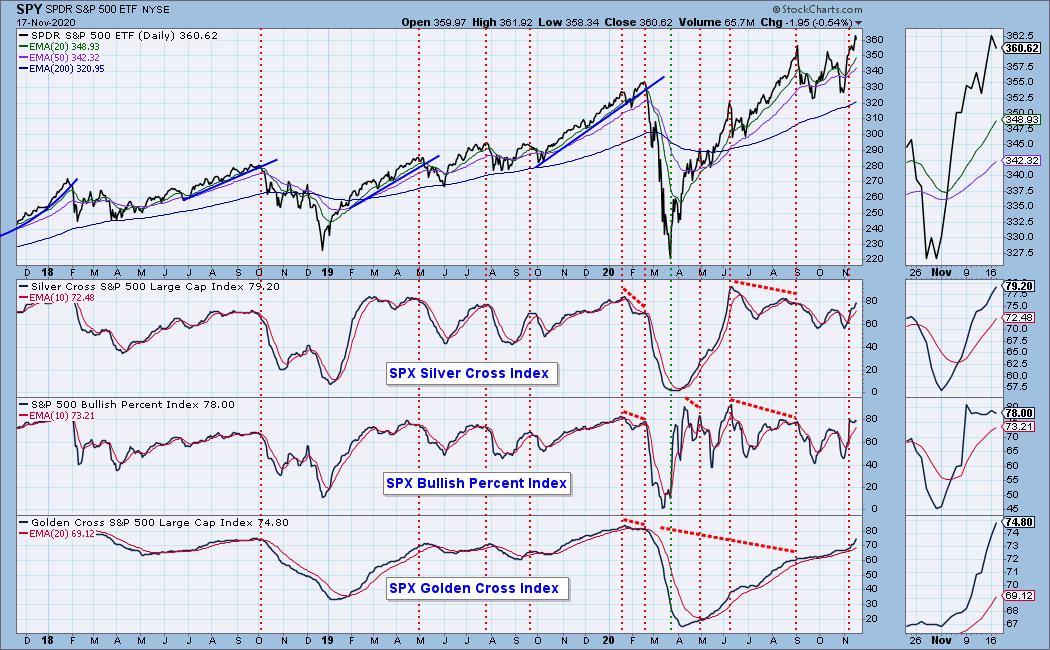
Market Environment: It is important to consider the odds for success by assessing the market tides. The following chart uses different methodologies for objectively showing the depth and trend of participation for intermediate- and long-term time frames.
- The Silver Cross Index (SCI) shows the percentage of SPX stocks on IT Trend Model BUY signals (20-EMA > 50-EMA)
- The Golden Cross Index (GCI) shows the percentage of SPX stocks on LT Trend Model BUY signals (50-EMA > 200-EMA)
- The Bullish Percent Index (BPI) shows the percentage of SPX stocks on Point & Figure BUY signals.
Don't forget that as a "Diamonds" member, you have access to our GCI/SCI curated ChartList on DecisionPoint.com. You'll find it under "Members Only" links on the left side on the Blogs and Links Page.
Here is the current chart:
Diamond Index:
- Diamond Scan Results: 10
- Diamond Dog Scan Results: 5
- Diamond Bull/Bear Ratio: 2.00
I'm in the process of trying to plot the Diamond Index, but with time at a premium, it is on the back burner.
Technical Analysis is a windsock, not a crystal ball.
Happy Charting!
- Erin
erin@decisionpoint.com
Watch the latest episode of DecisionPoint with Carl & Erin Swenlin on Mondays 7:00p EST or on the DecisionPoint playlist on the StockCharts TV YouTube channel here!
NOTE: The stocks reported herein are from mechanical trading model scans that are based upon moving average relationships, momentum and volume. DecisionPoint analysis is then applied to get five selections from the scans. The selections given should prompt readers to do a chart review using their own analysis process. This letter is not a call for a specific action to buy, sell or short any of the stocks provided. There are NO sure things or guaranteed returns on the daily selection of "diamonds in the rough."
Helpful DecisionPoint Links:
DecisionPoint Shared ChartList and DecisionPoint Chart Gallery
Price Momentum Oscillator (PMO)
Swenlin Trading Oscillators (STO-B and STO-V)
For more links, go to DecisionPoint.com!