
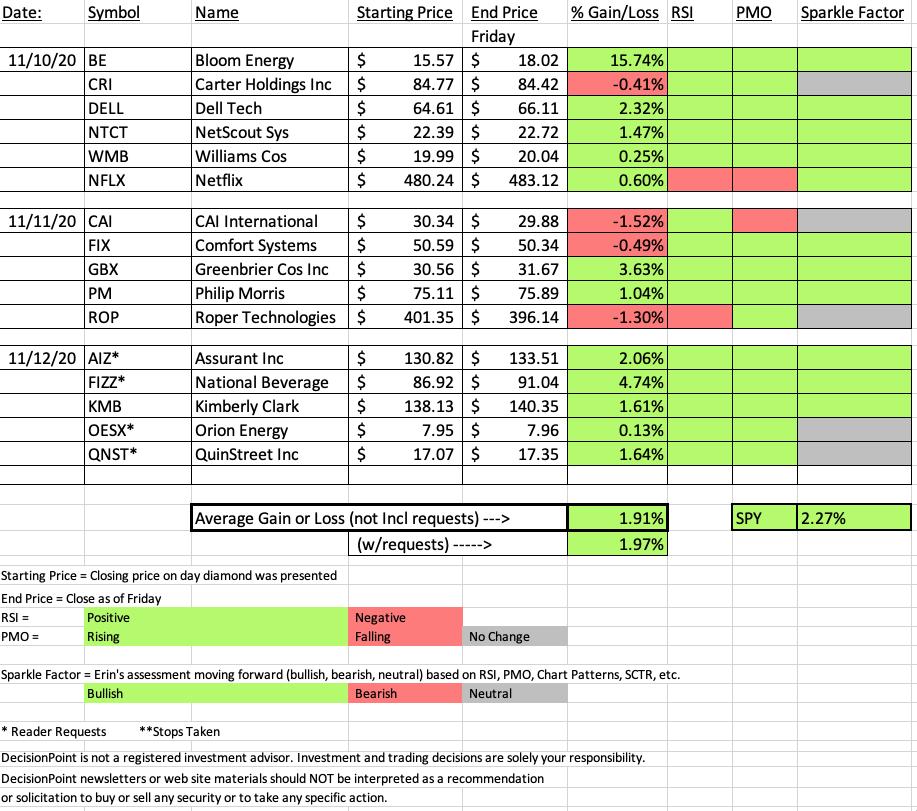
While we often see Diamonds outperform, this was a particularly good week for one of our Industrial sector picks. As far as our "Diamond of the Week" for free subscribers, Netflix (NFLX), it was up on the week and continues to hold important support. I am patiently waiting for the RSI and PMO to move positive as price action should warrant that change soon. I still like it and own it. Another update, Athenex (ATNX) from last week I never ended up selling. The chart is beginning to improve so I'm going to hold it. Harley (HOG) I still own but am determining whether to sell part of my position to lock in some big profits. This week's "darling" was Bloom Energy (BE) so I'll take a gander at that chart. This week's "dud" was CAI International (CAI). Be sure and read my ChartWatchers article tonight, I will unveil my "Diamond of the Week" Fastly Inc (FSLY). I picked this one previously on 8/27 and it did very well, until it didn't. It had a HUGE correction after running up quickly, but it poised right now to explode.
I apologize that I forgot to hit the "record" button this morning during the Diamond Mine! I am so very sorry. I do have the links for the next Diamond Mine below and I will leave the link to last week's Diamond Mine recording. Important: when you sign up for the Diamond Mine or the DP Trading Room, Zoom should immediately send you information on how to join. They are supposed to send out emails one hour before with the link to remind you, but I've found out that you can't count on that. My recommendation would be to save the email that Zoom sends you right after you register and put it somewhere safe so you don't have to rely on Zoom sending you the reminder.
 Diamond Mine Information:
I forgot to hit record on 11/13, so here is last week's (11/6/2020) recording link. Access Passcode: #g8G^J&3
Register in advance for the next "DecisionPoint Diamond Mine" trading room on Friday (11/20/2020) 12:00p ET:
Here is the registration link for Friday, 11/20/2020. Password: resource
Please do not share these links! They are for Diamonds subscribers ONLY!
A few items about the spreadsheet: I decided it only fair to denote "reader requests" as I shouldn't get to take credit if they turn out great! I've put on the spreadsheet whether the RSI is positive (green) or negative (red). The PMO column tells you if it is rising (green) or falling (red). Finally I've added my own "Sparkle Factor" that gives you my assessment going forward, bullish (green), bearish (red) or neutral (gray). The Sparkle Factor is basically my thoughts on whether I expect it to rise or fall. A neutral means it could really go either way so it could be added to a watch list. If you're in a stock I consider "neutral" going forward, the ball is in your court.

It's FREE!
***Click here to register for this recurring free DecisionPoint Trading Room!***
Did you miss the 10/26 (no meeting on 11/2) trading room? Here's a link to the recording (Passcode: X+2gJfpd)
For best results, copy and paste the password to avoid typos.
DARLING:
Bloom Energy Corp. (BE)
EARNINGS: 2/3/2021 (AMC)
Bloom Energy Corp. engages in the manufacture and installation of on-site distributed power generators. Its product, Bloom Energy Server, converts standard low-pressure natural gas or biogas into electricity through an electrochemical process without combustion. The company was founded by K. R. Sridhar, John Finn, Jim McElroy, Matthias Gottmann, and Dien Nguyen on January 18, 2001 and is headquartered in San Jose, CA.
Below is the write-up and chart on this one from Tuesday:
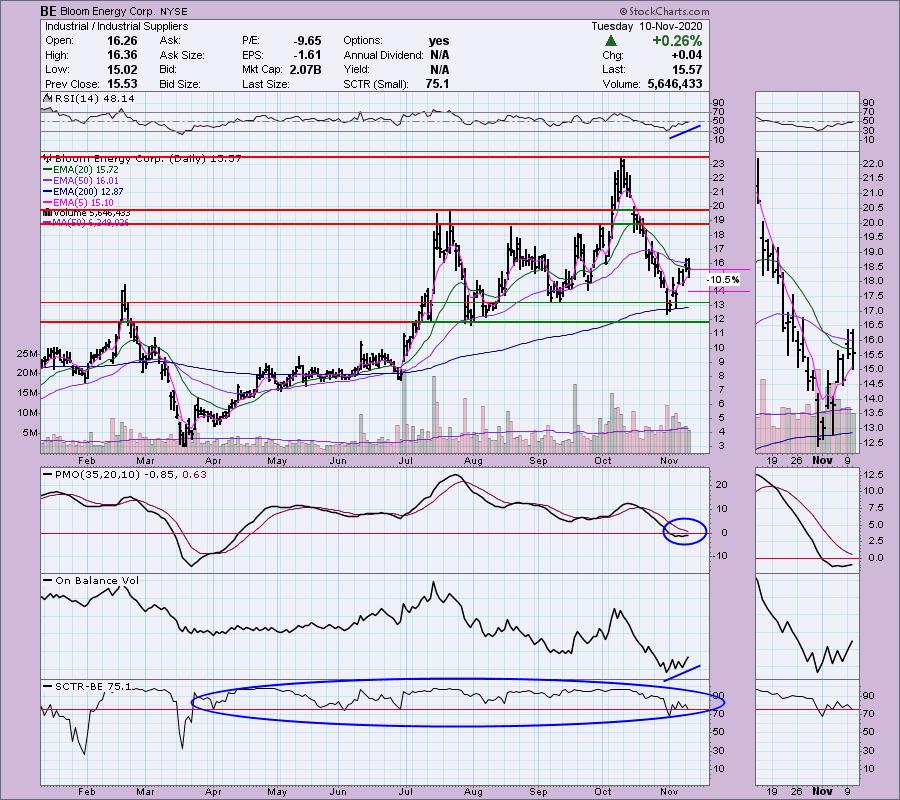
"Up +1.48% in after hours trading, BE has a nice "V" bottom pattern. These will "execute" when the right side of the "V" moves 1/3 of the way up toward the top of the left side of the "V". We are slightly early on this one, but it won't be long should it continue to rally higher. The RSI has just about turned positive and the PMO is trying to curve upward as it is flat right now. The OBV is confirming the current rally with rising bottoms. The stop is a little tricky here. In order to prevent a deep stop, I decided to go with the $14 level that matches the second bottom in September."
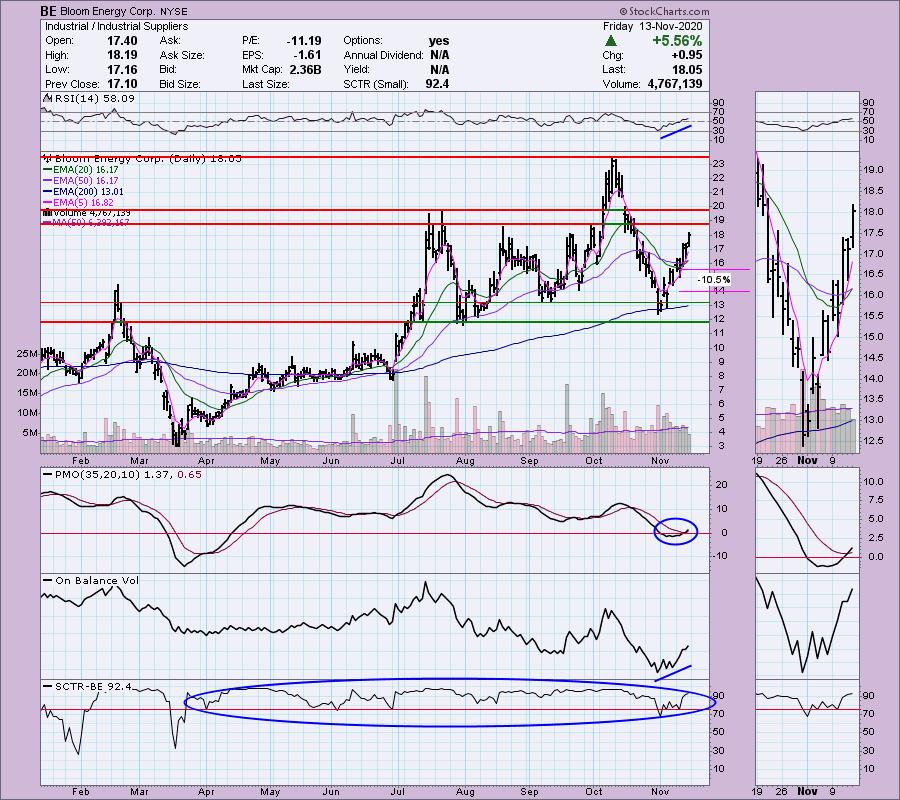
Let's look at the same chart updated for today. As you'll see all of the original components that made this a great pick on Tuesday is preserving as a great pick. It is getting close to overhead resistance, where we could see a pullback to digest this rally. Notice the new "silver cross" of the 20/50-EMAs which triggered an IT Trend Model BUY signal. This one should challenge the October top. This one I am stalking for a good entry.
Don't forget, on Thursdays I look at reader-requested symbols, so shoot me an email at erin@decisionpoint.com. I read every email I receive and try to answer them all!
Dud:
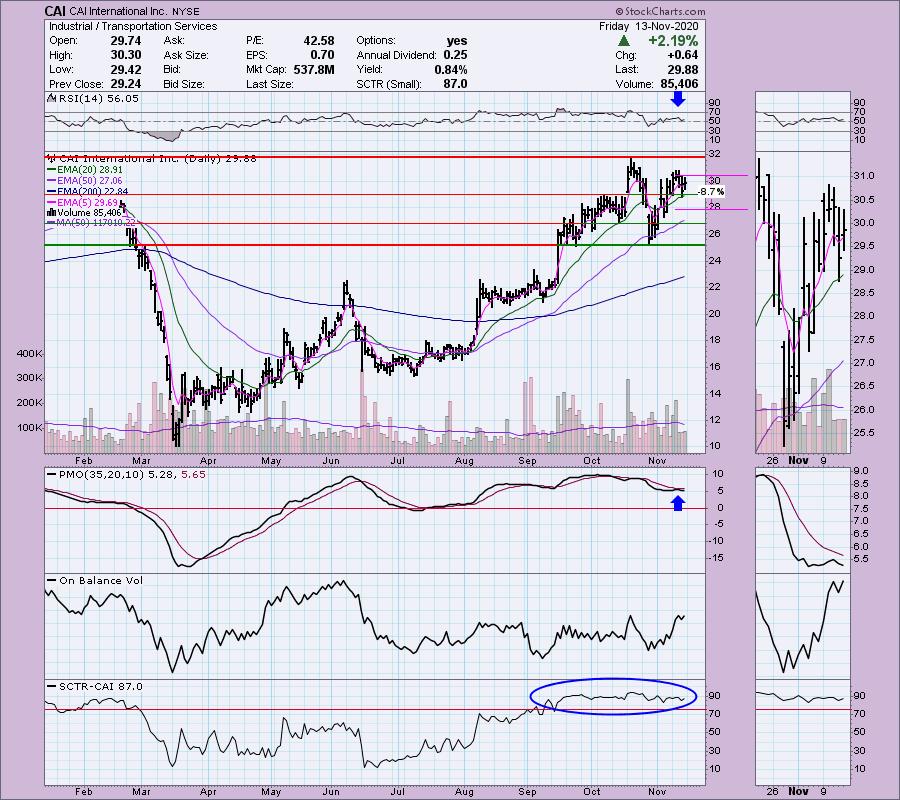
CAI International Inc. (CAI)
EARNINGS: 3/4/2021 (AMC)
CAI International, Inc. is a transportation finance and logistics company, which engages in the provision of intermodal shipping containers. It operates through the following segments: Container Leasing and Logistics. The Container Leasing segment focuses in the ownership and leasing of containers and fees earned for managing container portfolios on behalf of third-party investors. The Logistics segment provides logistics services. The company was founded by Hiromitsu Ogawa on August 3, 1989 and is headquartered in San Francisco, CA.
Below is the write-up and chart from Wednesday:
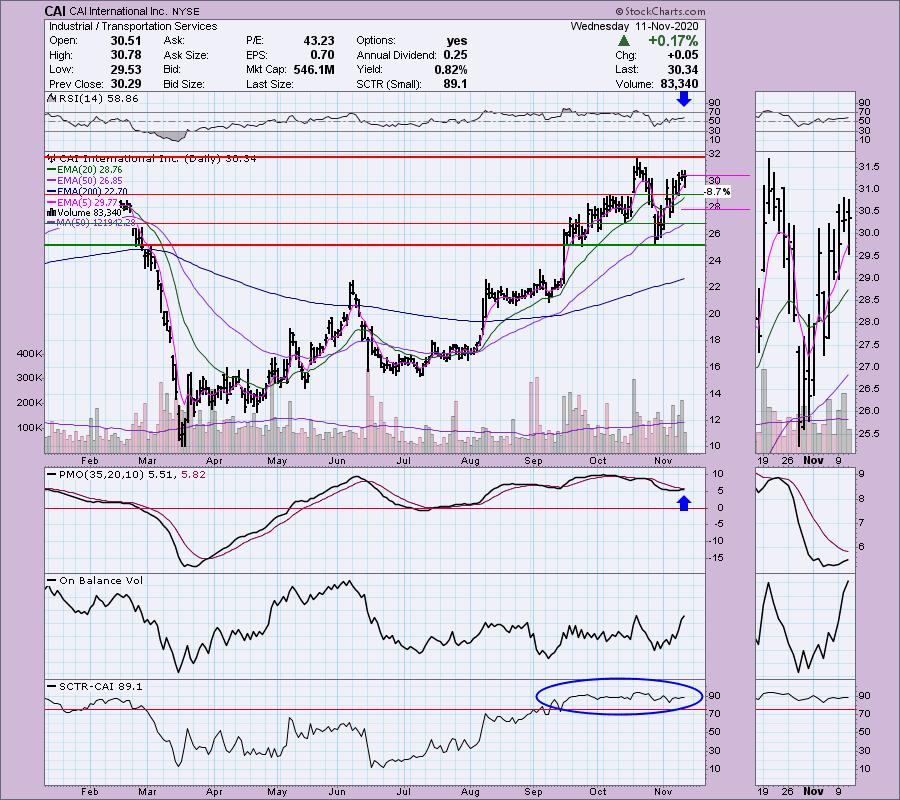
"CAI is set up with a positive RSI that is not overbought. The PMO is rising toward a crossover BUY signal. The SCTR is in the "hot zone" which shows CAI is in the top 11% of all small-caps. The stop was difficult to figure out on this one as picking either support level wasn't the right amount. If we go below $27 it is a 12%+ stop, but it's only 3.5% to the closest support level. I chose the stop to be halfway between those two levels."
Looking at the current chart, you can see that while the RSI is positive, the PMO has turned down below its signal line. It appears we may have an Adam and Eve Double-Top forming. The 20-EMA is holding but with momentum shifting downward, I would look for a test of the 50-EMA. Definitely a dud.
THIS WEEK's Sector Performance:
CONCLUSION:
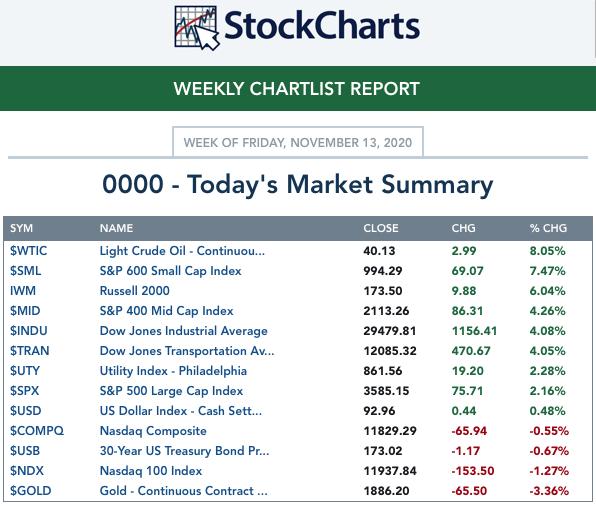
I still like the Industrials Sector and the Materials Sector, but I noticed on the sector charts that Consumer Staples (XLP) just broke out to new all-time highs. That will be my sector to keep an eye on next week.
Sector to Watch: Consumer Staples (XLP)
Industry Group to Watch: Distillers and Vintners ($DJUSVN)
Go to our Sector ChartList on DecisionPoint.com to get an in depth view of all the sectors.
Have a Great Weekend! Happy Charting!
- Erin
erin@decisionpoint.com
Full Disclosure: I'm about 45% invested right now and 55% is in 'cash', meaning in money markets and readily available to trade with.
Technical Analysis is a windsock, not a crystal ball.
Watch the latest episode of DecisionPoint with Carl & Erin Swenlin on Mondays 7:00p EST or on the DecisionPoint playlist on the StockCharts TV YouTube channel here!
NOTE: The stocks reported herein are from mechanical trading model scans that are based upon moving average relationships, momentum and volume. DecisionPoint analysis is then applied to get five selections from the scans. The selections given should prompt readers to do a chart review using their own analysis process. This letter is not a call for a specific action to buy, sell or short any of the stocks provided. There are NO sure things or guaranteed returns on the daily selection of "diamonds in the rough."
Helpful DecisionPoint Links:
DecisionPoint Shared ChartList and DecisionPoint Chart Gallery
Price Momentum Oscillator (PMO)
Swenlin Trading Oscillators (STO-B and STO-V)
For more links, go to DecisionPoint.com!