
It is definitely a mixed bag today for "diamonds in the rough". I found a few ETFs that look very interesting in areas that could surprise you. The Real Estate sector is still showing strength and that is where the "Diamond of the Week" is from.
Technology, particularly in the Software and Semiconductor industry groups are beginning to outperform. I am still suspect of those areas given the toppy look of the market. The Technology sector is the direction keeper of the overall market, so if we see a bearish bias in the market, we should rethink trades in that area. The market is overbought, but isn't showing a bearish bias yet. Keep your stops in play.
Today's "Diamonds in the Rough" are: EQIX, IIPR, IMTM, MANH and URNM.
** Everyone needs a vacation and I am no exception. I've planned a mini vacation to local wine country mid-week 3/23 through 3/25. The DecisionPoint Alert will be published, but I'll be taking the week off for Diamonds with the exception of the 3/26 Diamond Mine. I need to fit wine tasting in somehow! To compensate you for that week, I am adding a week to the end of all Diamond and Bundle subscribers' terms when I return, because who knows, I may end up writing a report or two. **
 Diamond Mine REGISTRATION Information:
When: Mar 19, 2021 09:00 AM Pacific Time (US and Canada)
Topic: DecisionPoint Diamond Mine (3/19/2021) LIVE Trading Room
Register in advance for this webinar HERE.
After registering, you will receive a confirmation email containing information about joining the webinar, including the password.
=======================================================================
Diamond Mine RECORDING Link from 3/12/2021:
Topic: DecisionPoint Diamond Mine (03/12/2021) LIVE Trading Room
Start Time : Mar 12, 2021 09:00 AM
Access Passcode: &hJ8Vv^P
***Click here to register for this recurring free DecisionPoint Trading Room on Mondays at Noon ET!***
+++++++++++++++++++++++++++++++++++++++++++++++++++++++++++++++++++++++++++++++
Free DP Trading Room RECORDING LINK:
Topic: DecisionPoint Trading Room
Start Time : Mar 15, 2021 08:58 AM
Free DP Trading Room Recording Link.
Access Passcode: 0f$2Pf5z
For best results, copy and paste the access code to avoid typos.
Welcome to DecisionPoint Daily Diamonds, wherein I highlight five "diamonds in the rough." These are selected from the results of my DecisionPoint scans, which search for stocks that could benefit from the trend and condition of the market. Remember, these are not recommendations to buy or sell, but are the most interesting of the stocks that surfaced in my scans. My objective is to save you the work of the initial, tedious culling process, but you need to apply your own analysis to see if these stocks pique your interest as well. There are no guaranteed winners here!
Equinix, Inc. (EQIX)
EARNINGS: 5/5/2021 (AMC)
Equinix, Inc. engages in the provision of collocation space and develops data centre solutions. The firm offers secure key management, consulting, network virtualization, customer support, and managed services. It operates through the following geographical segments: Americas, Europe, Middle East & Africa and Asia-Pacific. The company was founded by Jay Steven Adelson and Albert M. Avery, IV on June 22, 1998 and is headquartered in Redwood City, CA.
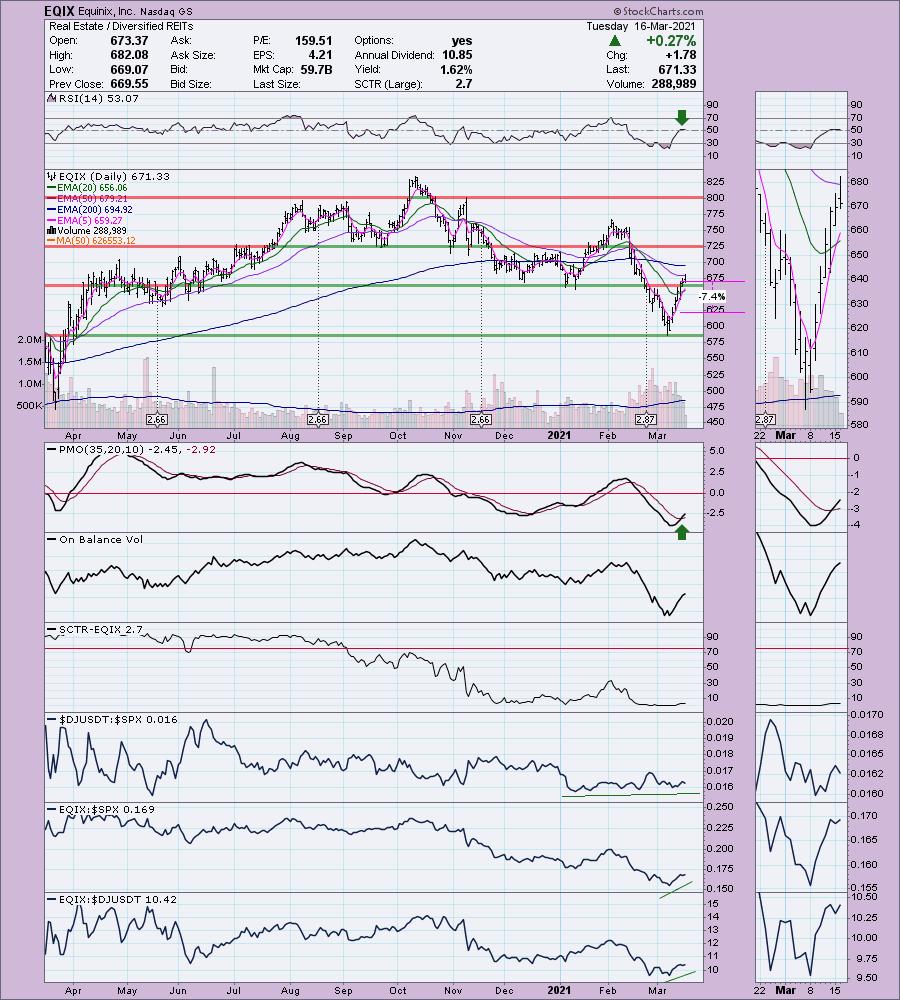
EQIX is unchanged in after hours trading. I opted to include this "Diamond of the Week" from the DecisionPoint Show yesterday as it still looks very promising. We have a "V" bottom that has retraced more than 1/3rd of the original decline. The pattern suggests a rally past the top of the left side of the "V". The PMO is on a BUY signal and today the 5-EMA crossed above the 20-EMA triggering a ST Trend Model BUY signal. The RSI has now entered positive territory above net neutral (50). Volume is coming in based on the OBV. The SCTR is terrible, but given the lengthy decline in February, it isn't surprising. We are seeing some outperformance. The stop is set below the February low.
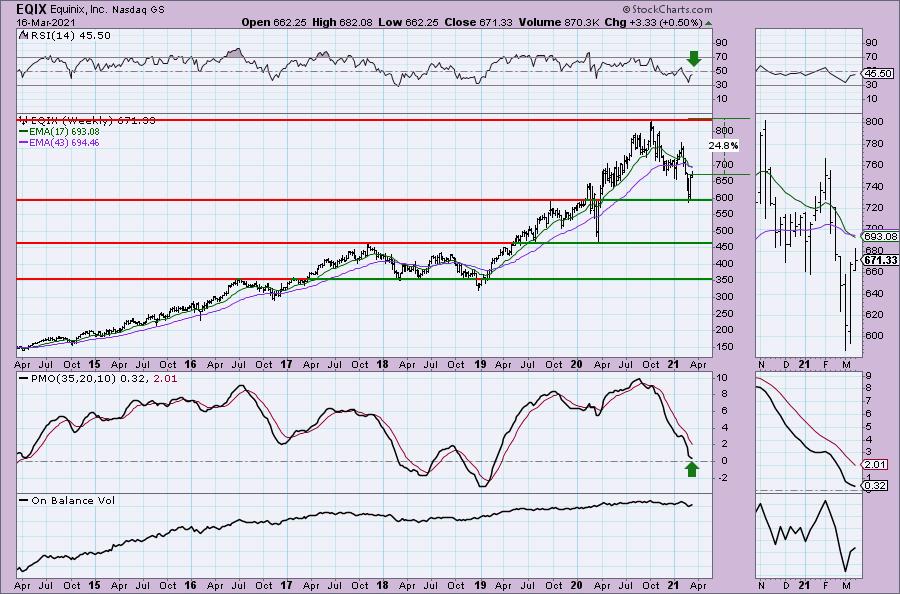
This stock is clearly "beat down", but it did find support on the 2019 high. The PMO has decelerated in oversold territory and looks ready to turn back up. The RSI is not positive yet and we do have a negative 17/43-week EMA crossover, so this one will need to be babysat.
Innovative Industrial Properties, Inc. (IIPR)
EARNINGS: 5/5/2021 (AMC)
Innovative Industrial Properties, Inc. is a real estate investment trust, which engages in the acquisition, ownership, and management of industrial properties. It operates through the following geographical segments: Arizona, California, Colorado, Florida, Illinois, Maryland, Massachusetts, Michigan, Minnesota, Nevada, New York, North Dakota, Ohio, and Pennsylvania. The firm's property portfolio include PharmaCann; Ascend Wellness Holdings, LLC; Vireo Health, Inc.; and Green Peak Industries, LLC. The company was founded by Alan D. Gold and Paul E. Smithers on June 15, 2016 and is headquartered in Park City, UT.
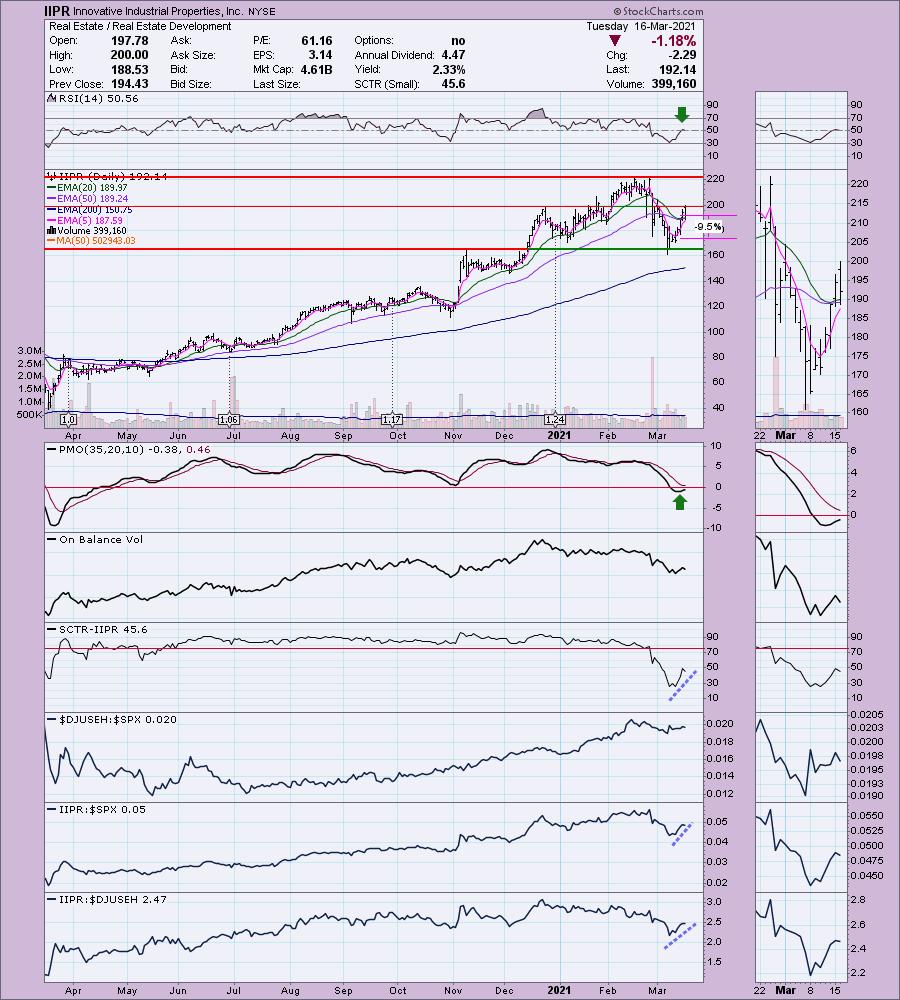
IIPR is up +1.13% in after hours trading so we may be onto something here. It has just reached overhead resistance at the December high, but given it is up in after hours, I suspect that resistance level will be vaulted easily. The RSI has just hit positive territory and the PMO has turned up in oversold territory. This is another "V" bottom that suggests a breakout to new all-time highs. It is performing very well. Price is staying above the 20/50-EMAs which avoided a negative crossover last week. The stop was a bit tricky. Going all the way down to support was too deep for me so I tried to line it up with the January low.
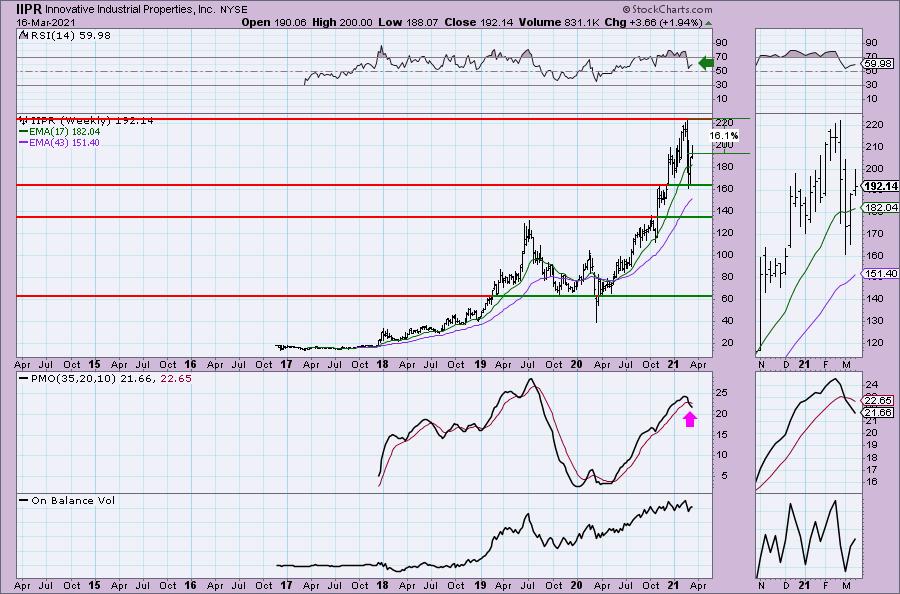
I don't like the weekly PMO, but it could be decelerating somewhat. The RSI is positive. Upside potential is 16%+.
iShares MSCI Int'l Developed Momentum Factor ETF (IMTM)
EARNINGS: N/A
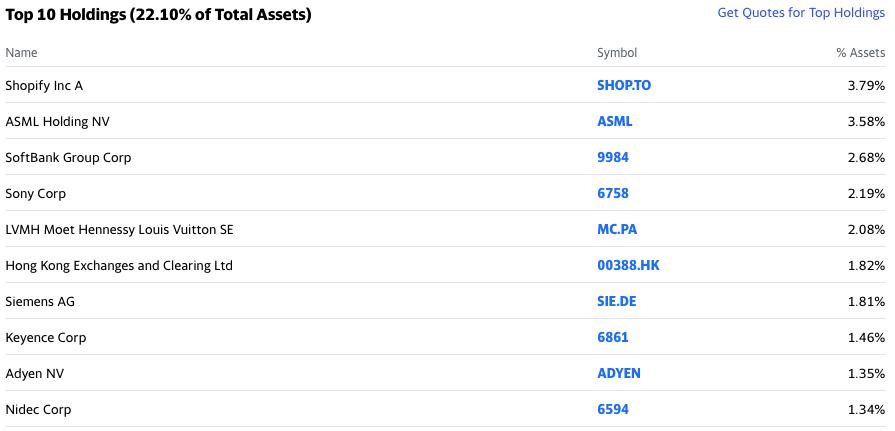
IMTM tracks an index of large- and midcap stocks from developed countries, ex-US. The momentum-selected stocks are weighted by market cap and momentum.
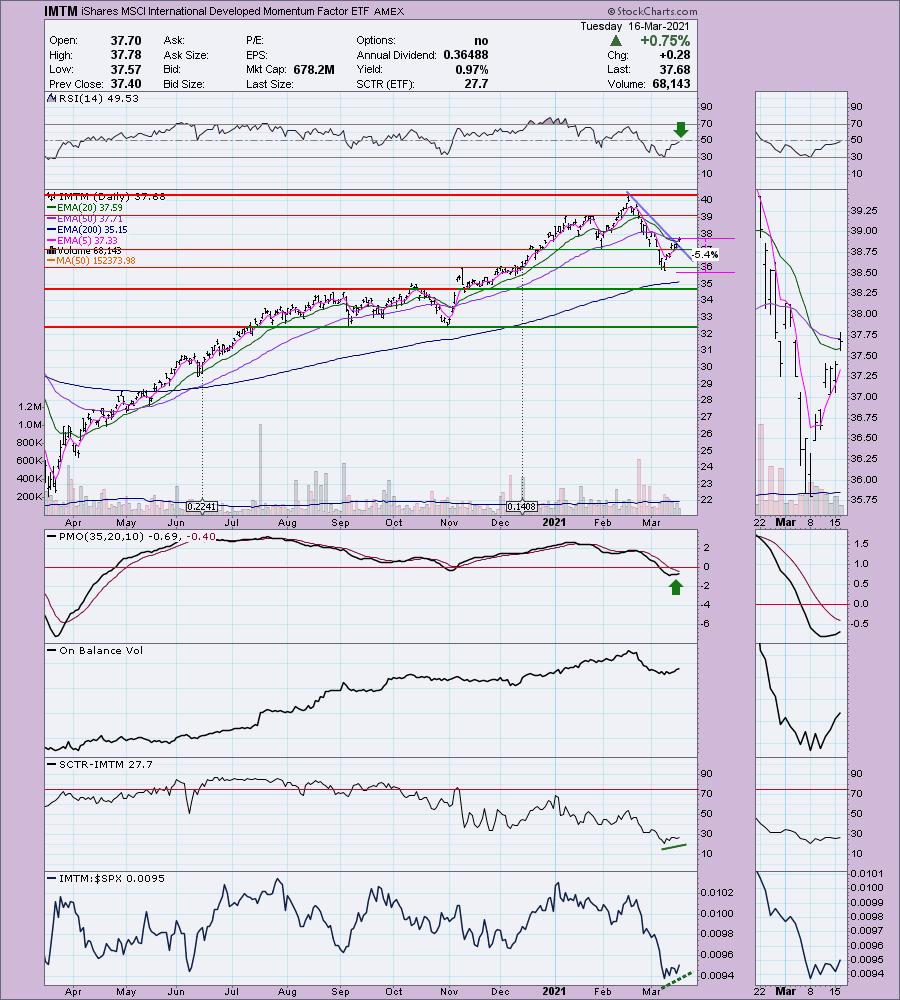
IMTM is currently down -0.48% in after hours trading. Today was a breakout day for this ETF. It broke the declining trend and closed above the 20-EMA. The PMO is rising steadily toward a crossover BUY signal. The RSI has nearly hit positive territory above net neutral (50). The ETF has been performing about as well as the SPX which is acceptable. I would like to see the SCTR pick up more.
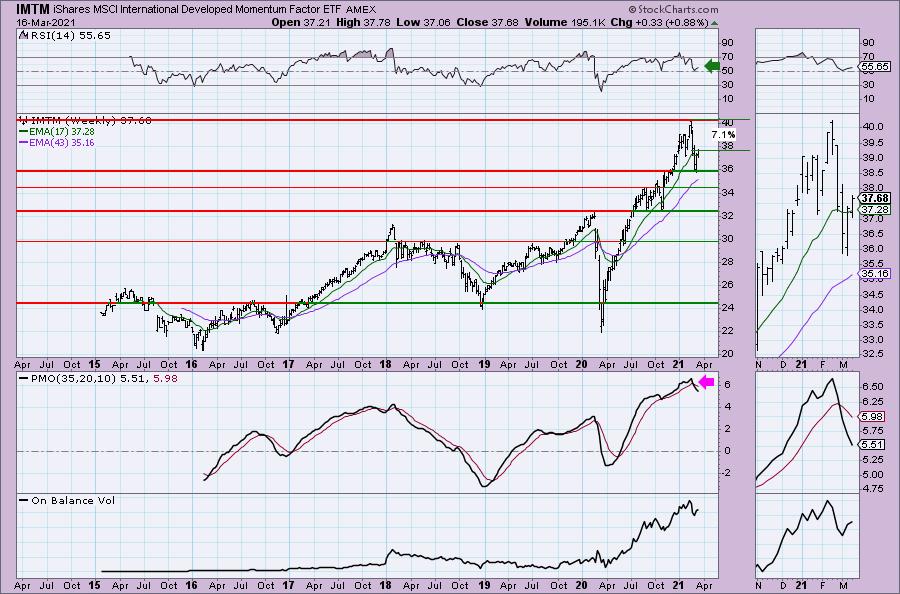
The weekly PMO is on a SELL signal so watch this one closely if you enter. The weekly PMO is positive and the bounce off support looks good. Upside potential is modest, but it should breakout from there.
Don't forget, on Thursdays I look at reader-requested symbols, so shoot me an email at erin@decisionpoint.com. I read every email I receive and try to answer them all!
Manhattan Associates, Inc. (MANH)
EARNINGS: 4/20/2021 (AMC)
Manhattan Associates, Inc. engages in designing, building and delivering supply chain commerce solutions by converging front-end sales with back-end supply chain. It operates through the following geographical segments: The Americas, Europe, Middle East and Africa and Asia Pacific. The company was founded by Deepak Raghavan in October 1990 and is headquartered in Atlanta, GA.
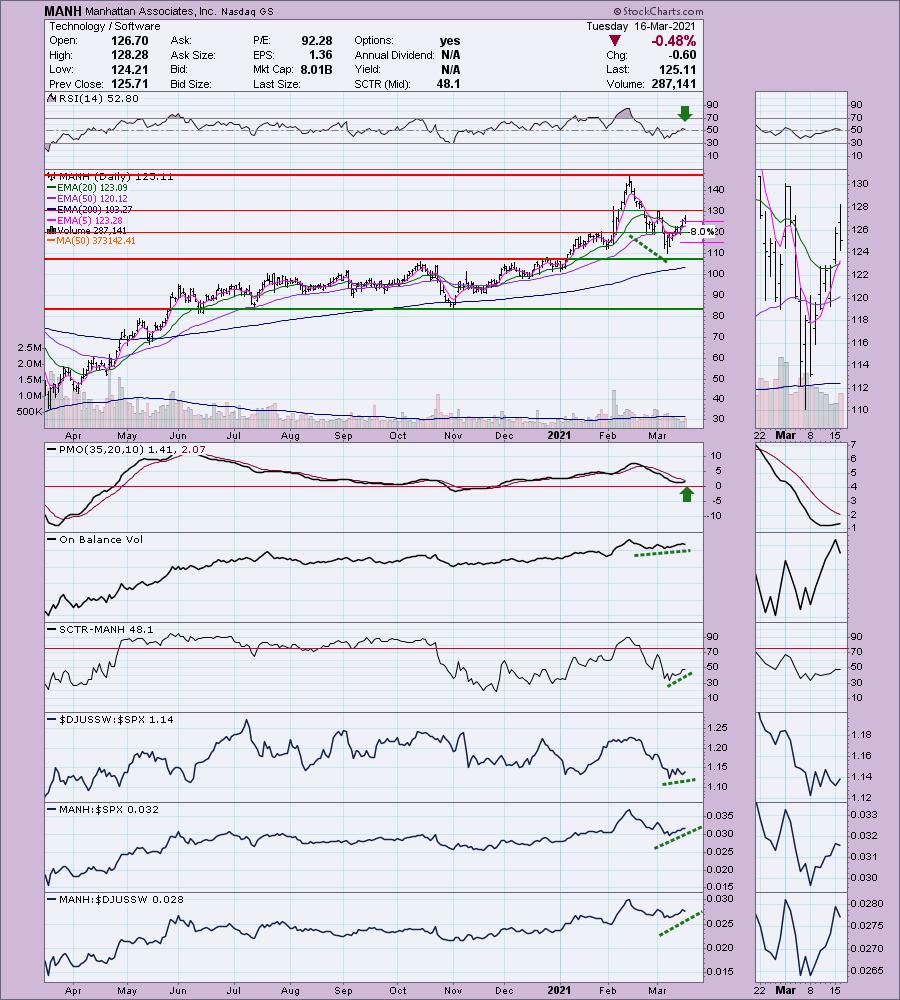
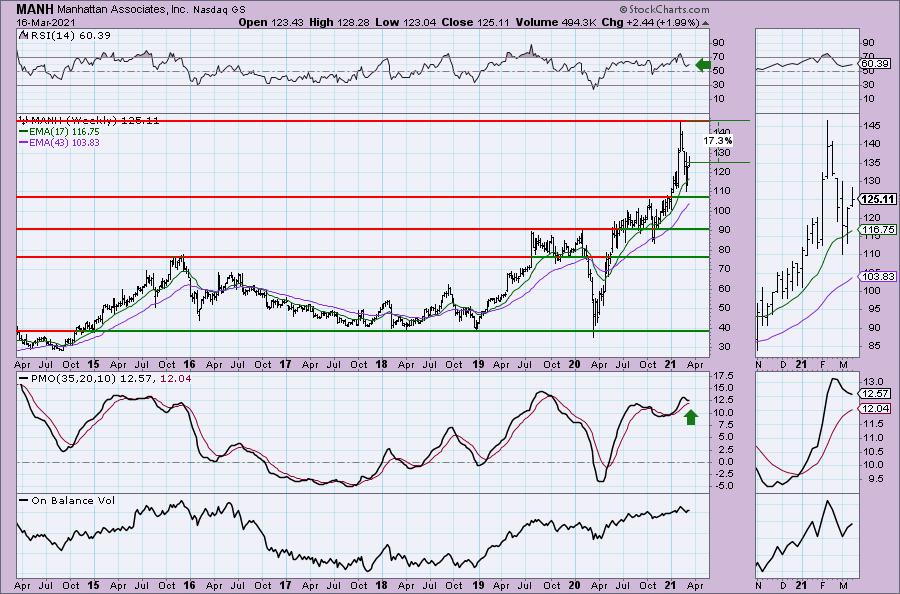
MANH is down -0.64% in after hours trading so a better entry is available. I hesitated to include a Software stock, but based on the indicators, this one should continue to rally. Today the 5-EMA crossed above the 20-EMA for a ST Trend Model BUY signal. The PMO is turning up and the RSI is positive. The positive OBV divergence looks great and suggests a breakout rally to follow. It is outperforming both the SPX and its group currently. The stop was set at my 8% threshold. I didn't see a particular support area except the March low and that was too deep for my taste.
The weekly chart is interesting given the PMO is beginning to turn back up while above its signal line. That is usually a very bullish sign, but it isn't quite there yet. The weekly RSI is positive and rising. Upside potential is good and definitely doable.
North Shore Global Uranium Mining ETF (URNM)
EARNINGS: N/A
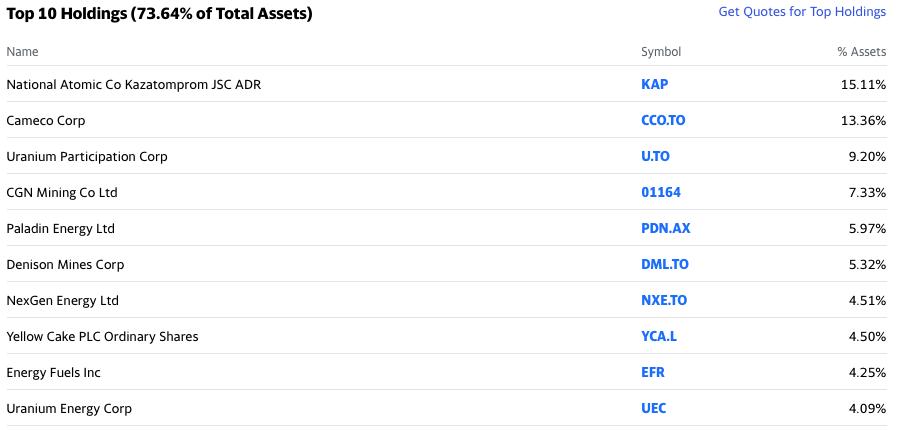
URNM tracks a market-cap-weighted index of global companies in the uranium industry.
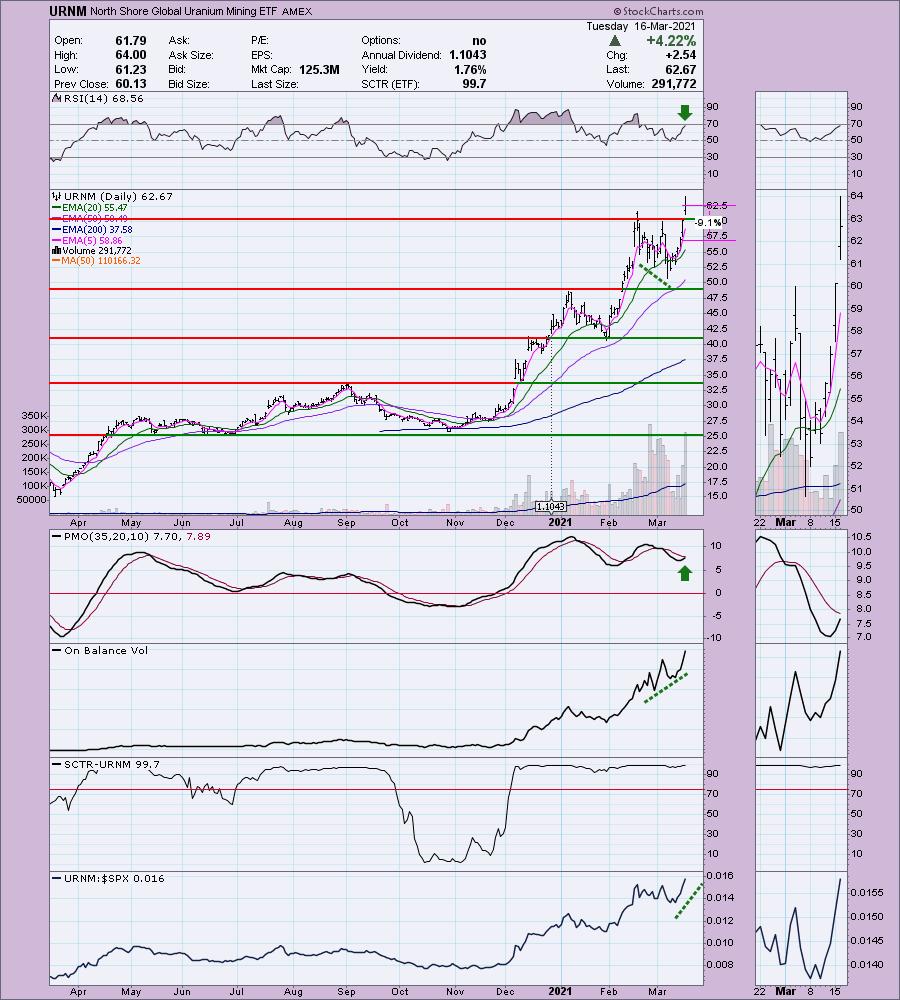
URNM is up +1.63% in after hours trading even after today 4%+ rally. It is on the overbought side given the RSI is near 70. However, the PMO is nearing a crossover BUY signal and we have a beautiful positive OBV divergence that led into this rally. I hesitated to include this one as it currently is a "runner", but set a stop on it, maybe even a trailing stop if the rally continues to be vertical. The stop is lined up where I would expect the 20-EMA to be if it loses support at $60.50. The SCTR rank is very impressive at 99.7. This tells us that this ETF is better than 99.7% of the ETF "universe".
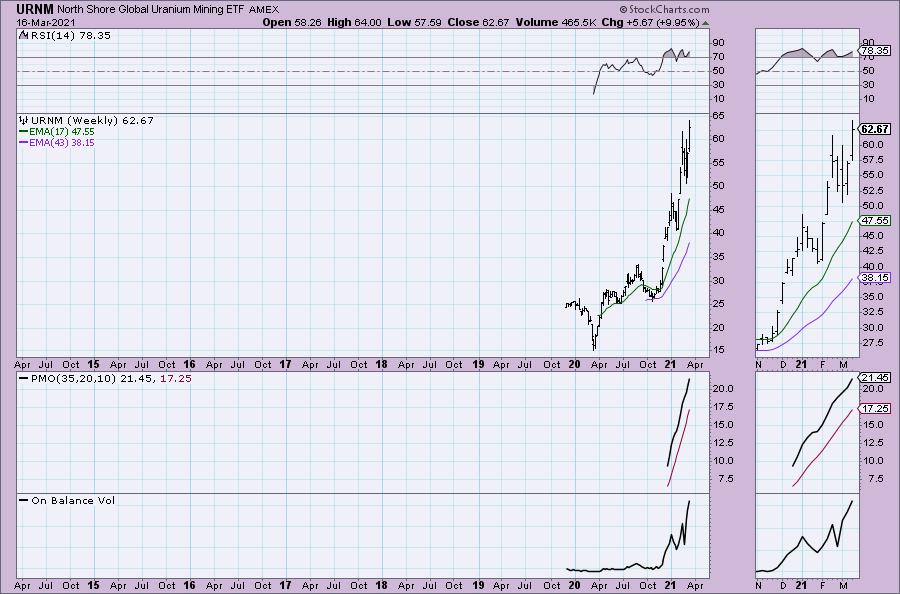
Hard to say much about the weekly chart as this ETF is too new.
Full Disclosure: I'm about 70% invested and 30% is in 'cash', meaning in money markets and readily available to trade with. Nothing new to report.
Current Market Outlook:
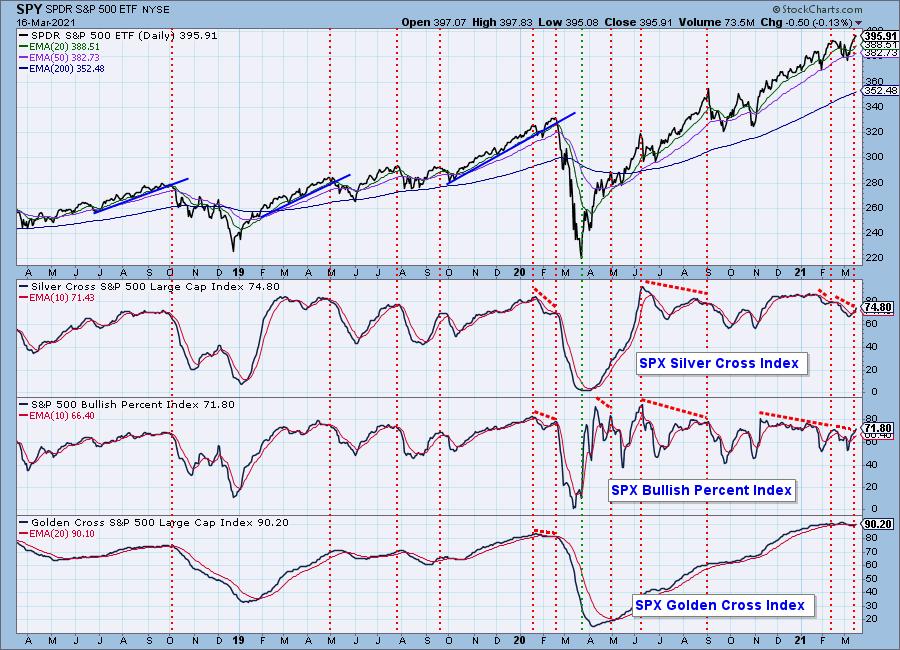
Market Environment: It is important to consider the odds for success by assessing the market tides. The following chart uses different methodologies for objectively showing the depth and trend of participation for intermediate- and long-term time frames.
- The Silver Cross Index (SCI) shows the percentage of SPX stocks on IT Trend Model BUY signals (20-EMA > 50-EMA)
- The Golden Cross Index (GCI) shows the percentage of SPX stocks on LT Trend Model BUY signals (50-EMA > 200-EMA)
- The Bullish Percent Index (BPI) shows the percentage of SPX stocks on Point & Figure BUY signals.
Don't forget that as a "Diamonds" member, you have access to our GCI/SCI curated ChartList on DecisionPoint.com. You'll find it under "Members Only" links on the left side on the Blogs and Links Page.
Here is the current chart:
Diamond Index:
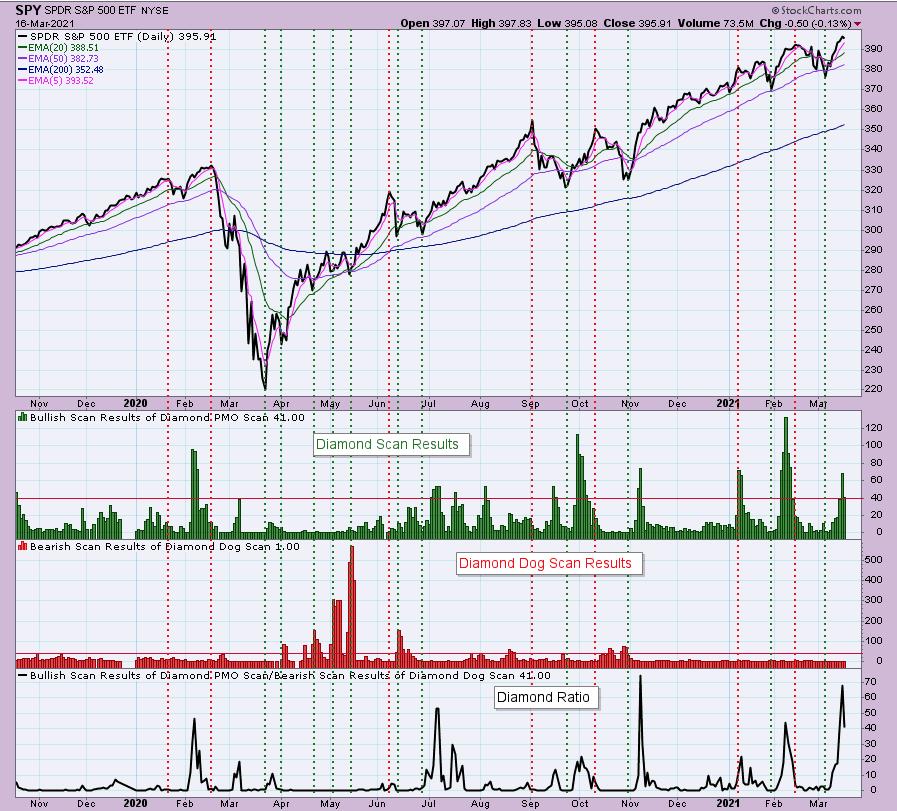
The Diamond Index chart looks at the number of scan results from my bullish Diamond PMO Scan and the number of scan results from the inverse Diamond Dog Scan. The Diamond Ratio divides the bullish results by the bearish results.
I only have data going back to October 2019 so I won't make any sweeping conclusions about the Diamond Index chart. I have marked cardinal tops with red dotted vertical lines and cardinal price bottoms with green dotted vertical lines. I believe that when the Diamond Dog results spike, it usually comes at a price bottom, or marks a strong continuation of the rising trend.
Unfortunately, the Diamond PMO Scan result numbers aren't providing much insight. The Diamond Ratio has promise, but again I don't see a clear correlation to the market tops/bottoms right now. I need to study and manipulate the data some more. Keep you posted!
Technical Analysis is a windsock, not a crystal ball.
Happy Charting!
- Erin
erin@decisionpoint.com
Watch the latest episode of DecisionPoint with Carl & Erin Swenlin on Mondays 7:00p EST or on the DecisionPoint playlist on the StockCharts TV YouTube channel here!
NOTE: The stocks reported herein are from mechanical trading model scans that are based upon moving average relationships, momentum and volume. DecisionPoint analysis is then applied to get five selections from the scans. The selections given should prompt readers to do a chart review using their own analysis process. This letter is not a call for a specific action to buy, sell or short any of the stocks provided. There are NO sure things or guaranteed returns on the daily selection of "diamonds in the rough."
Helpful DecisionPoint Links:
DecisionPoint Shared ChartList and DecisionPoint Chart Gallery
Price Momentum Oscillator (PMO)
Swenlin Trading Oscillators (STO-B and STO-V)
For more links, go to DecisionPoint.com!
