
Thank you all for your patience as I took off Diamonds last week. It was a great mid-week retreat to wine country. We tasted some amazing reds and joined a couple of wine clubs. We also purchased champagne to celebrate my parent's 60th wedding anniversary! I will be adjusting your accounts on April 1st to add a free week to compensate you for that time off.
My selections for today are mostly Industrials, but I threw an international ETF in there that might interest you as well.
Concrete and Steel rallied strongly today, I'm going to stalk a few for tomorrow's Diamonds Report. I'm expecting a pullback tomorrow. Of course, you are welcome to do further research if you don't want to wait.
Solar is finally rebounding again. I didn't include any today, but that is an area you may want to research as well.
Today's "Diamonds in the Rough" are: DDS, SI, SIEGY, SWK and UTHR.
 Diamond Mine REGISTRATION Information:
When: Apr 2, 2021 09:00 AM Pacific Time (US and Canada)
Topic: DecisionPoint Diamond Mine (04/02/2021) LIVE Trading Room
Register in advance for this webinar HERE.
After registering, you will receive a confirmation email containing information about joining the webinar, including the password.
=======================================================================
Diamond Mine RECORDING Link from 3/26/2021:
Topic: DecisionPoint Diamond Mine (03/26/2021) LIVE Trading Room
Start Time : Mar 26, 2021 08:58 AM
Meeting Recording HERE.
Access Passcode: i$6DFL+U
***Click here to register for this recurring free DecisionPoint Trading Room on Mondays at Noon ET!***
+++++++++++++++++++++++++++++++++++++++++++++++++++++++++++++++++++++++++++++++
Free DP Trading Room RECORDING LINK:
Topic: DecisionPoint Trading Room
Start Time : Mar 29, 2021 08:54 AM
DP Trading Room Meeting Recording HERE.
Access Passcode: f^mTv+1?
For best results, copy and paste the access code to avoid typos.
Welcome to DecisionPoint Daily Diamonds, wherein I highlight five "diamonds in the rough." These are selected from the results of my DecisionPoint scans, which search for stocks that could benefit from the trend and condition of the market. Remember, these are not recommendations to buy or sell, but are the most interesting of the stocks that surfaced in my scans. My objective is to save you the work of the initial, tedious culling process, but you need to apply your own analysis to see if these stocks pique your interest as well. There are no guaranteed winners here!
Alcoa Corp. (AA)
EARNINGS: 4/15/2021 (AMC)
Alcoa Corp. engages in the production of bauxite, alumina, and aluminum products. It operates through the following segments: Bauxite, Alumina, and Aluminum. The Bauxite segment represents the company' global bauxite mining operations. The Alumina segment includes the company's worldwide refining system, which processes bauxite into alumina. The Aluminum segment combines smelting and casting operations produce primary aluminum. The smelting operations produce molten primary aluminum, which is then formed by the casting operations into either foundry ingot or into value add ingot products, including billet, rod, and slab. The company was founded by Charles Martin Hall on July 9, 1886 and is headquartered in Pittsburgh, PA.
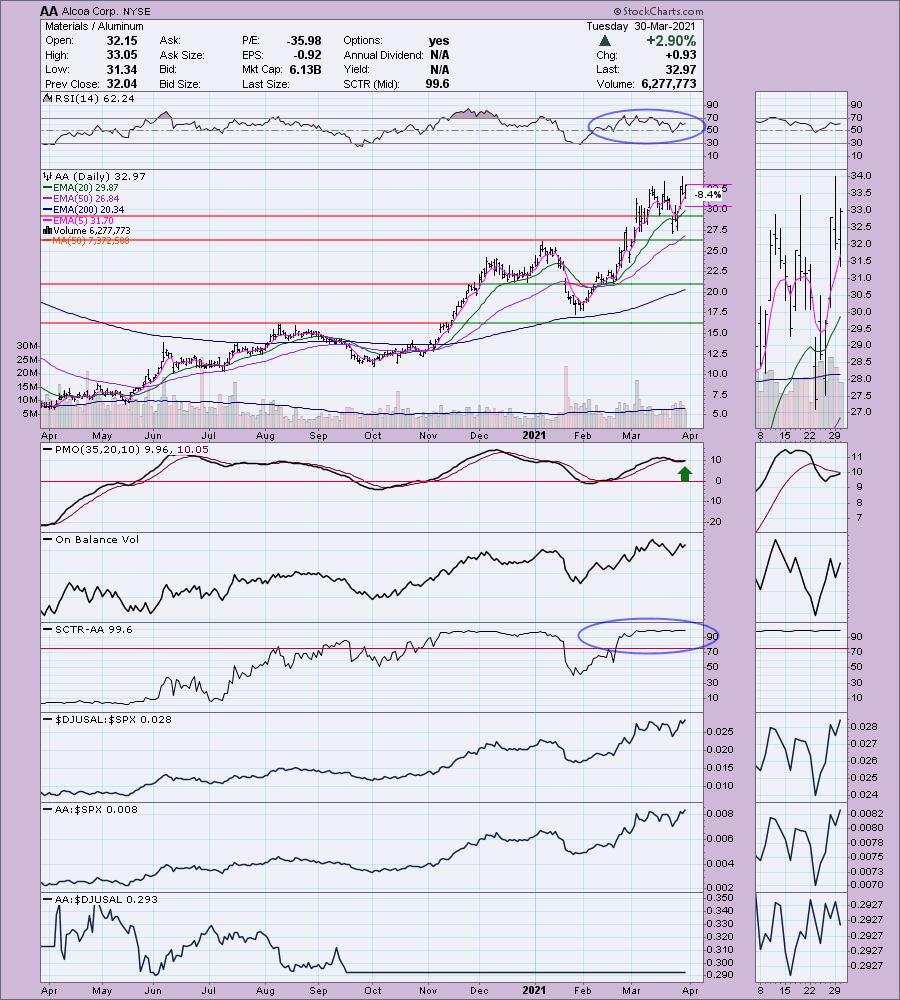
AA is up +1.49% in after hours trading. I mentioned that concrete and steel were rallying, aluminum is as well. The RSI has been very strong and the PMO is nearing a crossover BUY signal. The SCTR is top-notch. In the very near term (see thumbnail), AA and this industry group are beginning to outperform the market. Setting a stop is a bit tricky unless you are fine with an 11.5% which would line you up with short-term support. I prefer not to set them that deep so I decided to go with $30.50 area.
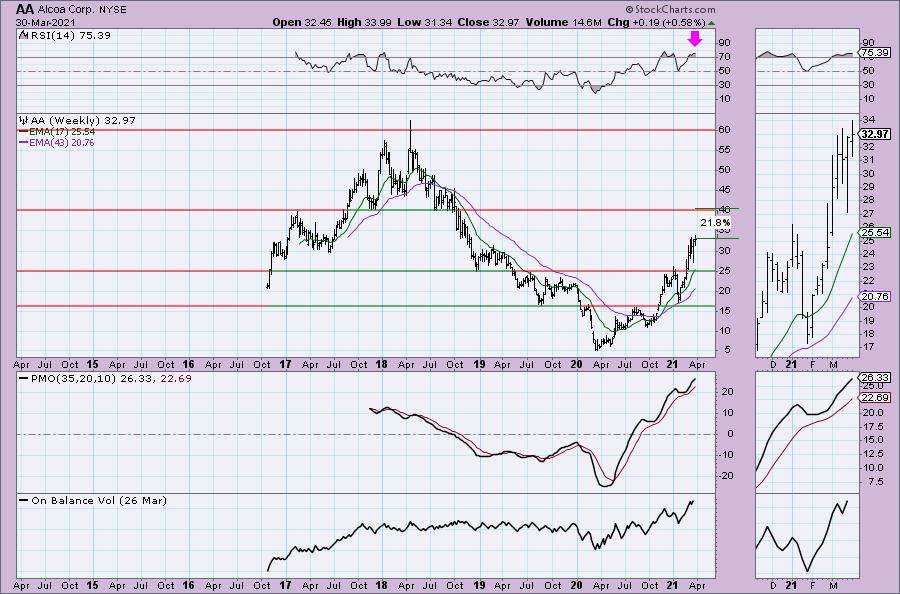
The only issue with the weekly chart is an overbought RSI, but as we know that can persist. I have conservatively set an upside target at $40, but this one could move much higher if that resistance level is successfully broken.
iShares MSCI South Korea Capped ETF (EWY)
EARNINGS: N/A
EWY tracks a market-cap-weighted index of large- and midcap Korean firms.
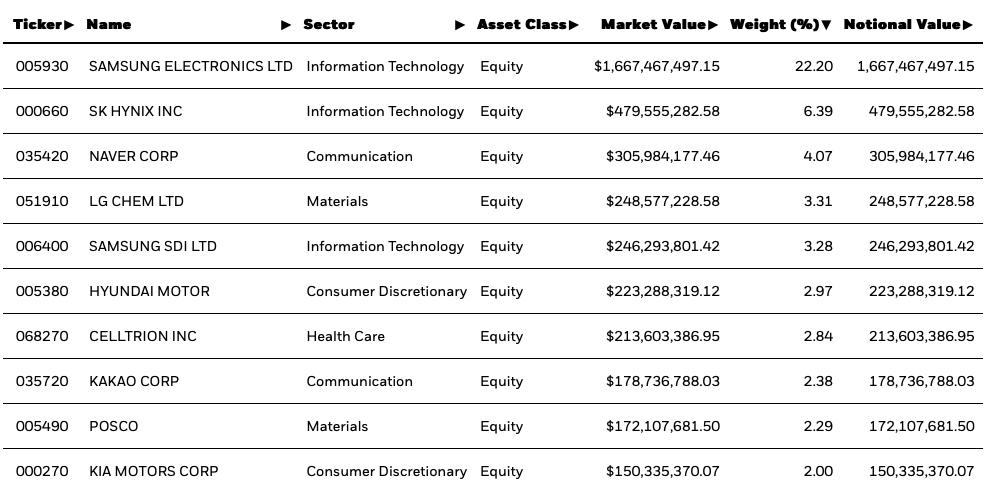
Top ten holdings from their website:
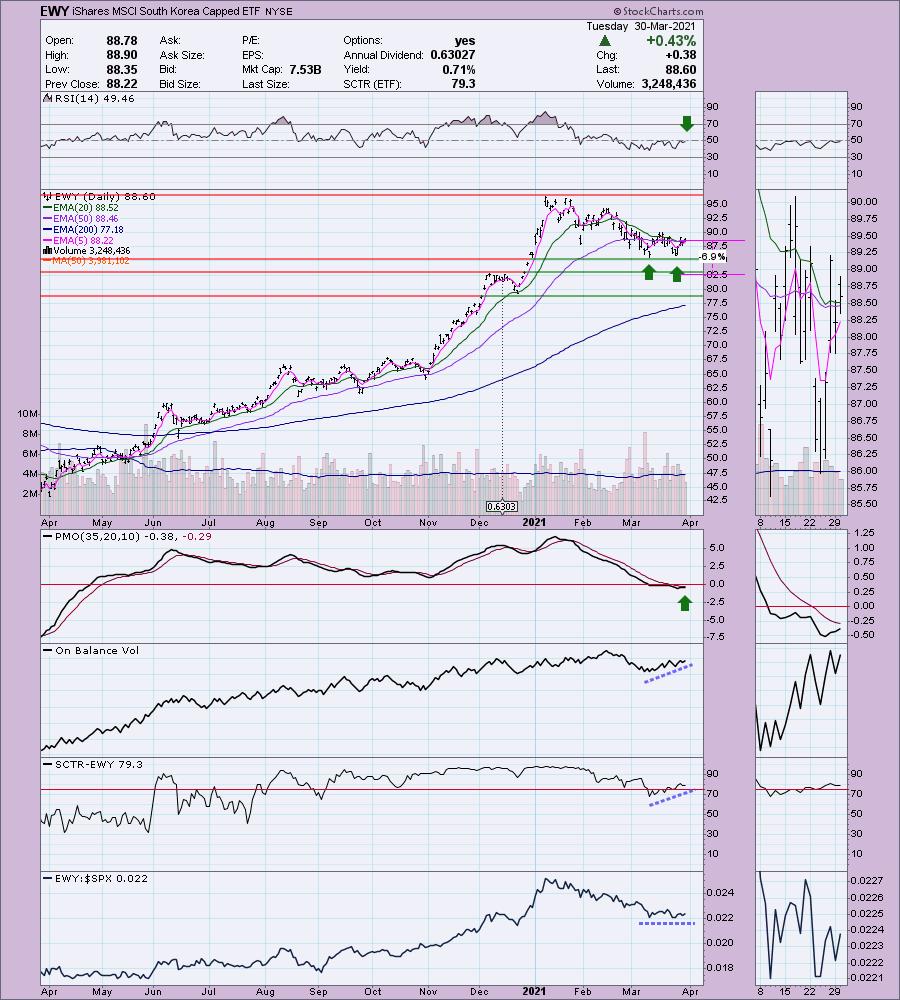
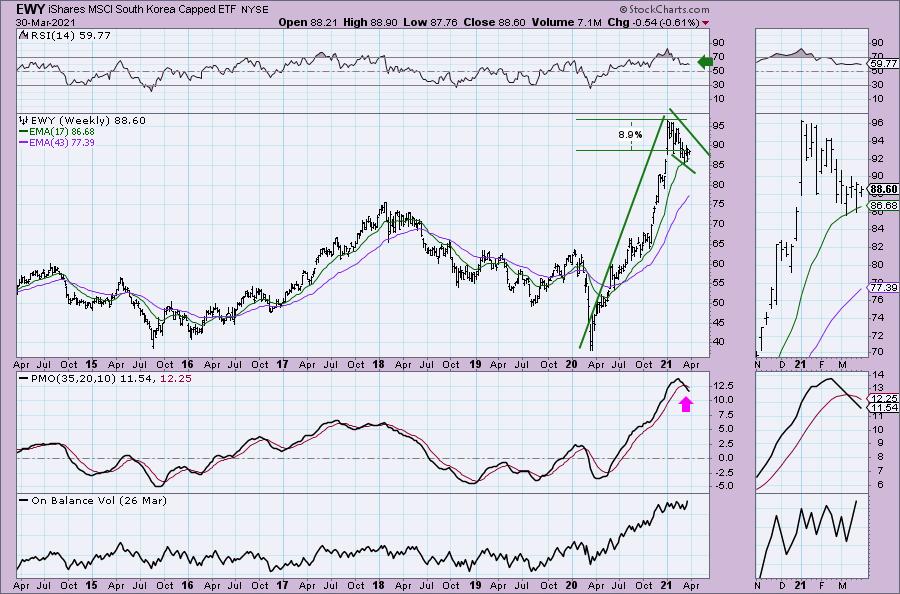
EWY is unchanged in after hours trading. I noticed before I left for vacation that international ETFs were beginning to outperform as a few had shown up in my scans. I liked this one best, but EWT (Taiwan) also was promising. We have a double-bottom formation developing. Remember it isn't a double-bottom until price crosses above the confirmation line (the middle of the "W"). The RSI isn't quite positive, but I like the PMO that is nearing a BUY signal. The OBV is definitely confirming this new rally. The SCTR is in the "hot zone" above 75. It hasn't been outperforming that much, but I do like that I can set a shallow stop around $82.50.
There is a flag formation on the weekly chart. The "flag" is a bullish falling wedge. The RSI is positive. Unfortunately, the PMO configuration isn't optimum. This tells you to follow it closely and stay true to whatever stop you set. I'm looking for a breakout above all-time highs which are about 9% away.
The ODP Corporation (ODP)
EARNINGS: 5/5/2021 (BMO)
The ODP Corp. operates as a holding company, which engages in the provision of business services, products, and digital workplace technology solutions. It offers tools and resources to its clients to start, grow, and run their business. It operates through the following brands: Office Depot, OfficeMax, CompuCom, and Grabnd&Toy. The company was founded on June 9, 2020 and is headquartered in Boca Raton, FL.
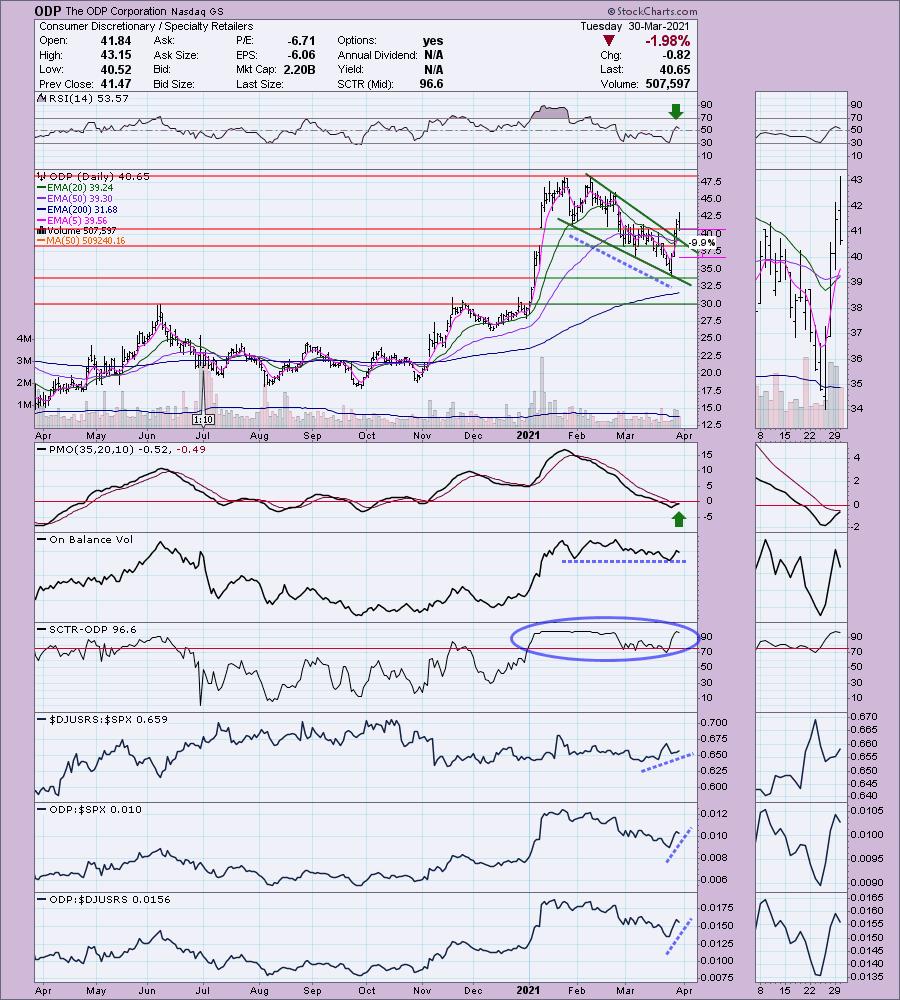
ODP is unchanged in after hours trading. I really like the breakout from the bullish falling wedge. The RSI is still positive and the PMO is nearing a crossover BUY signal despite a nearly 2% decline today. We have a brand new ST Trend Model BUY signal as the 5-EMA crossed above the 20-EMA. An IT Trend Model BUY signal or "silver cross" should occur tomorrow when the 20-EMA gets above the 50-EMA. The stop is a bit deep at 10%. Notice the strong SCTR as well as outperformance by ODP.
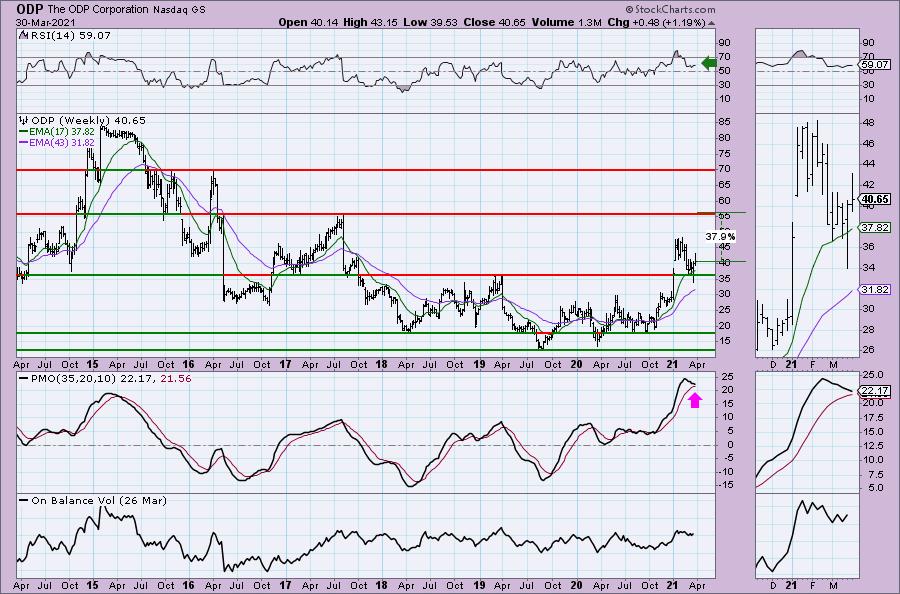
The weekly PMO is attempting to avoid an overbought PMO SELL signal. However, we have a positive RSI. Upside target is at the 2017 high.
Don't forget, on Thursdays I look at reader-requested symbols, so shoot me an email at erin@decisionpoint.com. I read every email I receive and try to answer them all!
Summit Materials Inc. (SUM)
EARNINGS: 4/28/2021 (AMC)
Summit Materials, Inc. is a construction materials company. It manufactures construction materials and related downstream products. The company operates its business through the following segments: Cement, West and East. The Cement consists of its Hannibal, Missouri and Davenport, Iowa cement plants and distribution terminals along the Mississippi river from Minnesota to Louisiana. The West segment includes operations in Texas, Utah, Colorado, Idaho, Wyoming and Nevada and in British Columbia, Canada. The East segments serves markets extending across the Midwestern and Eastern United States, most notably in Kansas, Missouri, Virginia, Kentucky, North Carolina, South Carolina and Nebraska where the company supplies aggregates, ready mix concrete, asphalt paving mix and paving and related services. The company was founded by Thomas W. Hill on September 23, 2014 and is headquartered in Denver, CO.
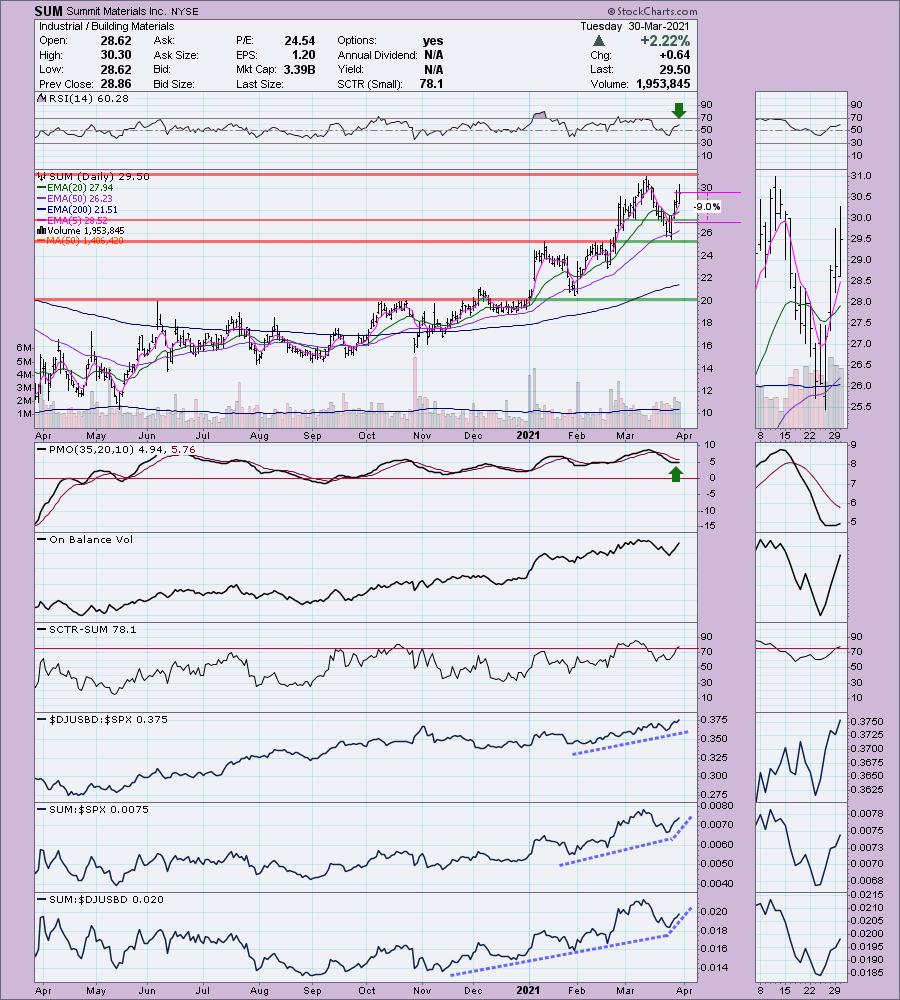
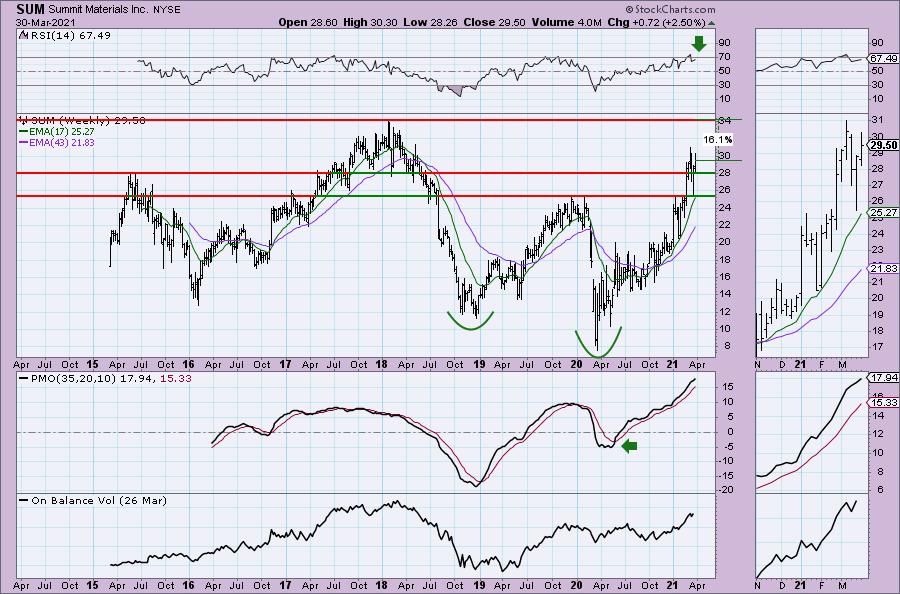
SUM is up +2.88% in after hours trading so investors are interested in keeping this rally going. The PMO has just turned up and the RSI is positive and not overbought. The SCTR is back in the "hot zone" above 75 and we are seeing an increase in outperformance by the group and SUM. The stop is set just below the early March low.
This one has a strong weekly chart. The RSI is positive and the weekly PMO is rising and on a BUY signal. What really intrigues me is the giant double-bottom formation that has executed. The minimum upside target would take price well-above its all-time; specifically it is conservatively around $38.
Vulcan Materials Co. (VMC)
EARNINGS: 5/5/2021 (BMO)
Vulcan Materials Co. engages in the provision of basic materials and supply for infrastructure and construction industry. It operates through the following business segments: Aggregates, Asphalt, Concrete, and Calcium. The Aggregates segment produces and sells asphalt mix and ready-mixed concrete primarily in its mid-Atlantic, Georgia, Southwestern, Tennessee, and Western markets. The Asphalt segment produces and sells asphalt mix in Arizona, California, New Mexico, Tennessee, and Texas. The Concrete segment produces and sells ready-mixed concrete in California, Georgia, Maryland, New Mexico, Texas, Virginia, Washington D.C., and the Bahamas. The Calcium segment produces calcium products for the animal feed, plastics, and water treatment industries with calcium carbonate material mined at the Brooksville quarry. The company was founded in 1909 and is headquartered in Birmingham, AL.
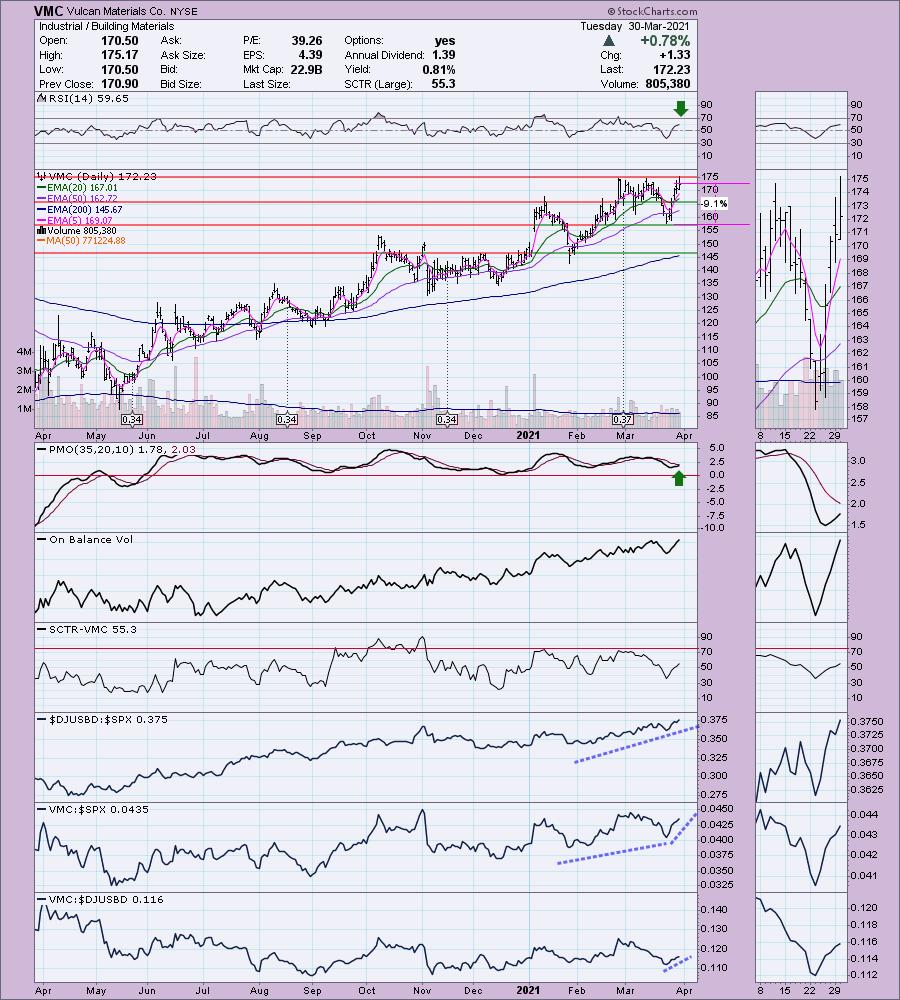
VMC is up +2.65% in after hours trading, so we may be on to something here with Building Materials. The RSI is positive and not overbought, the PMO is rising and nearing a near-term oversold BUY signal. It hasn't broken out, but given after hours action, I expect it to tomorrow. The stop is somewhat deep at 9.1%, but that lines us up with strong support.
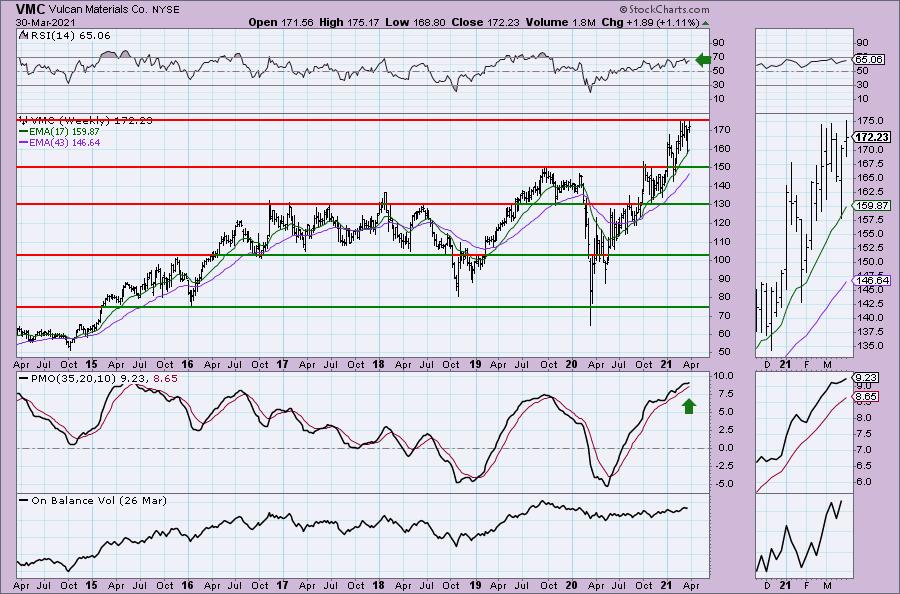
The weekly PMO was topping, but it is now accelerating higher (see thumbnail). The RSI is positive and not overbought. If I had to complain, it would be the negative divergence with the OBV tops. Price is at all-time highs, but the OBV hasn't gotten above its 2019 top.
Full Disclosure: I'm about 45% invested and 55% is in 'cash', meaning in money markets and readily available to trade with. A lot happened last week while I was gone as stops were hit. Ultimately, prior "diamonds in the rough" that I still have: IEO, RAD (didn't set a stop unfortunately, but its rebounding), SPWR, XME, BLBD, EAD, EXC, ODFL and RGEN. I of course have quite a few other positions, but this should keep it straight for you. I'm not going to be expanding my exposure yet, although Building Materials look very interesting.
While it is hard to keep a lot of positions straight, it has worked well for me as my exposure is very diversified and I never take a huge hit on a losing position. Food for thought.
Current Market Outlook:
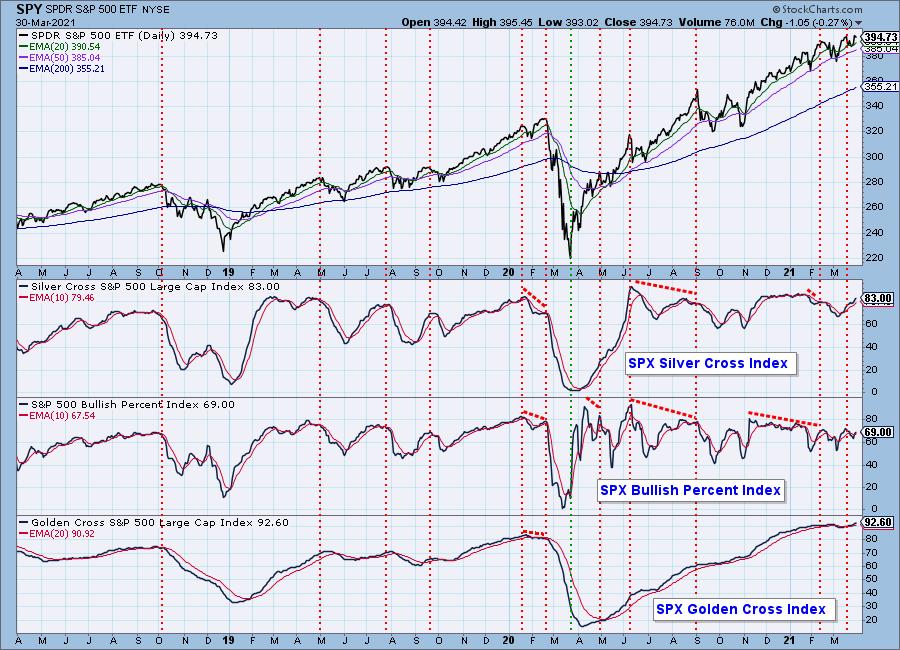
Market Environment: It is important to consider the odds for success by assessing the market tides. The following chart uses different methodologies for objectively showing the depth and trend of participation for intermediate- and long-term time frames.
- The Silver Cross Index (SCI) shows the percentage of SPX stocks on IT Trend Model BUY signals (20-EMA > 50-EMA)
- The Golden Cross Index (GCI) shows the percentage of SPX stocks on LT Trend Model BUY signals (50-EMA > 200-EMA)
- The Bullish Percent Index (BPI) shows the percentage of SPX stocks on Point & Figure BUY signals.
Don't forget that as a "Diamonds" member, you have access to our GCI/SCI curated ChartList on DecisionPoint.com. You'll find it under "Members Only" links on the left side on the Blogs and Links Page.
Here is the current chart:
Diamond Index:
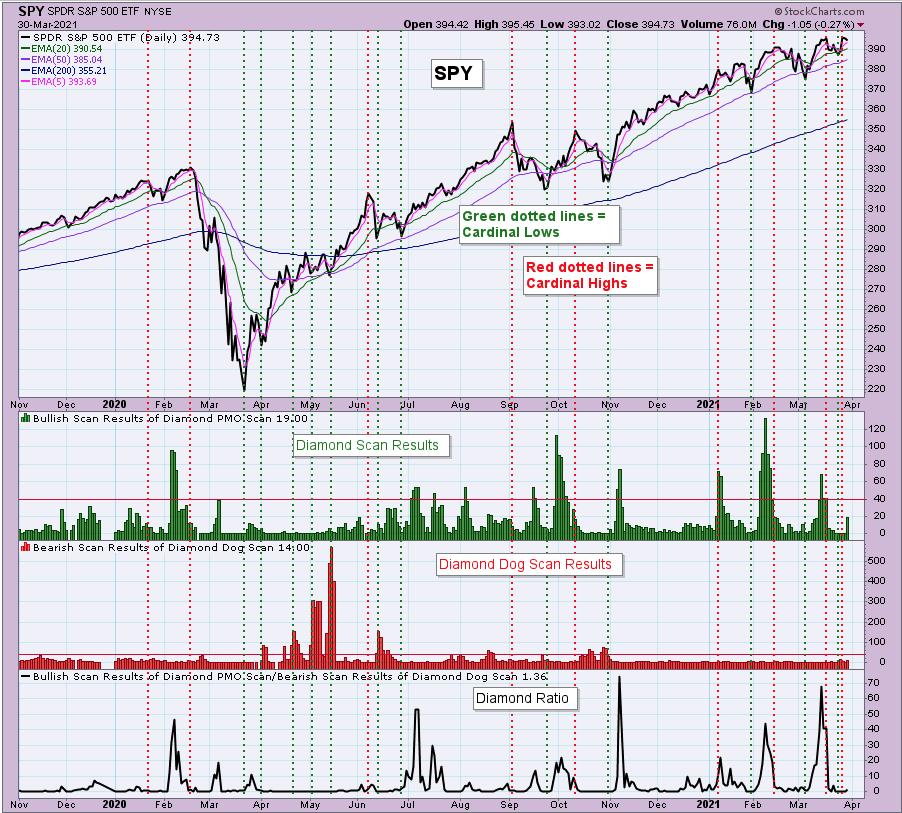
The Diamond Index chart looks at the number of scan results from my bullish Diamond PMO Scan and the number of scan results from the inverse Diamond Dog Scan. The Diamond Ratio divides the bullish results by the bearish results.
I only have data going back to October 2019 so I won't make any sweeping conclusions about the Diamond Index chart. I have marked cardinal tops with red dotted vertical lines and cardinal price bottoms with green dotted vertical lines. I believe that when the Diamond Dog results spike, it usually comes at a price bottom, or marks a strong continuation of the rising trend.
Unfortunately, the Diamond PMO Scan result numbers aren't providing much insight. The Diamond Ratio has promise, but again I don't see a clear correlation to the market tops/bottoms right now. I need to study and manipulate the data some more. Keep you posted!
Technical Analysis is a windsock, not a crystal ball.
Happy Charting!
- Erin
erin@decisionpoint.com
Watch the latest episode of DecisionPoint with Carl & Erin Swenlin on Mondays 7:00p EST or on the DecisionPoint playlist on the StockCharts TV YouTube channel here!
NOTE: The stocks reported herein are from mechanical trading model scans that are based upon moving average relationships, momentum and volume. DecisionPoint analysis is then applied to get five selections from the scans. The selections given should prompt readers to do a chart review using their own analysis process. This letter is not a call for a specific action to buy, sell or short any of the stocks provided. There are NO sure things or guaranteed returns on the daily selection of "diamonds in the rough."
Helpful DecisionPoint Links:
DecisionPoint Shared ChartList and DecisionPoint Chart Gallery
Price Momentum Oscillator (PMO)
Swenlin Trading Oscillators (STO-B and STO-V)
For more links, go to DecisionPoint.com!
