
Every now and then as I sift through my scan results, I come across a chart that MUST be presented. I found today's in a rather generalized scan that I call "Bullish EMAs - MidRange SCTR". As the scan name implies, I want to see the 20/50/200-EMAs configured with the 20-EMA > 50-EMA > 200-EMA. Additionally, I want stocks that are showing improving StockCharts Technical Ranks that are between 60 and 80.
I often find great candidates from that scan but unfortunately it usually returns well over 100 results. In any case, I found this gem, a "Diamond in the Rough" that is already beginning to sparkle. As with all of the "Diamonds in the Rough", there are no "sure things", but this chart looks very good.
Drum roll....it is Fossil Group (FOSL) from Discretionary-Clothing and Accessories.
The other two have very favorable charts (as do all of the "Diamonds in the Rough") and could easily be considered for your portfolio. I'll be watching 5-min candlestick charts in the morning.
Today's "Diamonds in the Rough" are: DY, FOSL and WSR.
Stocks/ETFs to Review (no order): FPI, SIBN, IBP, SRI, ALB, PAVE and ESRT.
 Diamond Mine REGISTRATION Information:
When: Jun 11, 2021 09:00 AM Pacific Time (US and Canada)
Topic: DecisionPoint Diamond Mine (6/11/2021) LIVE Trading Room
Register in advance for this webinar HERE.
After registering, you will receive a confirmation email containing information about joining the webinar, including the password. SAVE IT! Zoom doesn't always send out the reminders.
=======================================================================
Diamond Mine RECORDING Link:
Topic: DecisionPoint Diamond Mine (6/4/2021) LIVE Trading Room
Start Time : Jun 4, 2021 09:00 AM PT
Meeting Recording LINK.
Access Passcode: June-4th
***Click here to register for this recurring free DecisionPoint Trading Room on Mondays at Noon ET!***
+++++++++++++++++++++++++++++++++++++++++++++++++++++++++++++++++++++++++++++++
Free DP Trading Room RECORDING LINK:
Topic: DecisionPoint Trading Room
Start Time : Jun 7, 2021 08:41 AM
Meeting Recording Link.
Access Passcode: June-7th
For best results, copy and paste the access code to avoid typos.
Welcome to DecisionPoint Daily Diamonds, wherein I highlight five "diamonds in the rough." These are selected from the results of my DecisionPoint scans, which search for stocks that could benefit from the trend and condition of the market. Remember, these are not recommendations to buy or sell, but are the most interesting of the stocks that surfaced in my scans. My objective is to save you the work of the initial, tedious culling process, but you need to apply your own analysis to see if these stocks pique your interest as well. There are no guaranteed winners here!
Dycom Industries, Inc. (DY)
EARNINGS: 8/25/2021 (BMO)
Dycom Industries, Inc. provides contracting services throughout the United States. Its services include engineering, construction, maintenance and installation services to telecommunications providers, underground facility locating services to various utilities, including other construction and maintenance services to electric and gas utilities, and others. The company was founded in 1969 and is headquartered in Palm Beach Gardens, FL.
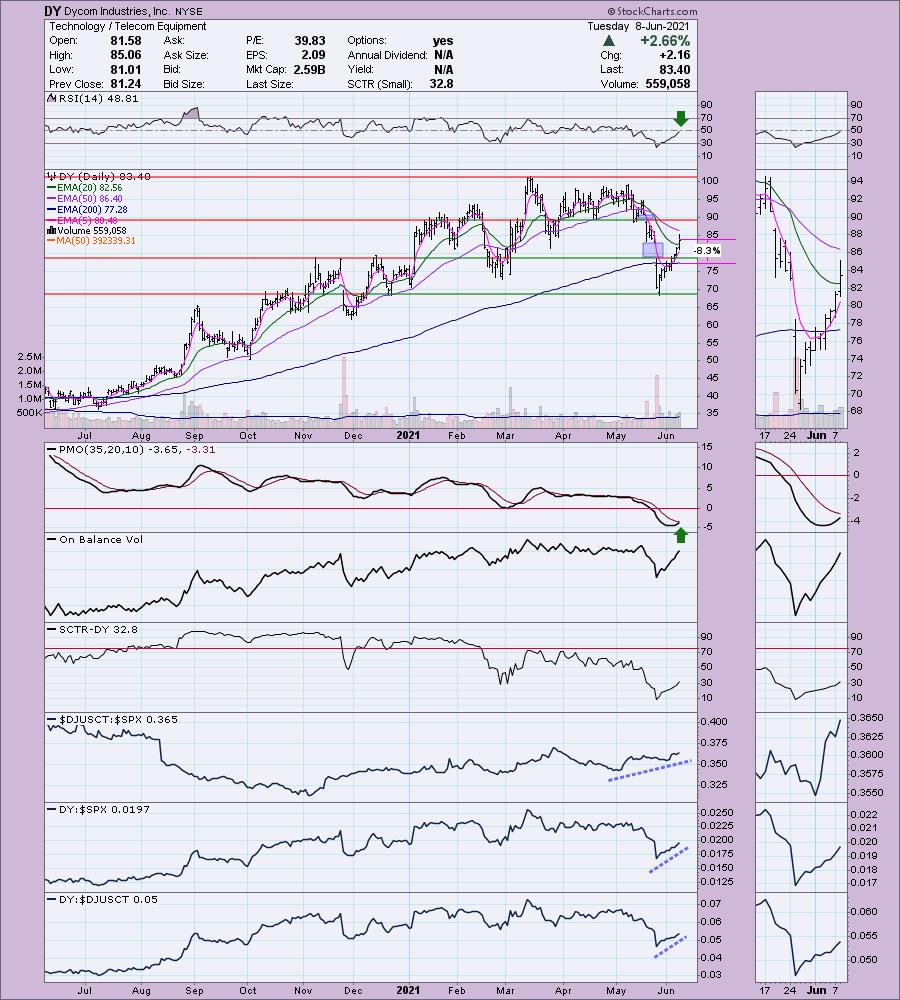
DY is up +0.72% in after hours trading. I covered DY in the October 14th 2020 Diamonds Report. I didn't put a stop on the chart, but an 8% stop wouldn't have triggered even on the big gap down in November. This means that the position is up +26.7%. The end of May was killer for DY, but it is retracing the decline rapidly. The first of two gaps has now been covered. Today's rally pushed DY above the 20-EMA. The PMO had already begun to curl upward. The RSI isn't positive yet, but it is on its way. The industry group is outperforming the SPX and DY is outperforming both. The stop is set below the gap, right around the 200-EMA at $77.28.
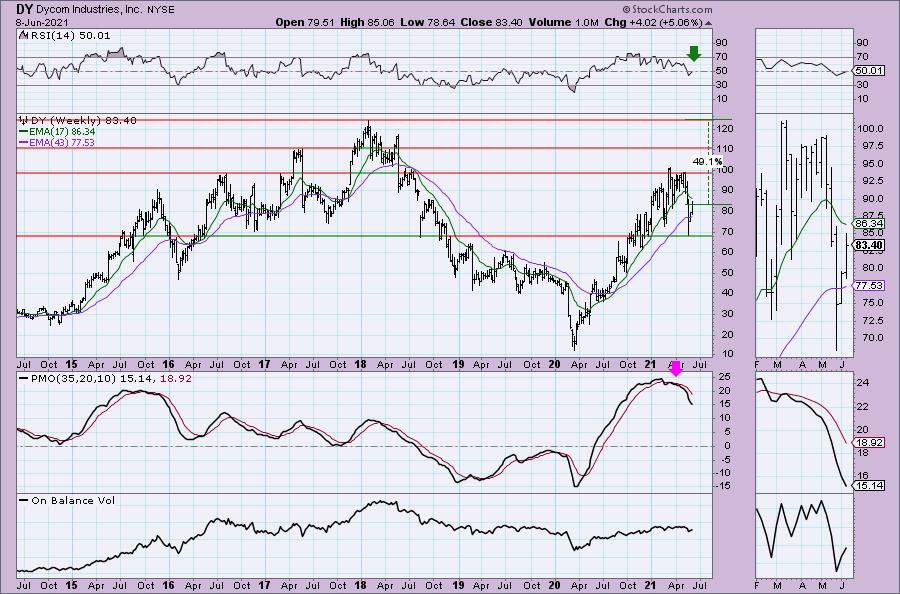
The weekly chart is suspect. However, the RSI is working on recapturing positive territory above net neutral (50) and the weekly PMO has decelerated ever so slightly. Upside potential is near 50%, but even if it reaches overhead resistance at the 2021 high, that is still a 21%+ upside target.
Fossil Group, Inc. (FOSL)
EARNINGS: 8/11/2021 (AMC)
Fossil Group, Inc. engages in the design, marketing and distribution of consumer fashion accessories. The firm operates through the following geographical segments: Americas, Europe, and Asia. Its products include men's and women's fashion watches, jewelry, handbags, small leather goods, belts, sunglasses, shoes, soft accessories and clothing which are sold through department stores, specialty retail locations, specialty watch and jewelry stores, owned retail and factory outlet stores, mass market stores, owned, and affiliate internet sites. The company was founded by Tom Kartsotis in 1984 and is headquartered in Richardson, TX.
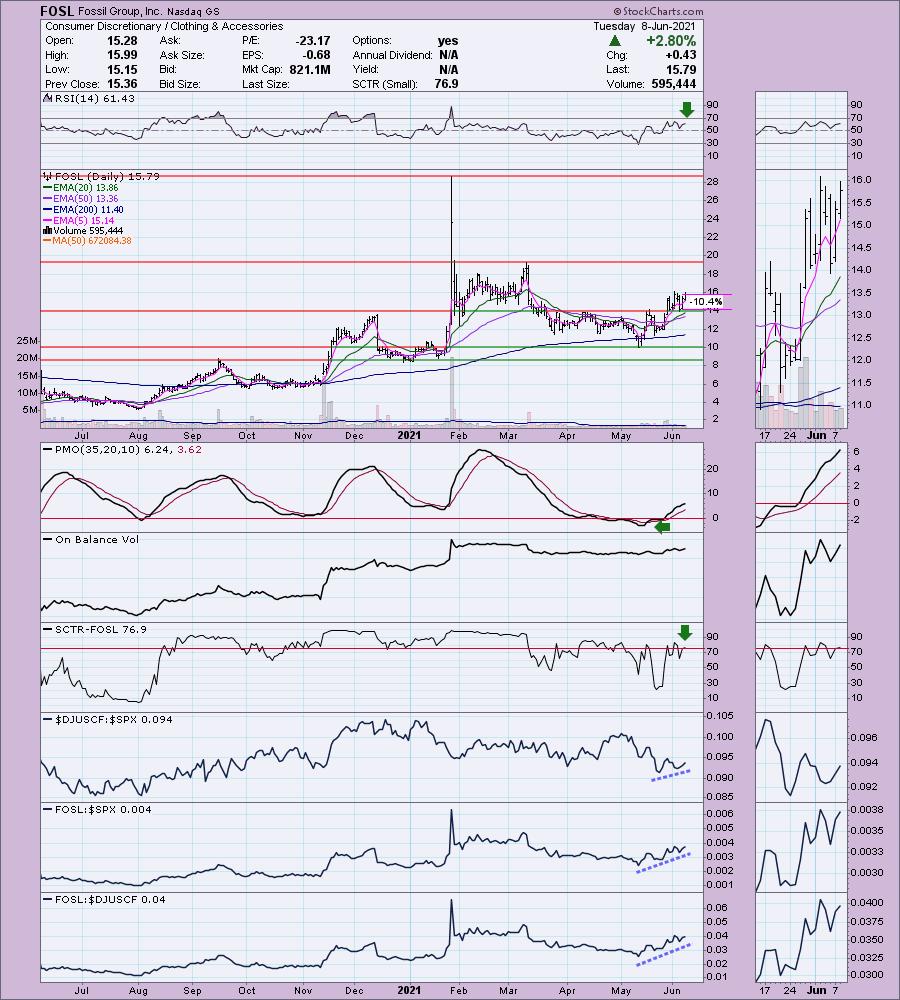
FOSL is unchanged in after hours trading. Like I said, I love this chart. The RSI is positive and not at all overbought. The PMO is on an oversold crossover BUY signal and is not overbought at all. The OBV has begun to trend up with price. The SCTR just reentered the "hot zone" above 75, implying it is in the top quartile of all small-cap stocks. Performance is rising in all three indicator windows. One thing I really like about price action is the consolidation above support, it is preparing FOSL for a breakout to the March top. The stop is rather deep, but I wanted it to be as close to support as possible because it may want to consolidate a bit longer.
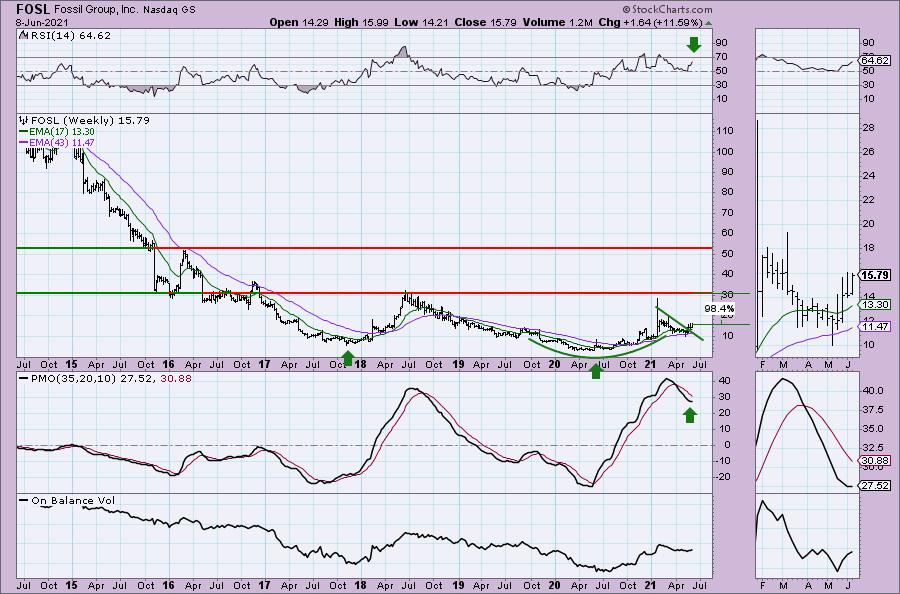
The weekly chart is enticing for an intermediate-term investor. The weekly RSI is positive and the weekly PMO is just now turning up. There is a long-term double-bottoms pattern using the 2017 and 2020 lows. In the intermediate term, there is a cup and handle with a recent breakout from the handle. Upside potential is excellent at almost 100%, but even a move to challenge the 2021 top would be almost 80%. Granted they are carrying negative EPS, so definitely keep a stop in play.
Whitestone REIT (WSR)
EARNINGS: 8/4/2021 (AMC)
Whitestone REIT engages in the operation of commercial properties in culturally diverse markets of major metropolitan areas. The company was founded on August 20, 1998 and is headquartered in Houston, TX.
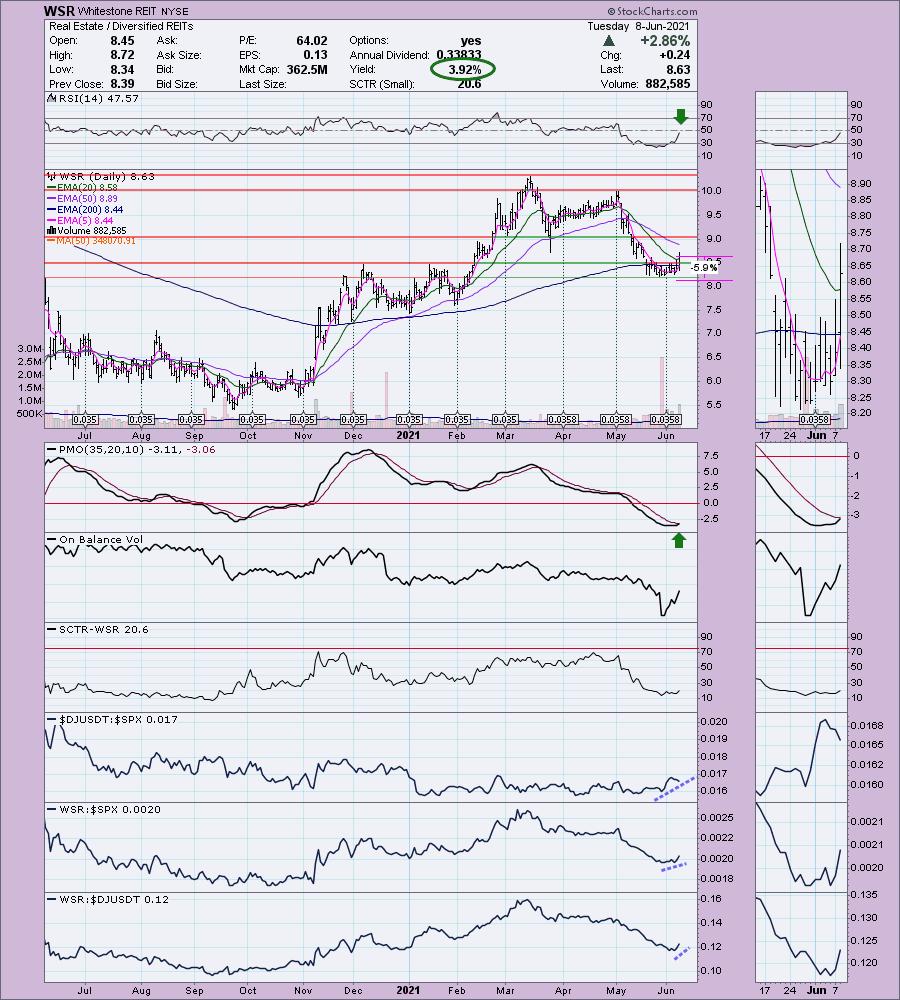
WSR is up +1.39% in after hours trading, so we may be onto something here. This is a little bit of a bottom fish which is why the RSI is still negative. However, today's breakout was impressive as it took price above the 20-EMA for the first time since it fell out of bed in early May. The PMO is nearing a crossover BUY signal in oversold territory. The OBV has spiked upward. Performance is a little hit and miss for the group and WSR, but this sure looks like a strong price bottom. Two bonuses: you can set a thin stop at 6% and it has an excellent yield.
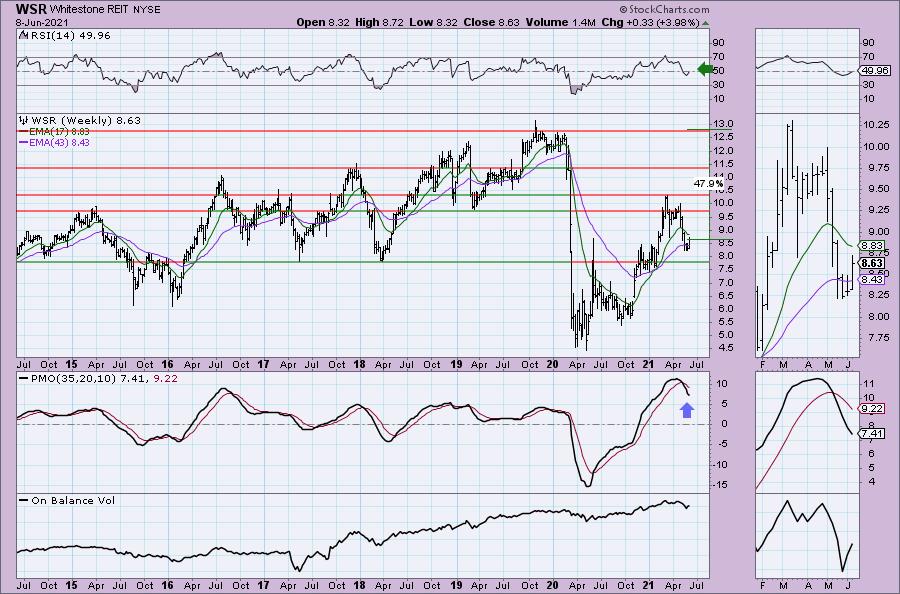
The weekly chart isn't great. Price is vulnerable to a test of the 2017/2018 lows. The RSI is about to move into positive territory and the PMO is decelerating slightly.
Don't forget, on Thursdays I look at reader-requested symbols, so shoot me an email at erin@decisionpoint.com. I read every email I receive and try to answer them all!
Current Market Outlook:
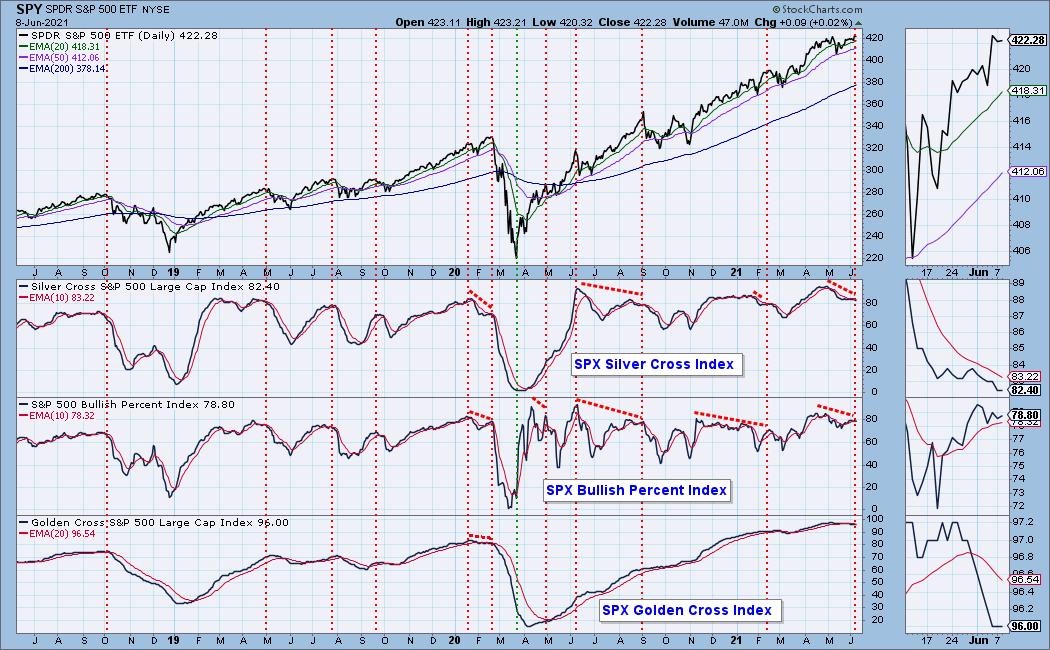
Market Environment: It is important to consider the odds for success by assessing the market tides. The following chart uses different methodologies for objectively showing the depth and trend of participation for intermediate- and long-term time frames.
- The Silver Cross Index (SCI) shows the percentage of SPX stocks on IT Trend Model BUY signals (20-EMA > 50-EMA)
- The Golden Cross Index (GCI) shows the percentage of SPX stocks on LT Trend Model BUY signals (50-EMA > 200-EMA)
- The Bullish Percent Index (BPI) shows the percentage of SPX stocks on Point & Figure BUY signals.
Don't forget that as a "Diamonds" member, you have access to our GCI/SCI curated ChartList on DecisionPoint.com. You'll find it under "Members Only" links on the left side on the Blogs and Links Page.
Here is the current chart:
Diamond Index:
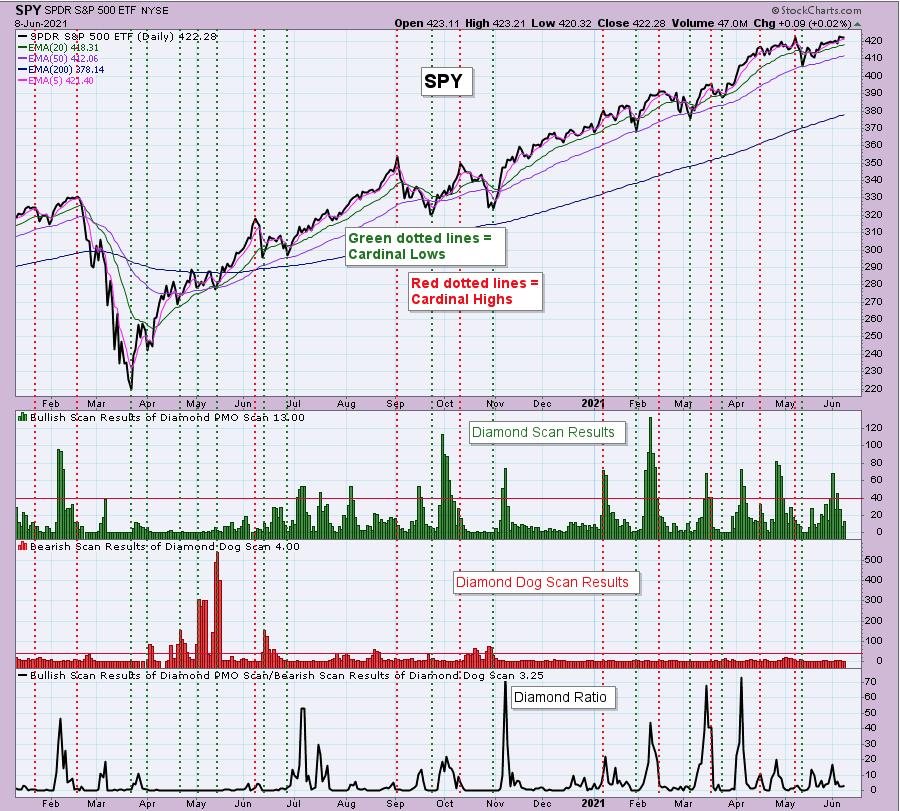
The Diamond Index chart looks at the number of scan results from my bullish Diamond PMO Scan and the number of scan results from the inverse Diamond Dog Scan. The Diamond Ratio divides the bullish results by the bearish results.
I only have data going back to October 2019 so I won't make any sweeping conclusions about the Diamond Index chart. I have marked cardinal tops with red dotted vertical lines and cardinal price bottoms with green dotted vertical lines. I believe that when the Diamond Dog results spike, it usually comes at a price bottom, or marks a strong continuation of the rising trend.
Unfortunately, the Diamond PMO Scan result numbers aren't providing much insight. The Diamond Ratio has promise, but again I don't see a clear correlation to the market tops/bottoms right now. I need to study and manipulate the data some more. Keep you posted!
Full Disclosure: I'm about 70% invested and 30% is in 'cash', meaning in money markets and readily available to trade with. You can bet I'll be watching the 5-minute candlestick chart on FOSL in the morning.
Technical Analysis is a windsock, not a crystal ball.
Happy Charting!
- Erin
erin@decisionpoint.com
Watch the latest episode of DecisionPoint with Carl & Erin Swenlin on Mondays 7:00p EST or on the DecisionPoint playlist on the StockCharts TV YouTube channel here!
NOTE: The stocks reported herein are from mechanical trading model scans that are based upon moving average relationships, momentum and volume. DecisionPoint analysis is then applied to get five selections from the scans. The selections given should prompt readers to do a chart review using their own analysis process. This letter is not a call for a specific action to buy, sell or short any of the stocks provided. There are NO sure things or guaranteed returns on the daily selection of "diamonds in the rough."
Helpful DecisionPoint Links:
DecisionPoint Shared ChartList and DecisionPoint Chart Gallery
Price Momentum Oscillator (PMO)
Swenlin Trading Oscillators (STO-B and STO-V)
For more links, go to DecisionPoint.com
