
Before I begin, I do want to thank the live viewers who patiently waited for today's Diamond Mine to open as I was running late. The webinar went very long today. The recording is under the "Diamond Mine Information" below.
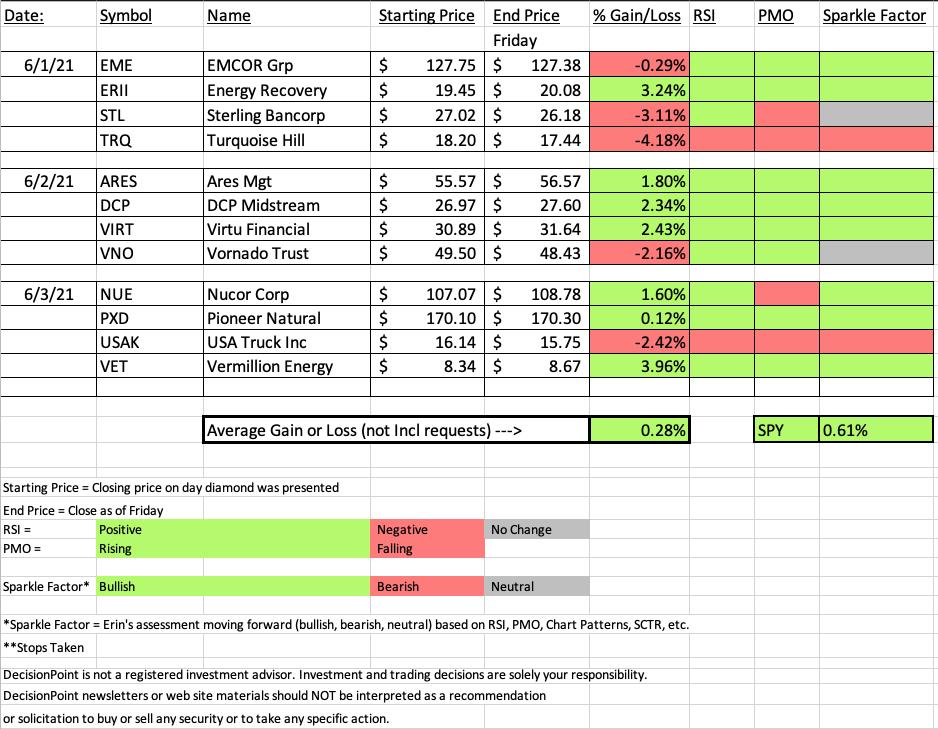
Diamonds performed well in general, they were up about as much as the SPY was this week. Remember, the SPY has all week to make its moves while "Diamonds in the Rough" only get a few days at most. These picks should be watch listed as the majority of the time we do see them outperform, just not in one week.
This week's Darling was a reader request that broke out in one day for a 3.96% gain! Nice suggestion on VET. Tuesday's ERII was the runner up and since I just looked at VET yesterday, I plan on reviewing it. It was up 3.24% since it was picked on Tuesday.
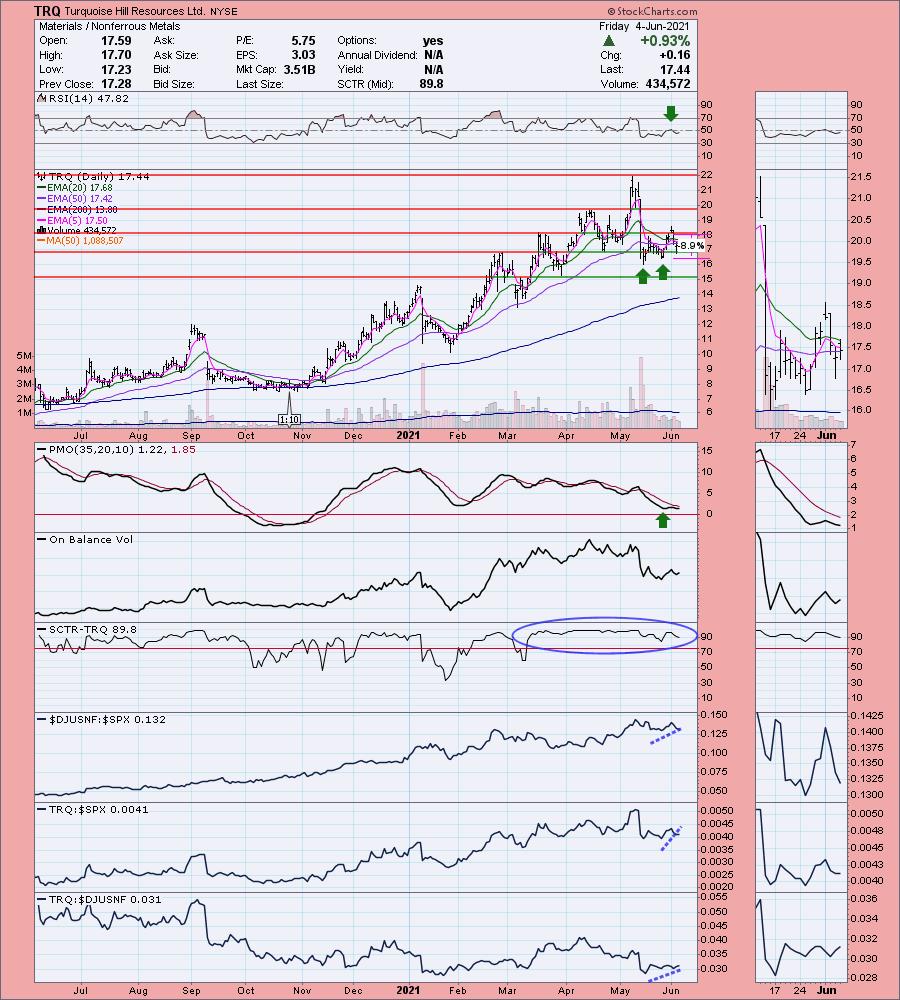
This week's Dud is TRQ which is down -4.18% since Tuesday. That chart went south very quickly and it doesn't look great moving forward.
Register now for next week's Diamond Mine trading room on June 11th right HERE or below.
(Full Disclosure: Of this week's Diamonds, I own DCP)
Diamond Mine Information:
RECORDING LINK:
Topic: DecisionPoint Diamond Mine (6/4/2021) LIVE Trading Room
Start Time : Jun 4, 2021 09:17 AM
Diamond Mine Recording Link.
Access Passcode: June-4th
REGISTRATION:
When: Jun 11, 2021 09:00 AM Pacific Time (US and Canada)
Topic: DecisionPoint Diamond Mine (6/11/2021) LIVE Trading Room
Register in advance for this webinar HERE.
Save the registration confirmation email with login instructions in case Zoom doesn't notify you in time.
A few items about the spreadsheet: I decided it only fair to denote "reader requests" as I shouldn't get to take credit if they turn out great! I've put on the spreadsheet whether the RSI is positive (green) or negative (red). The PMO column tells you if it is rising (green) or falling (red). Finally I've added my own "Sparkle Factor" that gives you my assessment going forward, bullish (green), bearish (red) or neutral (gray). The Sparkle Factor is basically my thoughts on whether I expect it to rise or fall. A neutral means it could really go either way so it could be added to a watch list. If you're in a stock I consider "neutral" going forward, the ball is in your court.
Free DP Trading Room RECORDING LINK:
Topic: DecisionPoint Trading Room
Start Time : May 31, 2021 09:00 AM PT
Meeting Recording Link HERE.
Access Passcode: May-31st
For best results, copy and paste the access code to avoid typos.

Arthur Hill, CMT in free DecisionPoint Trading Room June 7th!
Arthur Hill, CMT, is the Chief Technical Strategist and main author at TrendInvestorPro.com. Schooled in classical technical analysis, Arthur crossed over to the dark side, quantitative analysis, in 2012. Classical technical analysis provides a solid foundation for learning, but is largely subjective and discretionary in nature. Quantitative analysis puts classical technical indicators to the test with clear rules, signals and results. Taken together, classical chart analysis and quantitative analysis provide the basis for Arthur's systematic approach to analysis, trading and investing. Next level technical analysis.
Click here to register in advance for the recurring free DecisionPoint Trading Room! Recordings are available!
Darling:
Energy Recovery Inc. (ERII)
EARNINGS: 8/5/2021 (AMC)
Energy Recovery, Inc. engages in the design and manufacture of industrial fluid flow solutions. It operates through the Water, and Oil and Gas segments. The Water segment in sea, brackish, and contaminated water reverse osmosis desalination solutions. The Oil and Gas segment delivers hydraulic fracturing, gas processing, and chemical processing services. Its products include PX Pressure Exchanger, pumping systems, turbochargers, PX PowerTrain, Ultra PX, and VorTeq. The company was founded in April 1992 and is headquartered in San Leandro, CA.
Below is the commentary and chart from Tuesday:
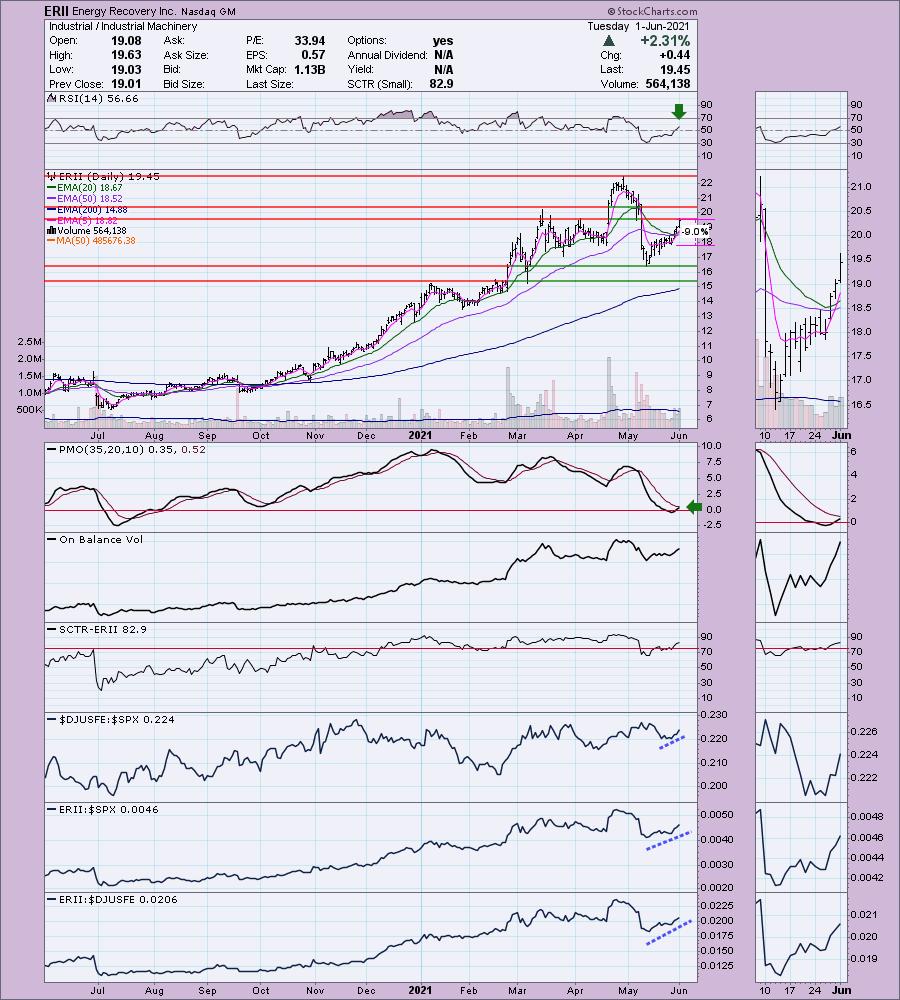
"ERII is unchanged in after hours trading. I covered ERII in the February 16th 2021 Diamonds Report. It never hit it stop and is up +27.1%. Granted it has already rallied most of May, but given the set up on this chart, I believe it will continue higher. Price has hit overhead resistance at the early April high, but momentum is building here. The PMO turned up just above the zero line and is headed for a crossover BUY signal. The RSI has just moved into positive territory and the SCTR has spent most of the past six months in the "hot zone" above 75, meaning it is in the upper quartile of all small-cap stocks."
Here is today's chart:
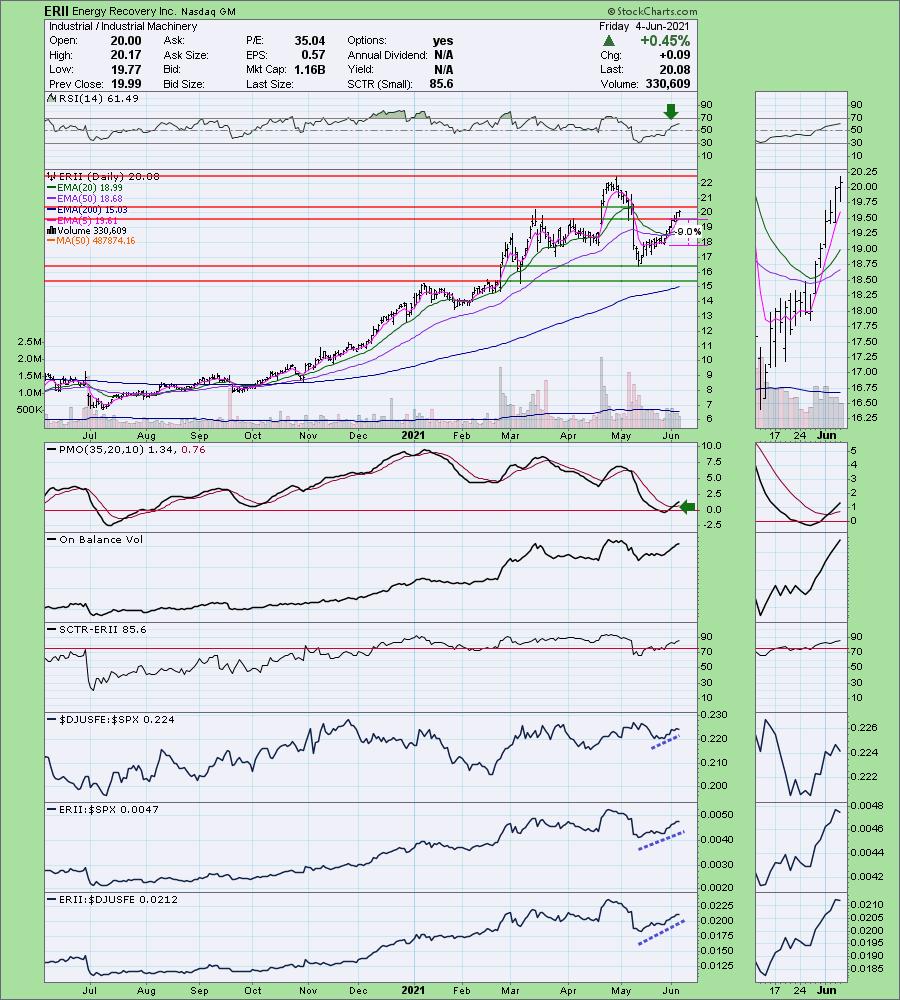
This one is chugging along nicely. The only issue right now is the next level of overhead resistance. However, I do like this industry group; it's beginning to outperform the SPX. We should see the breakout as the PMO and RSI are still configured positively. The PMO had a crossover BUY signal since Tuesday and I like that the RSI is not at all overbought in positive territory.
Don't forget, on Thursdays I look at reader-requested symbols, so shoot me an email at erin@decisionpoint.com. I read every email I receive and try to answer them all!
Dud:
Turquoise Hill Resources Ltd. (TRQ)
EARNINGS: 7/28/2021 (AMC)
Turquoise Hill Resources Ltd. engages in the exploration and development of mineral properties. It focuses on Oyu Tolgoi Copper-Gold Mine. The company was founded by Robert Martin Friedland on January 25, 1994 and is headquartered in Montreal, Canada.
Below is the commentary and chart from Tuesday:
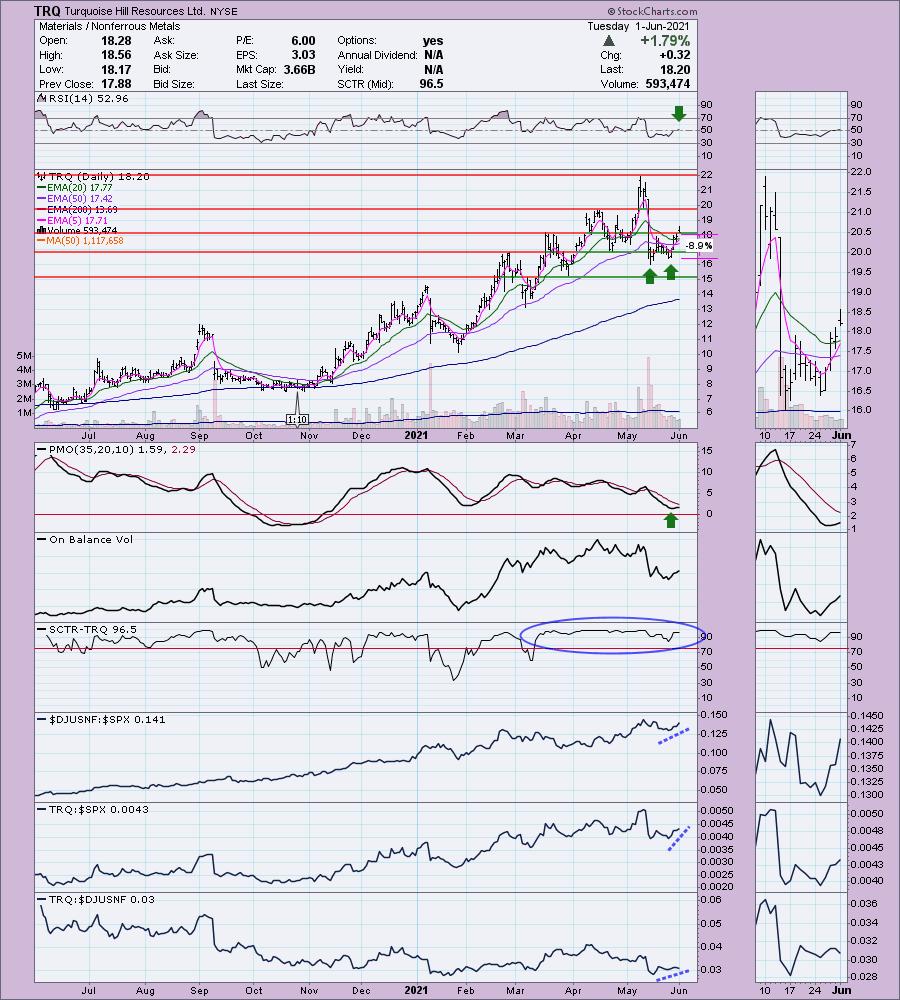
"TRQ is up +0.16% in after hours trading. I may have to pick this one up as I really do like the chart. The one reason I may not is that I already have a portfolio that is somewhat heavy on the Materials side. The keyword in the company description is "copper". This stock was killed last month after earnings, but it is coming back. There is a short-term double-bottom that has executed on today's breakout. The minimum upside target would take it to overhead resistance at about $20. The RSI has just hit positive territory again and the PMO has turned up and is rising toward a crossover BUY signal. The SCTR is strong. I wish that OBV bottoms were rising, not falling, but volume does appear to be coming in. In the very short term it has begun to outperform the SPX. I suspect we will see it improve against its group soon. The stop is set below the second bottom of the double-bottom pattern."
Below is today's chart:
This chart went south right after I picked it. You can see from the chart and commentary above that it really was poised to outperform. The short-term rising trend is intact, but I do not like how it fell and believe you could take it off the watch list. I had wanted to get into USAK and TRQ this week, but as I said the trades went south and I'm no longer interested. The PMO topped below its signal line. The RSI sunk into negative territory. Performance has flattened and the industry group is failing now.
THIS WEEK's Sector Performance: 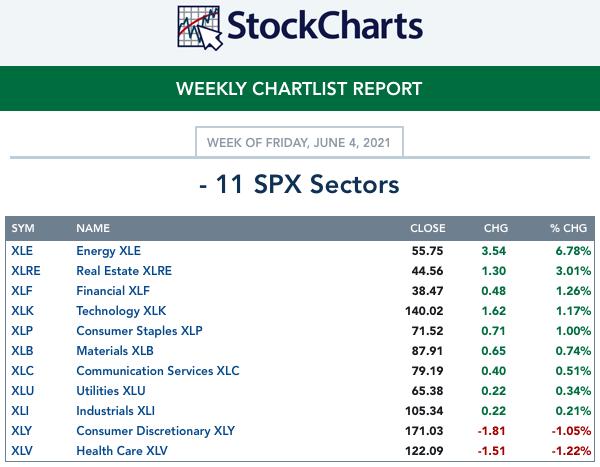
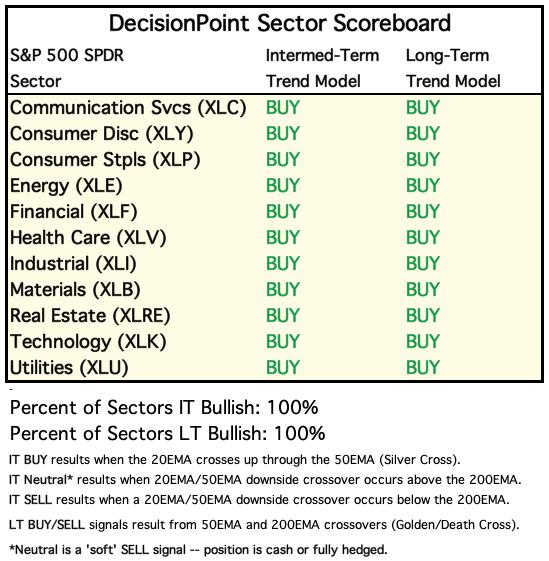
DecisionPoint Sector Scoreboard (Mechanical Trend Model Signals):
Click Here to view Carl's annotated Sector ChartList!
CONCLUSION:
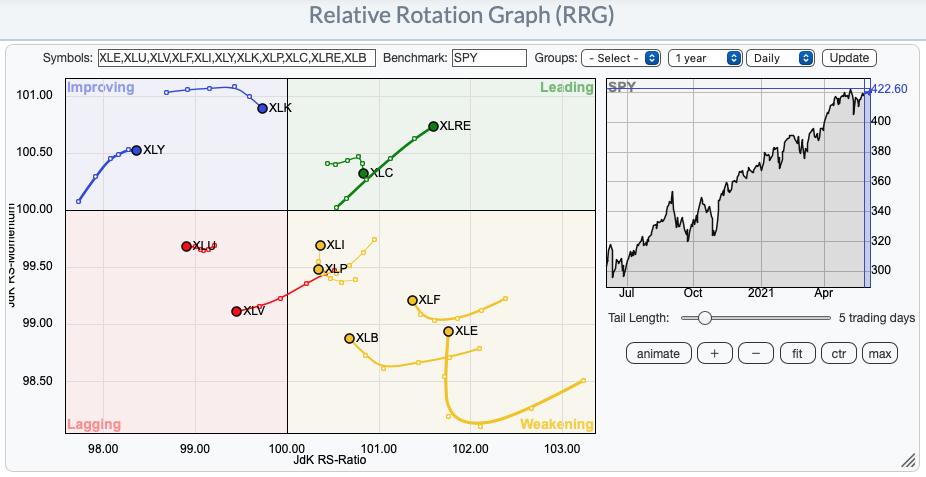
It shouldn't surprise us to see XLRE shooting further into the "Leading" category and XLE heading back into "Leading" from "Weakening". However, my sector to watch next week is Consumer Staples. It is beginning to hook back up toward the "Leading" quadrant from "Weakening". Note: This is the "Daily" RRG. It defaults to "Weekly".
Short-term RRG:
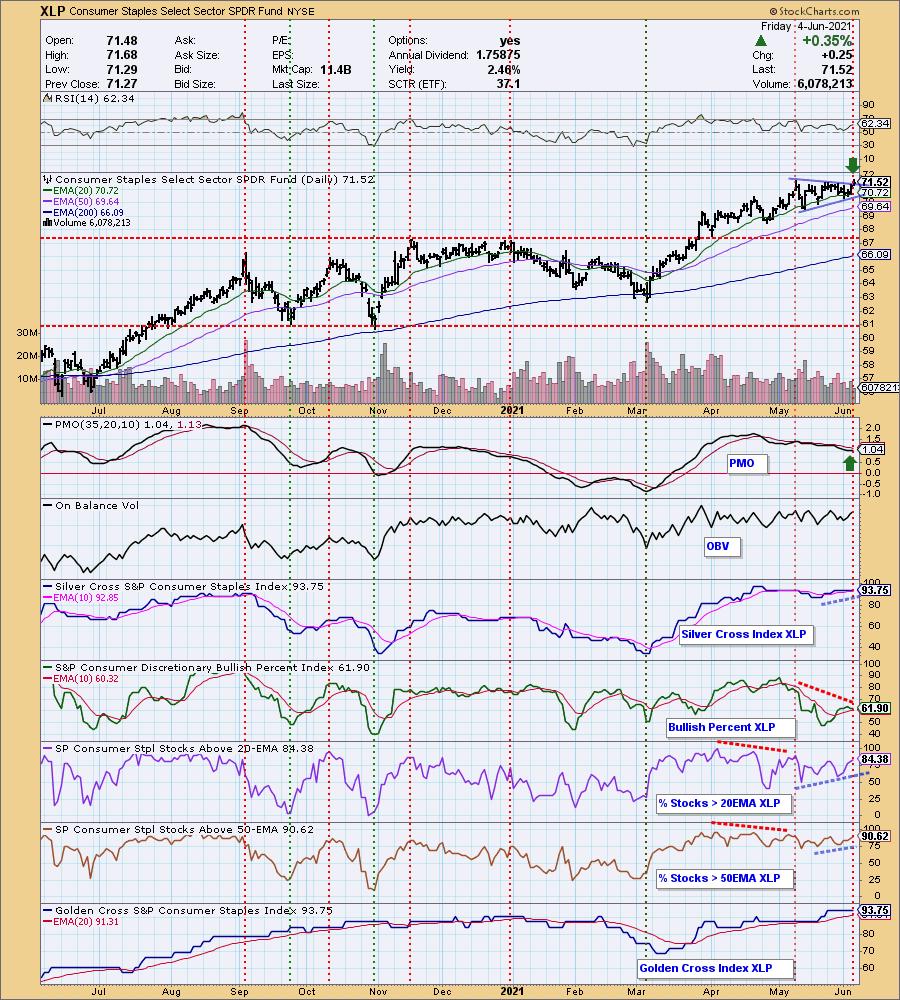
Sector to Watch: Consumer Staples (XLP)
Two things drew me to this sector. 1) The PMO has just turned up. 2) We have a breakout from a symmetrical triangle which is a continuation pattern. That suggests higher prices. Admittedly some of the participation numbers are overbought and that negative divergence on the BPI is troublesome. However, I think the positives outweigh the negatives.
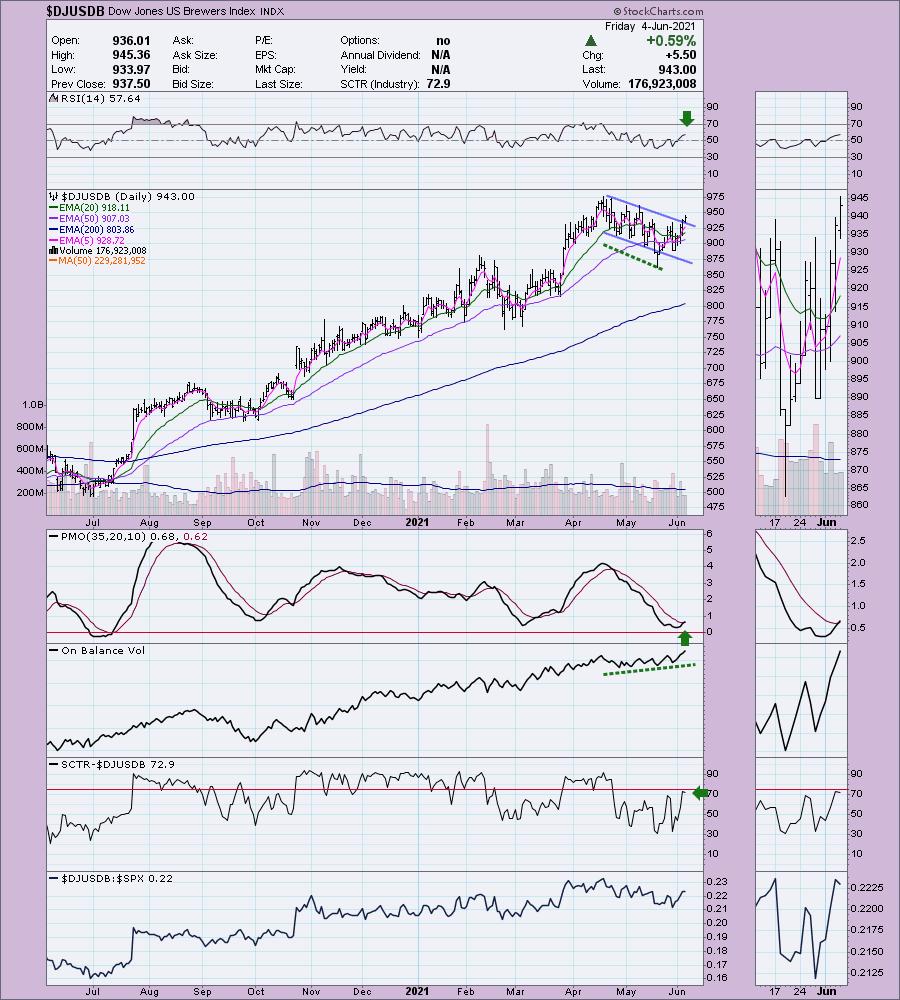
Industry Group to Watch: Brewers ($DJUSSC)
This was rather easy to find. The new breakout from a declining trend channel is very positive. The RSI is now positive and the PMO triggered a new crossover BUY signal today. Most stunning is the positive OBV divergence that led into this breakout. Typically positive divergences lead to sustained rallies. I took a quick peek at the stocks in this group. SAM appeared in my scan results yesterday. I also like TAP and if ABEV pulls back that could be a good one too.
Go to our Sector ChartList on DecisionPoint.com to get an in depth view of all the sectors.
Technical Analysis is a windsock, not a crystal ball.
Have a great weekend & Happy Charting!
- Erin
erin@decisionpoint.com
Full Disclosure: I'm about 55% invested right now and 45% is in 'cash', meaning in money markets and readily available to trade with. Diamonds purchased this week: ACB and CLVR. Probably will add MJ next week or add to positions if they pull back.
Watch the latest episode of DecisionPoint with Carl & Erin Swenlin on Mondays 7:00p EST or on the DecisionPoint playlist on the StockCharts TV YouTube channel here!
NOTE: The stocks reported herein are from mechanical trading model scans that are based upon moving average relationships, momentum and volume. DecisionPoint analysis is then applied to get five selections from the scans. The selections given should prompt readers to do a chart review using their own analysis process. This letter is not a call for a specific action to buy, sell or short any of the stocks provided. There are NO sure things or guaranteed returns on the daily selection of "diamonds in the rough."
Helpful DecisionPoint Links:
DecisionPoint Shared ChartList and DecisionPoint Chart Gallery
Price Momentum Oscillator (PMO)
Swenlin Trading Oscillators (STO-B and STO-V)
