
Scan results have expanded so I decided to pull from my Momentum Sleepers scan today. This means there is brand new momentum being picked up under the surface on stocks that have been previously beaten down. The picks are diverse today with one from the Software industry group, one in the Industrials sector and one from the Medical Equipment industry group.
There are plenty of "Stocks to Review" today as I found some very interesting chart formations and more stocks from the Momentum Sleepers scan results and 5/20-EMA positive crossovers scan.
Tomorrow is "Reader Request" day so get your symbols in for possible review in tomorrow's Diamonds Report. Any that I don't cover in the report, I'll add to the list for review in Friday's Diamond Mine trading room.
Today's "Diamonds in the Rough" are: ATEC, CAT and FICO.
"Stocks to Review" culled from today's requests: BILL, ASML, DFIN, RCUS, MGY, ARI, ARKG, PTON and SWBI.
** IMPORTANT new procedures for trading room SYMBOL REQUESTS **
I'm trying to formalize the process for symbol requests in my trading rooms. Since not everyone can attend live, I encourage you to email me your requests for Monday's free trading room and Friday morning's Diamond Mine. A subject line with "Symbol Request" will help me a great deal.
If you are attending live, you have the first 15 minutes to get your requests in the Q&A box. Please only request one or at most two and as always, let me know if your request is for a buy, hold or sell/short.
I've made a promise that all Diamond subscribers will get their symbols looked at on Fridays but that has been difficult to do within the time constraints I have. Emailing the night before will ensure your request is looked at and time permitting, I will cover all the live requests from the first 15 minutes.
As our community grows it will become harder and harder for me to live up to my promise, but for now I believe I can get them all in if we use this more formal process for making requests.

RECORDING LINK Friday (8/20):
Topic: DecisionPoint Diamond Mine (8/20/2021) LIVE Trading Room
Start Time : Aug 20, 2021 08:58 AM
Meeting Recording Link HERE.
Access Passcode: August/20th
REGISTRATION FOR FRIDAY 8/27 Diamond Mine:
When: Aug 27, 2021 09:00 AM Pacific Time (US and Canada)
Topic: DecisionPoint Diamond Mine (8/27/2021) LIVE Trading Room
Register in advance for this webinar HERE.
Save the registration confirmation email with login instructions in case Zoom doesn't notify you in time.

Free DP Trading Room (8/23) RECORDING LINK:
Topic: DecisionPoint Trading Room
Start Time : Aug 23, 2021 09:01 AM
Meeting Recording Link HERE.
Access Passcode: August#23
For best results, copy and paste the access code to avoid typos.
Welcome to DecisionPoint Daily Diamonds, wherein I highlight five "Diamonds in the Rough." These are selected from the results of my DecisionPoint scans, which search for stocks that could benefit from the trend and condition of the market. Remember, these are not recommendations to buy or sell, but are the most interesting of the stocks that surfaced in my scans. My objective is to save you the work of the initial, tedious culling process, but you need to apply your own analysis to see if these stocks pique your interest as well. There are no guaranteed winners here!
Alphatec Holdings Inc. (ATEC)
EARNINGS: 11/4/2021 (AMC)
Alphatec Holdings, Inc. engages in the design, development, and marketing of spinal fusion technology products and solutions for the treatment of spinal disorders. It offers intra-operative information and neuromonitoring technologies, access systems, interbody implants, fixation systems, and various biologics offerings. The company was founded on March 4, 2005 and is headquartered in Carlsbad, CA.
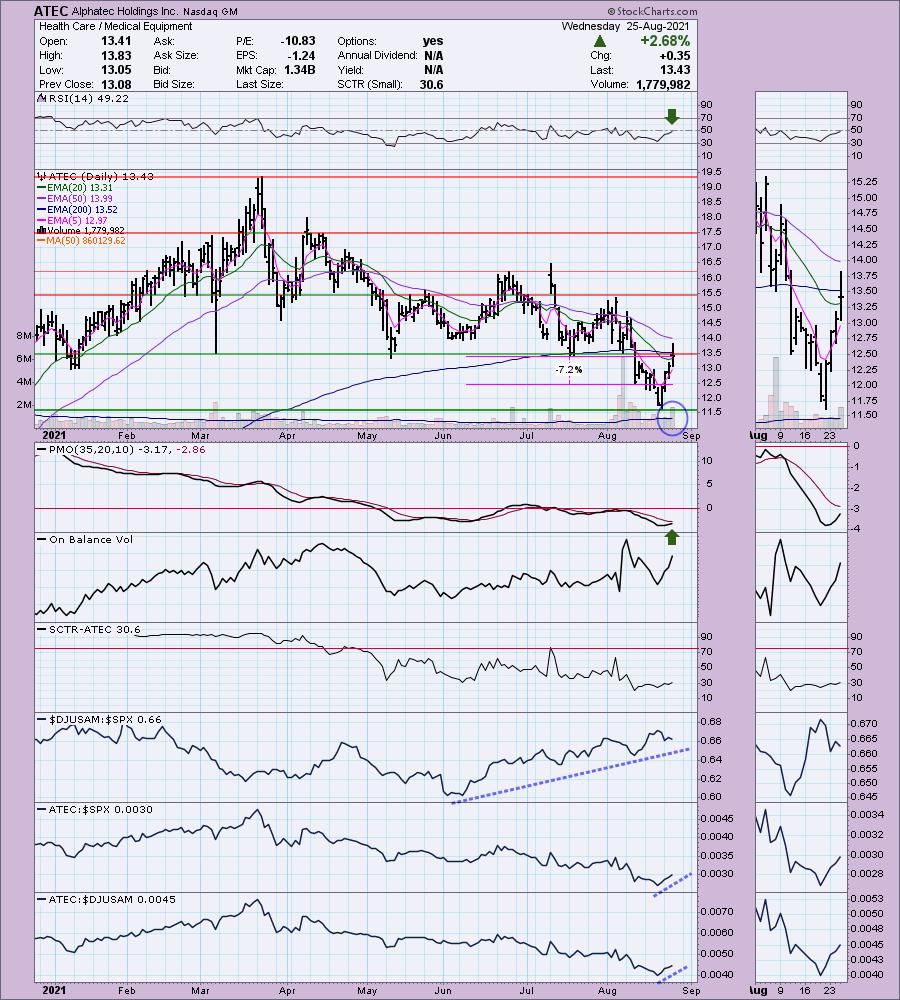
ATEC is up +1.41% in after hours trading even after a day that it was up +2.68%. This "V" bottom price pattern is very bullish. When price retraces back up one third of the decline into the "V", the expected result is a rally past the top of the left side of the "V". In this case it would mean a breakout above resistance at $15.50. The RSI is not positive yet, but it is on its way. The PMO has turned up in oversold territory and is likely to give us a crossover BUY signal very soon. Price closed above the 20-EMA forming a bullish "doji" candlestick. Volume is coming in and relative performance measures are all positive. I would've liked to have set the stop below the "V", but that is too deep for me so I opted to line it up at that early August low.
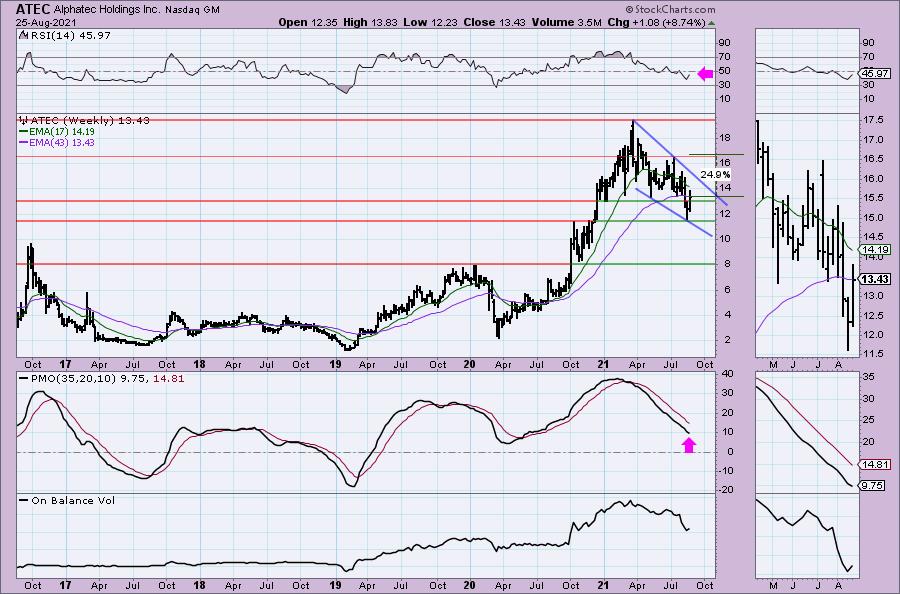
The weekly indicators are not favorable, but the price pattern is. We have a bullish falling wedge which implies an upside breakout ahead. Notice that price bounced off support at the October 2020 tops. It has broken through resistance at the January and May intraday lows. Upside potential is strong at about 25%.
Caterpillar, Inc. (CAT)
EARNINGS: 10/27/2021 (BMO)
Caterpillar, Inc. engages in the manufacture of construction and mining equipment, diesel and natural gas engines, industrial gas turbines, and diesel-electric locomotives. It operates through the following segments: Construction Industries, Resource Industries, Energy and Transportation, Financial Products, and All Other. The Construction Industries segment supports customers using machinery in infrastructure and building construction applications. The Resource Industries segment is responsible for supporting customers using machinery in mining and quarrying applications and it includes business strategy, product design, product management and development, manufacturing, marketing and sales and product support. The Energy and Transportation segment supports customers in oil and gas, power generation, marine, rail, and industrial applications. The Financial Products segment offers a range of financing alternatives to customers and dealers for caterpillar machinery and engines, solar gas turbines, as well as other equipment and marine vessels. The All Other segment include activities such as the business strategy, product management and development, and manufacturing of filters and fluids, undercarriage, tires and rims, engaging tools, and fluid transfers. The company was founded on April 15, 1925 and is headquartered in Deerfield, IL.
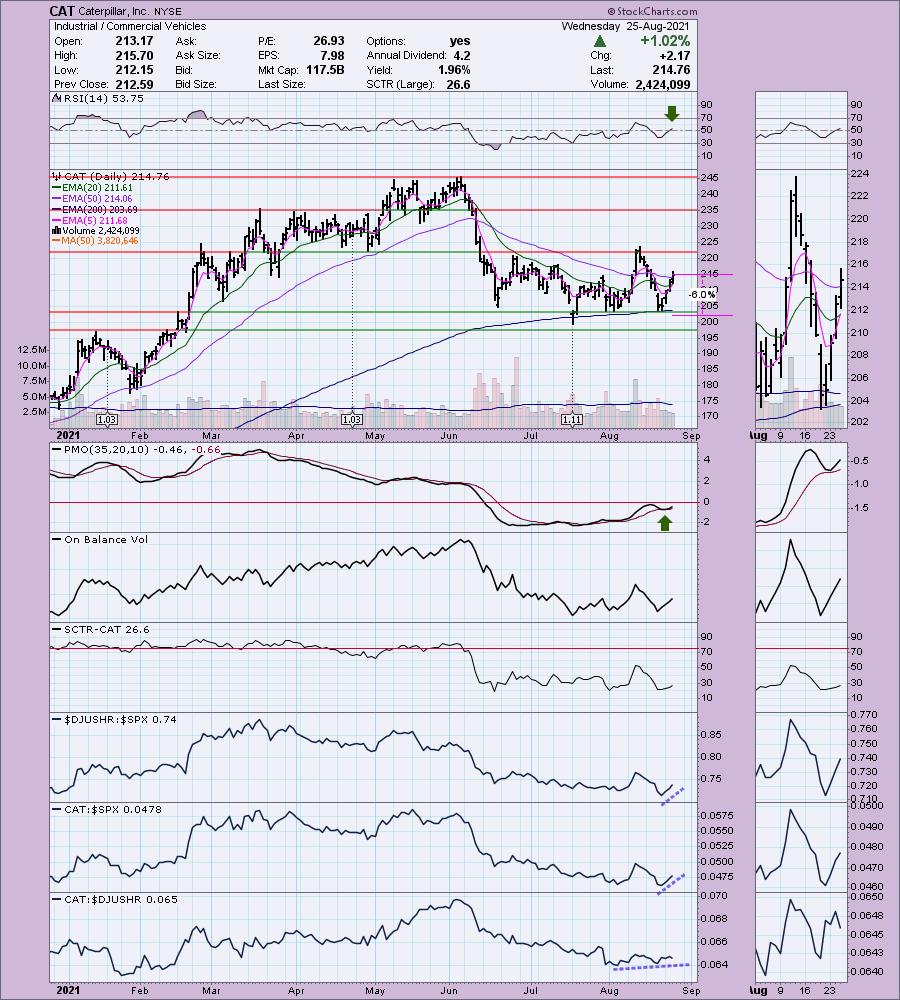
CAT is unchanged in after hours trading. I was shocked to find out I'd never covered Caterpillar before. The chart looks really good right now. The RSI just hit positive territory. Price broke above the 50-EMA. There is a new ST Trend Model BUY signal as the 5-EMA crossed above the 20-EMA today. The PMO has bottomed above its signal line which I always find especially bullish. Relative performance is good. The only issue I see is that resistance at the top of the trading range is arriving soon, but given the positive indicators, I would expect it to continue higher. The stop is reasonable at 6%, putting it below the bottom of the trading range and the 200-EMA.
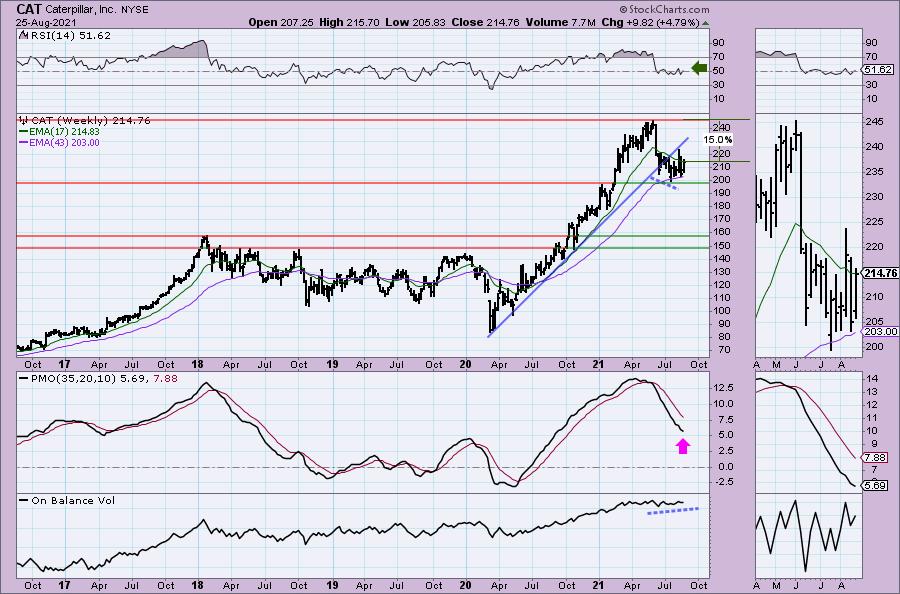
The weekly chart is mixed. The weekly PMO is quite ugly, maybe it's decelerating, but it's hard to tell. Price broke below a long-term rising bottoms trendline and hasn't recaptured it. On the positive side, the weekly RSI is positive and price is holding above support at the 43-week EMA and January 2021 top. Upside potential at 15% is more than double our stop level.
Fair Isaac & Co., Inc. (FICO)
EARNINGS: 11/2/2021 (AMC)
Fair Isaac Corp. engages in the provision of decision management solutions. It operates through the following segments: Applications, Scores, and Decision Management Software. The Applications segment includes decision management applications designed for a type of business problem or process such as marketing, account origination, customer management, fraud, collections, and insurance claims management. The Scores segment consists of business-to-business scoring solutions and services, business-to-consumer scoring solutions and services including myFICO solutions for consumers, and associated professional services. The Decision Management Software segment comprises the analytic and decision management software tools, FICO decision management suite, and associated professional services. The company was founded by Bill Fair and Earl Isaac in 1956 and is headquartered in San Jose, CA.
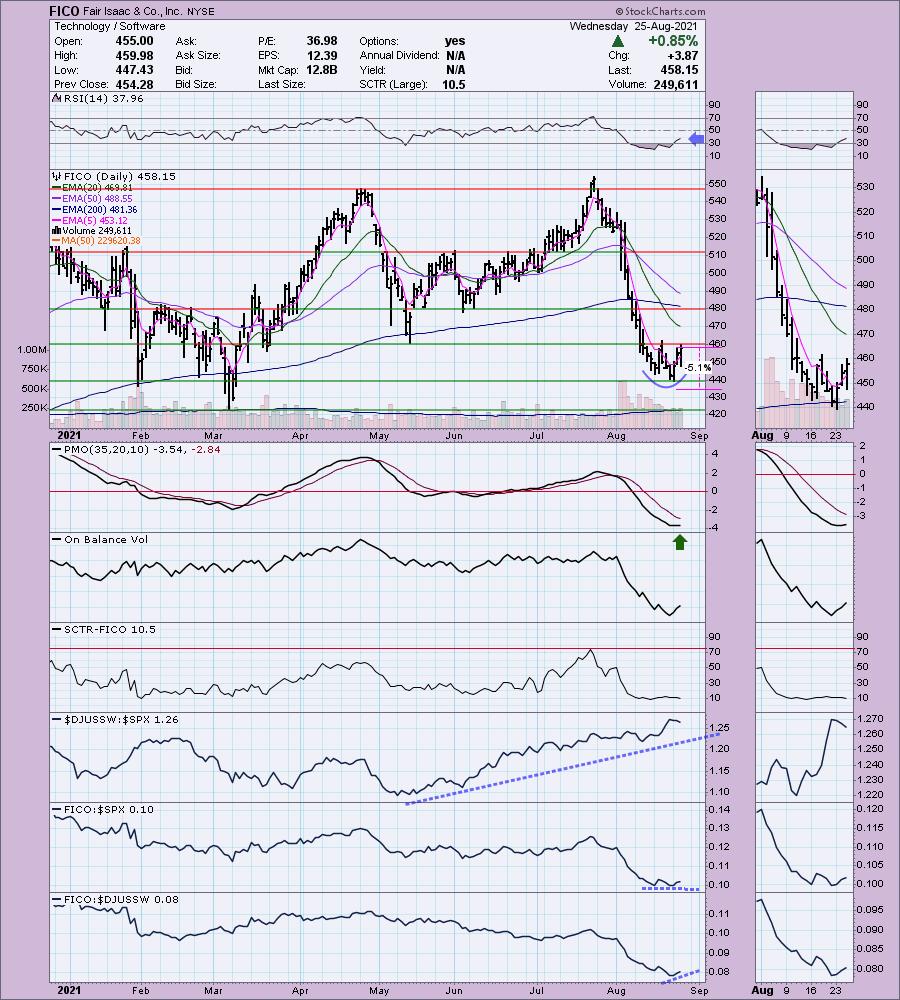
FICO is unchanged in after hours trading. This was a doomed to failure stock pick on February 19th 2020 given the market collapse either the next day or just after. The 9.7% stop was hit quickly. Given there were few stocks that survived the bear market collapse, I don't feel that bad.
It appears that it is ready for a solid reversal. We have an RSI rising out of oversold territory. There is a rounded price bottom that aligns with the late January price low. Or you could look at this as a bounce above the support "zone" between the January 2021 price low and the March 2021 price low. The PMO has just turned up and volume is coming in. It's not performing that great against the SPX, but that appears to be improving. I like that I can set a nice 5.1% stop. If you wanted to align the stop with the March low, it is still reasonable at under 8%.
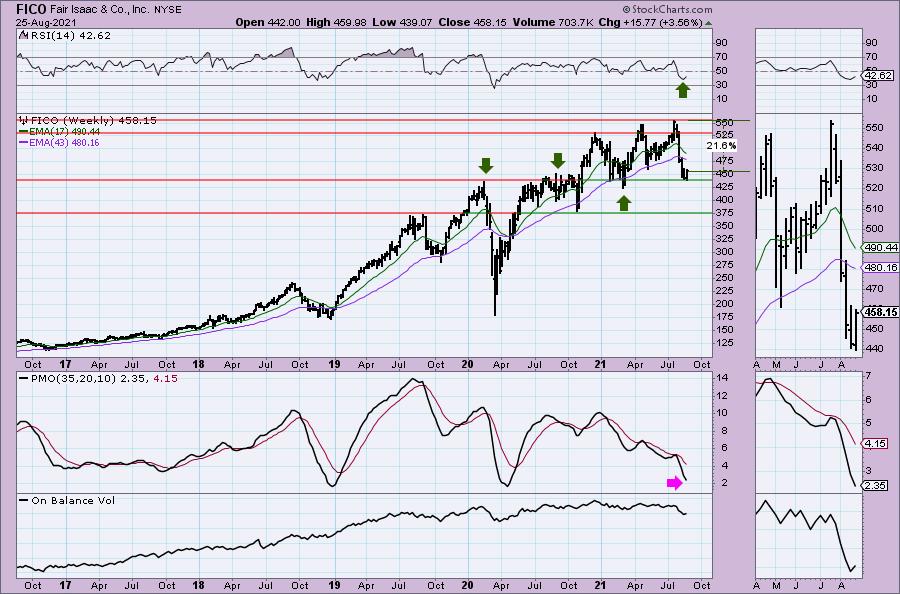
The weekly chart shows us that this low is lining up very well with support not only in 2021, but also at the tops in 2020. The weekly RSI has turned up in oversold territory. The only good thing I can say about the weekly PMO is it is oversold. Even at worst we can say it is at the bottom of a long-term price range. If it can retrace back to the top of the trading zone, that would be a 20%+ gain.
Don't forget, on Thursdays I look at reader-requested symbols, so shoot me an email at erin@decisionpoint.com. I read every email I receive and try to answer them all!
Current Market Outlook:
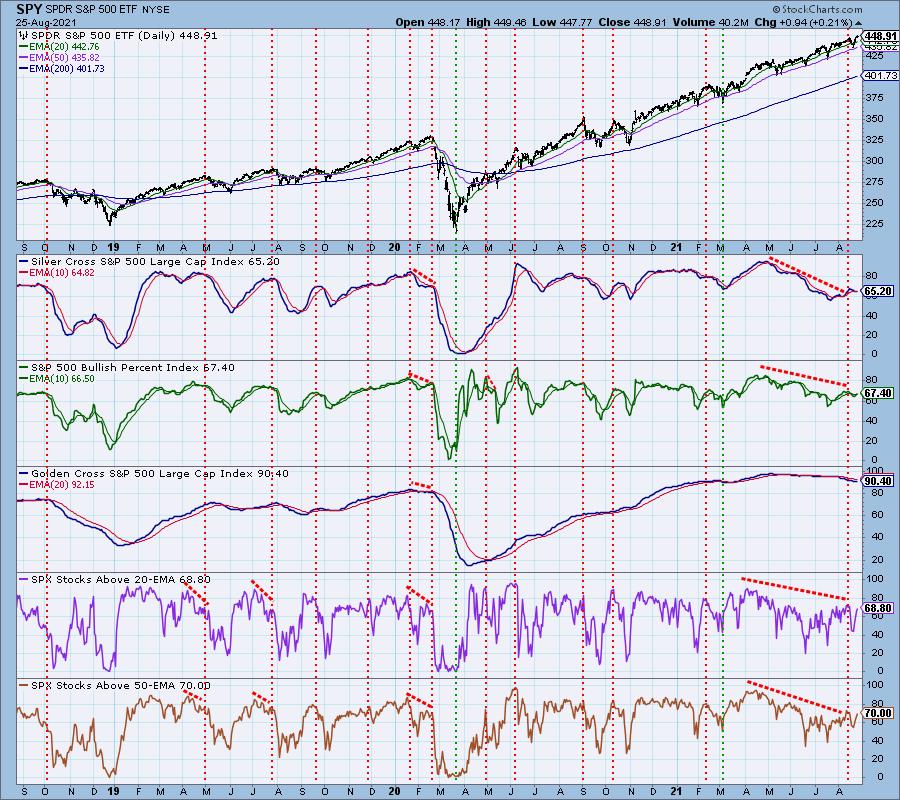
Market Environment: It is important to consider the odds for success by assessing the market tides. The following chart uses different methodologies for objectively showing the depth and trend of participation for intermediate- and long-term time frames.
- The Silver Cross Index (SCI) shows the percentage of SPX stocks on IT Trend Model BUY signals (20-EMA > 50-EMA)
- The Golden Cross Index (GCI) shows the percentage of SPX stocks on LT Trend Model BUY signals (50-EMA > 200-EMA)
- The Bullish Percent Index (BPI) shows the percentage of SPX stocks on Point & Figure BUY signals.
Don't forget that as a "Diamonds" member, you have access to our GCI/SCI curated ChartList on DecisionPoint.com. You'll find it under "Members Only" links on the left side on the Blogs and Links Page.
Here is the current chart:
Full Disclosure: I'm about 50% invested and 50% is in 'cash', meaning in money markets and readily available to trade with.
Technical Analysis is a windsock, not a crystal ball.
Happy Charting!
- Erin
erin@decisionpoint.com
Watch the latest episode of DecisionPoint with Carl & Erin Swenlin on Mondays 7:00p EST or on the DecisionPoint playlist on the StockCharts TV YouTube channel here!
NOTE: The stocks reported herein are from mechanical trading model scans that are based upon moving average relationships, momentum and volume. DecisionPoint analysis is then applied to get five selections from the scans. The selections given should prompt readers to do a chart review using their own analysis process. This letter is not a call for a specific action to buy, sell or short any of the stocks provided. There are NO sure things or guaranteed returns on the daily selection of "Diamonds in the Rough."
Helpful DecisionPoint Links:
DecisionPoint Shared ChartList and DecisionPoint Chart Gallery
Price Momentum Oscillator (PMO)
Swenlin Trading Oscillators (STO-B and STO-V)
For more links, go to DecisionPoint.com