
I only have three picks for you today. I was part of a panel on "VIX and News Even Trading" for Synergy Traders this afternoon so it cut into my writing time! It isn't too late to sign up to receive the recording. The information is below:
How to Identify Market Pivot Points with Climax Analysis
I presented at Synergy Trader's "VIX and News Event Trading" Live Training Session. I discussed how to use the VIX as part of my "climax" analysis to determine pivot points in the market. The recordings are sent to registrants so you should still be able to get it even though I already have presented. If you're interested, here's the link.
I had a lot of requests that looked interesting. I wanted to look at three different reader's requests but the "short list" has some very interesting set-ups that you might want to review. For readers who gave me multiple requests: I may not have listed them in the "short list" as it would make the list NOT 'short'. Just know that I think all of your picks were quality.
I will tell you that we had an Upside Exhaustion Climax today, so the market could tip over or churn for the next few days so keep that in mind before you expand your exposure too much.
Today's "Diamonds in the Rough" are: AMAT, METC and QUAD.
"Short List" (no order): ARCH, BYD, CEIX, DRVN, EPR, RTX, LYV, APA and SQ.

RECORDING LINK Friday (9/17):
Topic: DecisionPoint Diamond Mine (9/17/2021) LIVE Trading Room
Start Time : Sep 17, 2021 09:00 AM
Meeting Recording Link.
Access Passcode: Sept/17th
REGISTRATION FOR FRIDAY 9/24 Diamond Mine:
When: Sep 24, 2021 09:00 AM Pacific Time (US and Canada)
Topic: DecisionPoint Diamond Mine (9/24/2021) LIVE Trading Room
Register in advance for this webinar HERE.
Save the registration confirmation email with login instructions in case Zoom doesn't notify you in time.

Free DP Trading Room (9/13) RECORDING LINK:
Topic: DecisionPoint Trading Room
Start Time : Sep 13, 2021 09:01 AM
Meeting Recording LINK.
Access Passcode: Sept/13th
For best results, copy and paste the access code to avoid typos.
Welcome to DecisionPoint Daily Diamonds, wherein I highlight five "Diamonds in the Rough." These are selected from the results of my DecisionPoint scans, which search for stocks that could benefit from the trend and condition of the market. Remember, these are not recommendations to buy or sell, but are the most interesting of the stocks that surfaced in my scans. My objective is to save you the work of the initial, tedious culling process, but you need to apply your own analysis to see if these stocks pique your interest as well. There are no guaranteed winners here!
Applied Materials, Inc. (AMAT)
EARNINGS: 11/18/2021 (AMC)
Applied Materials, Inc. engages in the provision of materials engineering solutions used to produce new chip and advanced display. It operates through the following segments: Semiconductor Systems, Applied Global Services, and Display and Adjacent Markets. The Semiconductor Systems segment includes semiconductor capital equipment for deposition, etch, ion implantation, rapid thermal processing, chemical mechanical planarization, metrology and inspection, and wafer level packaging. The Applied Global Services segment provides solutions to optimize equipment, performance, and productivity. The Display and Adjacent Markets segment offers products for manufacturing liquid crystal displays, organic light-emitting diodes; coating systems and display technologies for television; personal computers, tablets, smart phones, and consumer-oriented devices. The company was founded on November 10, 1967 and is headquartered in Santa Clara, CA.
Predefined Scans Triggered: Elder Bar Turned Green and New CCI Buy Signals.
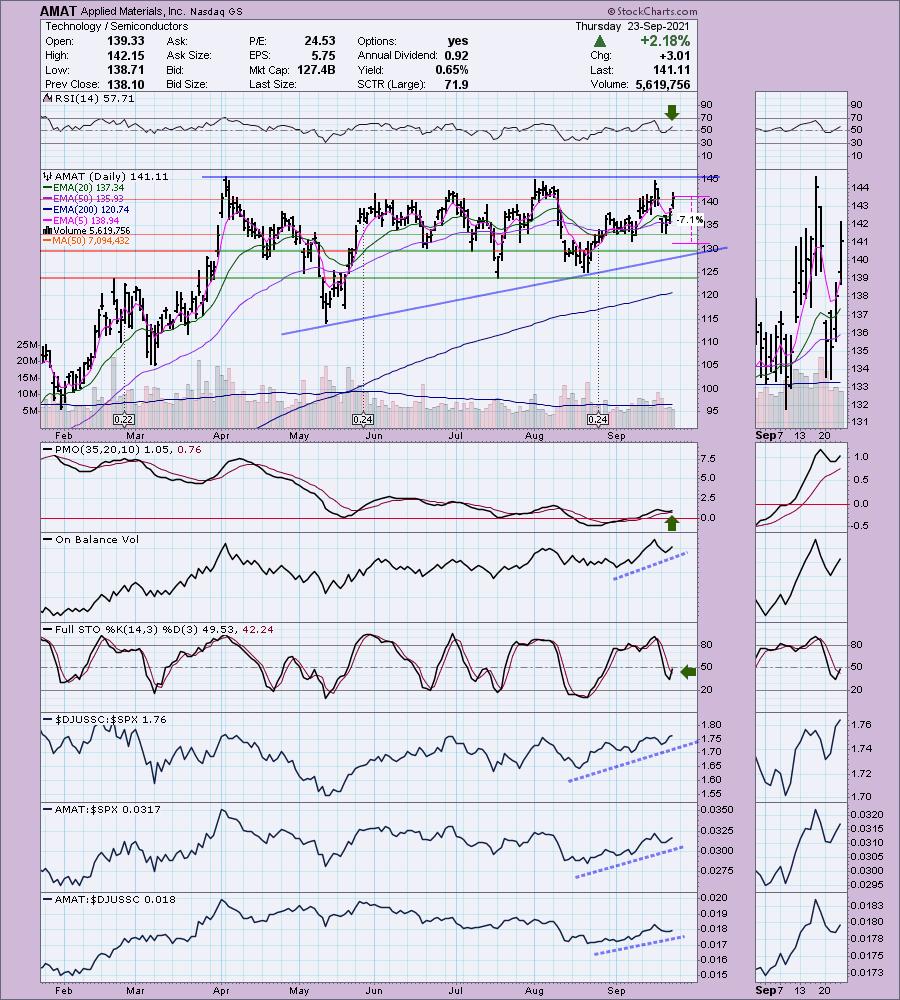
AMAT is down -0.07% in after hours trading. This reader sent me some interesting reading material to go along with his request. Apparently AMAT is boosting output of silicon carbide chips for electric vehicles. It is a way for them to alleviate the current chip shortage. The chart looks good. My only dislike is it is in a trading range and price is nearing the top of the range. However, there is a large textbook bullish ascending triangle that suggests we will get a breakout eventually. The RSI is positive and the PMO has a bottom above its signal line that I found especially bullish. Stochastics just had a positive crossover in somewhat oversold territory. Relative strength is trending up for the industry group as well as for AMAT within the group and against the SPX. The stop is set at about 7%.
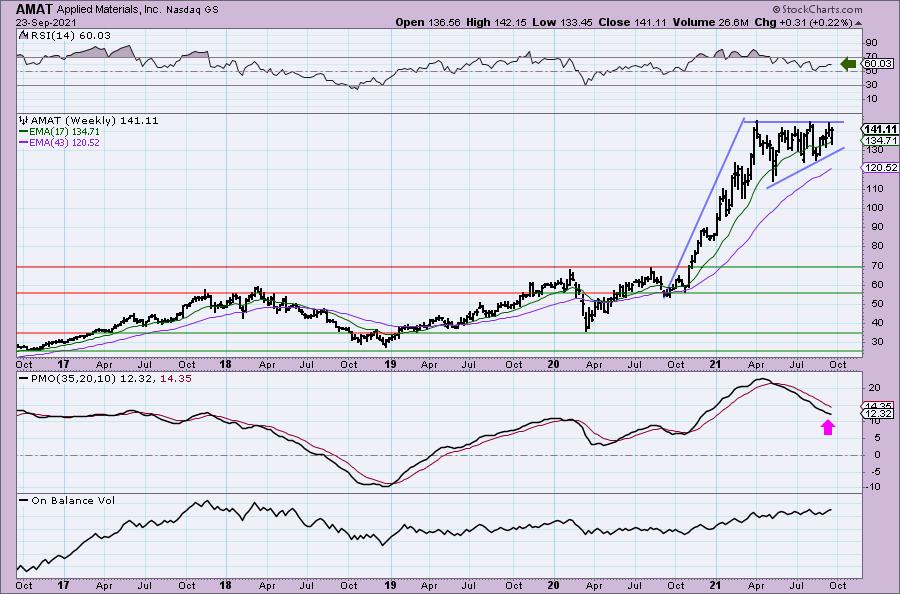
The ascending triangle is very easy to see on the weekly chart. We also have a flagpole that is attached to this bullish pattern. The weekly RSI is positive. The weekly PMO isn't good as it hasn't turned up yet.
Ramaco Resources, Inc. (METC)
EARNINGS: 11/2/2021 (AMC)
Ramaco Resources, Inc. engages in the operation and development of coal mining properties. The firm deals with metallurgical coal in central and southern West Virginia, southwestern Virginia and southwestern Pennsylvania. Its portfolio consists of Elk Creek, Berwind, RAM Mine, and Knox Creek. The company was founded by Randall W. Atkins in August 2015 and is headquartered in Lexington, KY.
Predefined Scans Triggered: None.
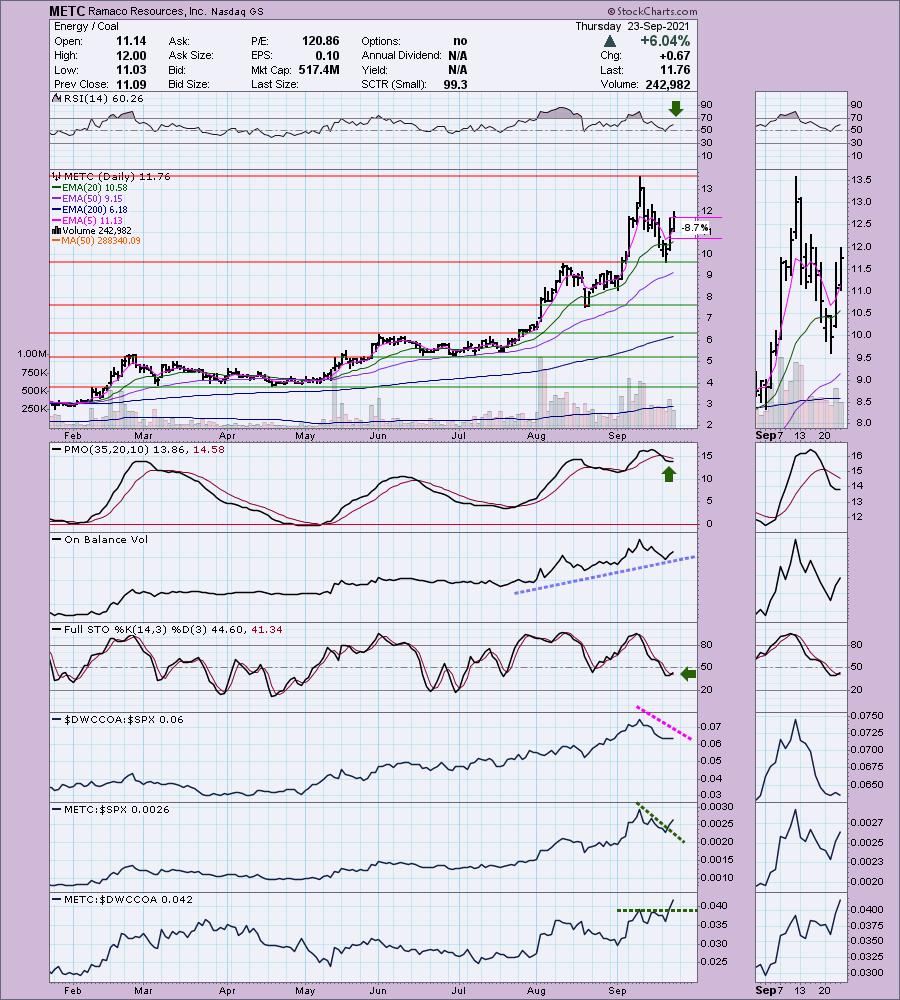
METC is unchanged in after hours trading. Apparently when I mentioned it yesterday as part of the short list, I definitely should've made it a pick given today's more than 6% rally. Coal pulled back strongly, but is recovering just as strongly. Of the coal charts that subscribers sent, I liked METC because the PMO has turned up, unlike the others. However, I think the other coal stocks are interesting. All them are showing new Stochastics positive crossovers. This stock is low-priced so be sure to position size wisely. The group has been underperforming, but it is now beginning to perform with the SPX given the flat relative strength line. METC is beginning to outperform as it has broken declining trends in relative strength. The OBV is confirming the price rise. The stop is difficult to set given today's huge upside move. I have it set at the 20-EMA.
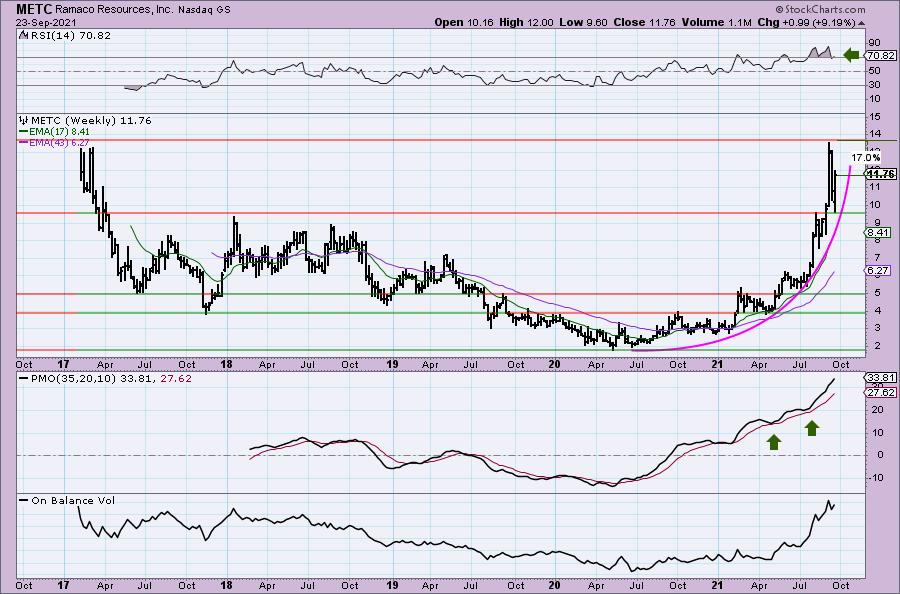
The weekly chart is good given the strongly rising PMO and positive RSI. However, both are very overbought. Additionally we have a parabolic advance. These typically end badly very quickly so set a trailing stop or at least some sort of hard stop. You don't want to get caught up in a major breakdown. If price can reach prior highs that would be a healthy 17% gain, but it certainly could run higher.
Quad Graphics Inc. (QUAD)
EARNINGS: 11/2/2021 (AMC)
Quad/Graphics, Inc. engages in the provision of print solutions, media solutions, and logistics services. It operates through the following segments: United States Print and Related Services, International, and Corporate. The United States Print and Related Services segment involves in printing operations and its products include catalogs, consumer magazines, special insert publications, direct mail, packaging, commercial, and printed products, retail inserts books, and directories. The International segment offers printed products and services. The Corporate segment consists of unallocated general and administrative activities and associated expenses, including in part, executive, legal, finance, information technology, and human resources. The firm's solutions include marketing strategy, creative solutions, print, media, in-store, packaging and marketing management. The company was founded by Harry V. Quadracci and Thomas A. Quadracci on July 13, 1971 and is headquartered in Sussex, WI.
Predefined Scans Triggered: Moved Above Upper Bollinger Band, Moved Above Ichimoku Cloud and P&F High Pole.
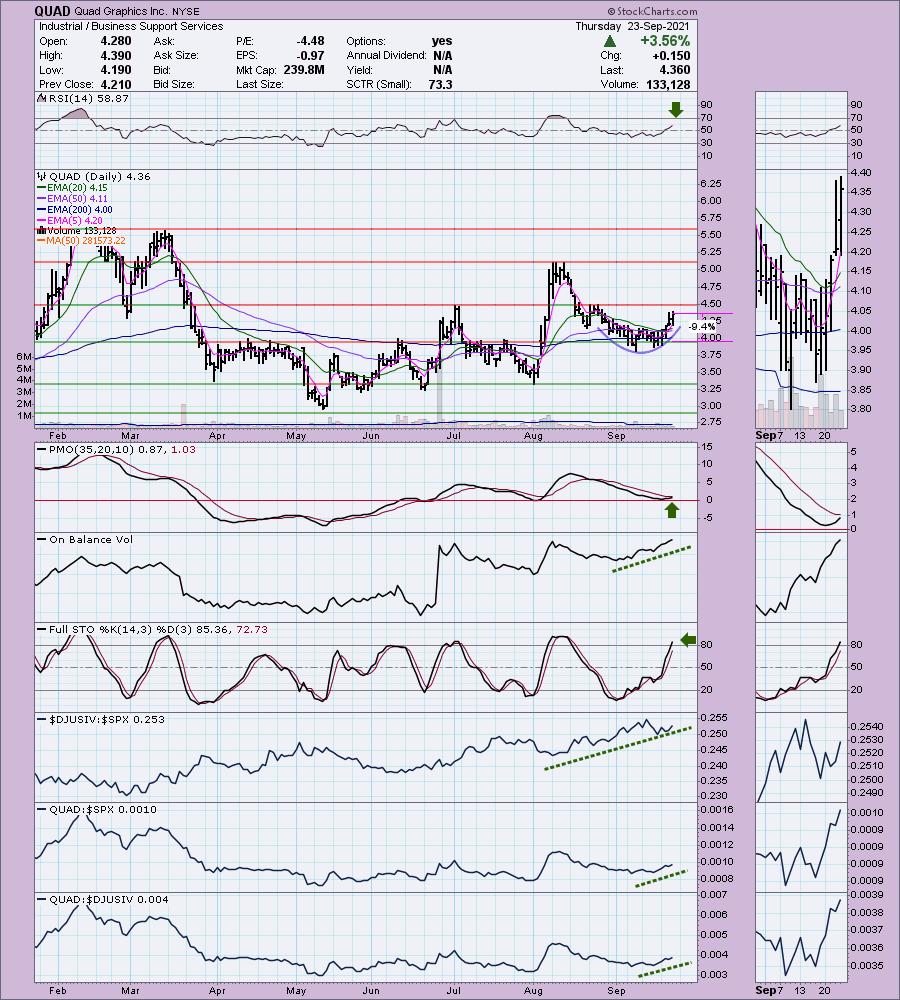
QUAD is unchanged in after hours trading. This is a low-priced stock with skimpy volume, so position size wisely. I really like the saucer shaped bottom that is accompanied by a scooping PMO bottom just above the zero line. The RSI is positive and not overbought. The OBV was trending higher as it bottomed, so volume has been coming in as it bottomed. Stochastics are rising but are a touch overbought. Relative strength is strong. The stop is set rather deeply below the 200-EMA. Depending on where you are able to get in, that could shrink.
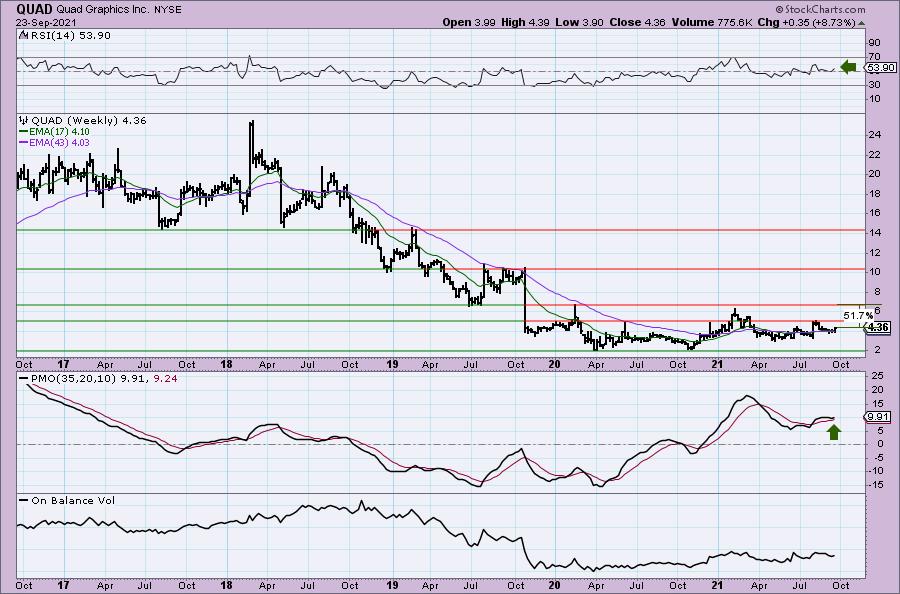
The weekly chart was surprising. It was trading far higher than this and began to slide in 2018 into the bear market low. It hasn't done much, but given the low price the percentage changes have been crazy. That becomes apparent when you see that it would be a 50% gain should it get back to its 2021 high. The weekly PMO is bottoming above the signal line and the weekly RSI is positive and rising.
Don't forget, on Thursdays I look at reader-requested symbols, so shoot me an email at erin@decisionpoint.com. I read every email I receive and try to answer them all!
Current Market Outlook:
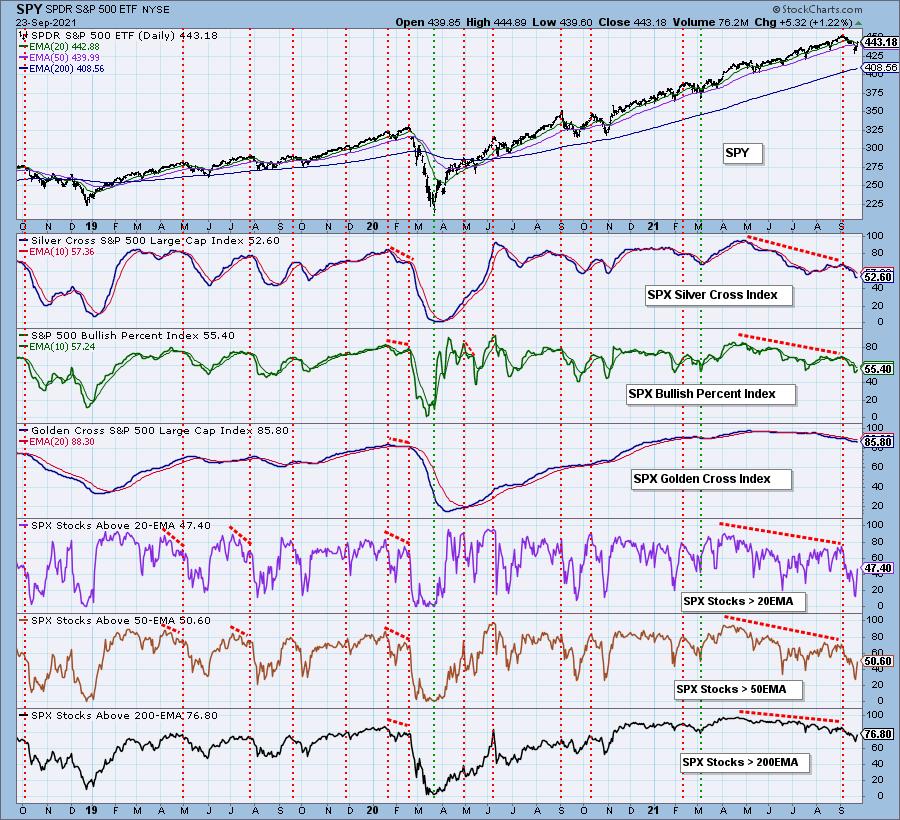
Market Environment: It is important to consider the odds for success by assessing the market tides. The following chart uses different methodologies for objectively showing the depth and trend of participation for intermediate- and long-term time frames.
- The Silver Cross Index (SCI) shows the percentage of SPX stocks on IT Trend Model BUY signals (20-EMA > 50-EMA)
- The Golden Cross Index (GCI) shows the percentage of SPX stocks on LT Trend Model BUY signals (50-EMA > 200-EMA)
- The Bullish Percent Index (BPI) shows the percentage of SPX stocks on Point & Figure BUY signals.
Don't forget that as a "Diamonds" member, you have access to our GCI/SCI curated ChartList on DecisionPoint.com. You'll find it under "Members Only" links on the left side on the Blogs and Links Page.
Here is the current chart:
Full Disclosure: I'm about 70% invested and 30% is in 'cash', meaning in money markets and readily available to trade with. Stops are set on nearly every position.
Technical Analysis is a windsock, not a crystal ball.
Happy Charting!
- Erin
erin@decisionpoint.com
Watch the latest episode of DecisionPoint with Carl & Erin Swenlin on Mondays 7:00p EST or on the DecisionPoint playlist on the StockCharts TV YouTube channel here!
NOTE: The stocks reported herein are from mechanical trading model scans that are based upon moving average relationships, momentum and volume. DecisionPoint analysis is then applied to get five selections from the scans. The selections given should prompt readers to do a chart review using their own analysis process. This letter is not a call for a specific action to buy, sell or short any of the stocks provided. There are NO sure things or guaranteed returns on the daily selection of "Diamonds in the Rough."
Helpful DecisionPoint Links:
DecisionPoint Shared ChartList and DecisionPoint Chart Gallery
Price Momentum Oscillator (PMO)
Swenlin Trading Oscillators (STO-B and STO-V)
For more links, go to DecisionPoint.comd