
Reader Requests arrived in all kinds of industry groups! I had a tough time deciding which to present. I did end up adding two of my own from an industry group that looks really interesting right now. Believe it or not it is in the Consumer Discretionary (XLY) sector and it has nothing to do with travel and eating.
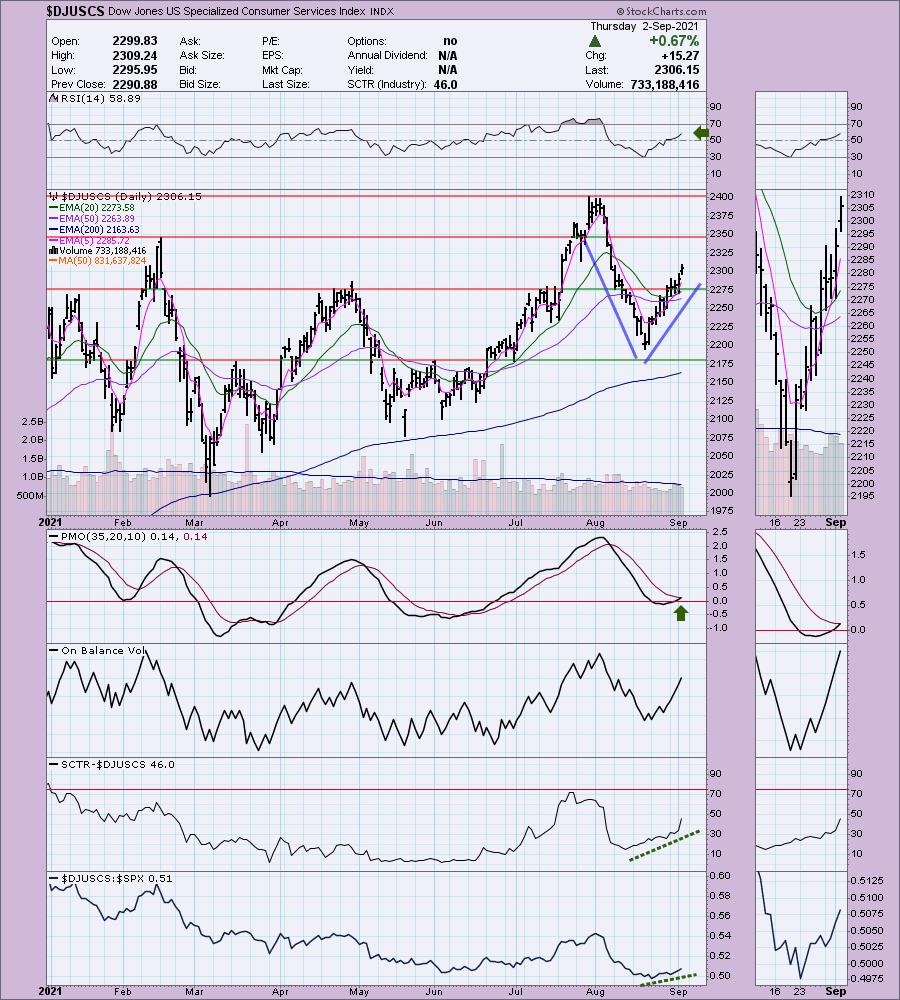
Right now the Specialized Consumer Services ($DJUSCS) is running higher but has plenty of room before it hits overhead resistance. I'll include the chart as well as my picks from that area further down in the report.
The Diamond Mine will be open tomorrow at Noon ET! Also, I have Julius de Kempanear (Mr. RRG) joining me in the free DP Trading room on Tuesday (September 6th). Since Monday is a holiday, I moved the trading room to Tuesday. Submit your symbols EARLY and we will have it entered in an RRG to begin the trading room!
Have a great holiday weekend!
Today's "Diamonds in the Rough" are: BABA, BEAM, KAR, MATW and NOG.
"Stocks to Review" from my short list are: BRIX, AA, SCI, HRB, CHGG, ZVO, ENLC, KLIC, NVAX, PAVM and OXY.

No Recording on 8/27 due to illness.
RECORDING LINK Friday (8/20):
Topic: DecisionPoint Diamond Mine (8/20/2021) LIVE Trading Room
Start Time : Aug 20, 2021 08:58 AM
Meeting Recording Link HERE.
Access Passcode: August/20th
REGISTRATION FOR FRIDAY 9/3 Diamond Mine:
When: Sep 3, 2021 09:00 AM Pacific Time (US and Canada)
Topic: DecisionPoint Diamond Mine (09/03/2021) LIVE Trading Room
Register in advance for this webinar HERE.
Save the registration confirmation email with login instructions in case Zoom doesn't notify you in time.

Free DP Trading Room (8/30) RECORDING LINK:
Topic: DecisionPoint Trading Room
Start Time : Aug 30, 2021 08:57 AM
Meeting Recording Link.
Access Passcode: August-30th
For best results, copy and paste the access code to avoid typos.
Welcome to DecisionPoint Daily Diamonds, wherein I highlight five "Diamonds in the Rough." These are selected from the results of my DecisionPoint scans, which search for stocks that could benefit from the trend and condition of the market. Remember, these are not recommendations to buy or sell, but are the most interesting of the stocks that surfaced in my scans. My objective is to save you the work of the initial, tedious culling process, but you need to apply your own analysis to see if these stocks pique your interest as well. There are no guaranteed winners here!
Before we look at the stocks, here is a snapshot of the Special Consumer Services (DJUSCS) industry group. You'll not find a much more bullish chart than this. We have a "V" bottom bullish pattern. Once it retraced 1/3rd of the decline, it executed and gives us an expectation that price will overcome resistance at the August top. The RSI is now in positive territory and the PMO is in the process of giving us a crossover BUY signal. After seeing this chart, I scoured the stocks within the group and came up with KAR and MATW.
Alibaba Group Holding Ltd. (BABA)
EARNINGS: 11/4/2021 (BMO)
Alibaba Group Holding Ltd. engages in providing online and mobile marketplaces in retail and wholesale trade. It operates through the following business segments: Core Commerce; Cloud Computing; Digital Media & Entertainment; and Innovation Initiatives and Others. The Core Commerce segment comprises of platforms operating in retail and wholesale. The Cloud Computing segment consists of Alibaba Cloud, which offers elastic computing, database, storage and content delivery network, large scale computing, security, management and application, big data analytics, a machine learning platform, and other services provide for enterprises of different sizes across various industries. The Digital Media & Entertainment segment relates to the Youko Tudou and UC Browser business. The Innovation Initiatives and Others segment includes businesses such as AutoNavi, DingTalk, Tmall Genie, and others. The company was founded by Chung Tsai and Yun Ma on June 28, 1999 and is headquartered in Hangzhou, China.
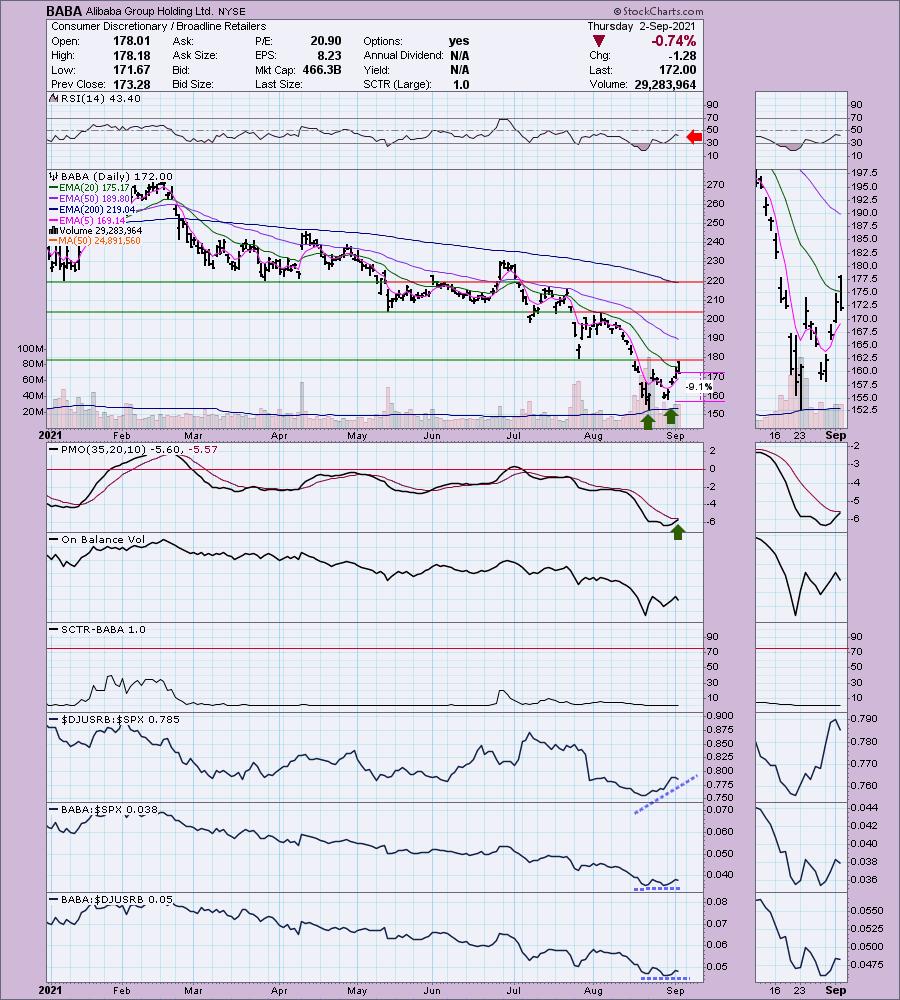
BABA is currently down -0.03% in after hours trading. I covered BABA as a reader request in the October 8th 2020 Diamonds Report. The position gained a few percentage points but triggered the 5.8% stop in November.
This one has been in the news and I've seen articles written in support of and against buying this stock. I felt it needed to be covered so you could see it through my dispassionate lens. The problem for BABA is the recent crack down by the Chinese government on China-based companies. It fell out of favor and was beaten down heavily. Now the chart is beginning to look technically interesting. There is a bullish double-bottom that technically executed on today's intraday high; however, price fell back below the 20-EMA and the confirmation line. The RSI had been rising out of oversold territory, but it ticked down today. The PMO is nearing a crossover BUY signal and the OBV bottoms are rising with price bottoms. Relative performance is okay. Overall I see this as a possible BUY but it comes with a lot of risk right now. I would want to see a breakout sustained above both the confirmation line and overhead resistance at the July low.
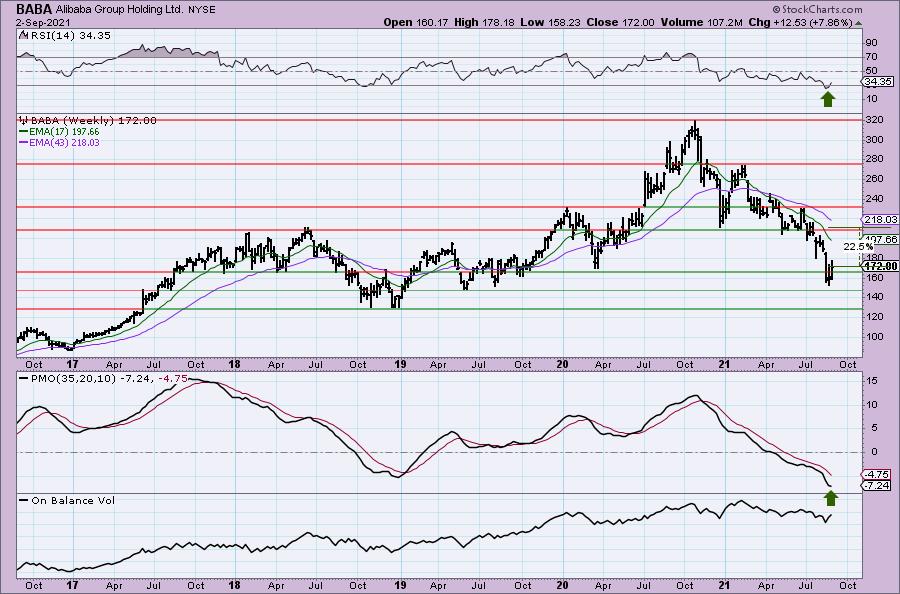
The weekly chart is interesting. The RSI is negative, but it is rising out of oversold territory. The weekly PMO is turning back up after price bounced off support at the 2019 lows. Even if it can just regain overhead resistance at the late 2020 low, that would be an upside move of over 22%.
Beam Therapeutics Inc (BEAM)
EARNINGS: 11/9/2021 (BMO)
Beam Therapeutics, Inc. develops and commercializes DNA base editing technologies for the treatment of human disease. Its licensed technology platform, which includes access to base editing technologies and associated technologies that enhance the scope of base editing. The company was founded by David R. Liu, Feng Zhang, Alexis Komor, Nicole Gaudelli, and J. Keith Joung on January 25, 2017 and is headquartered in Cambridge, MA.
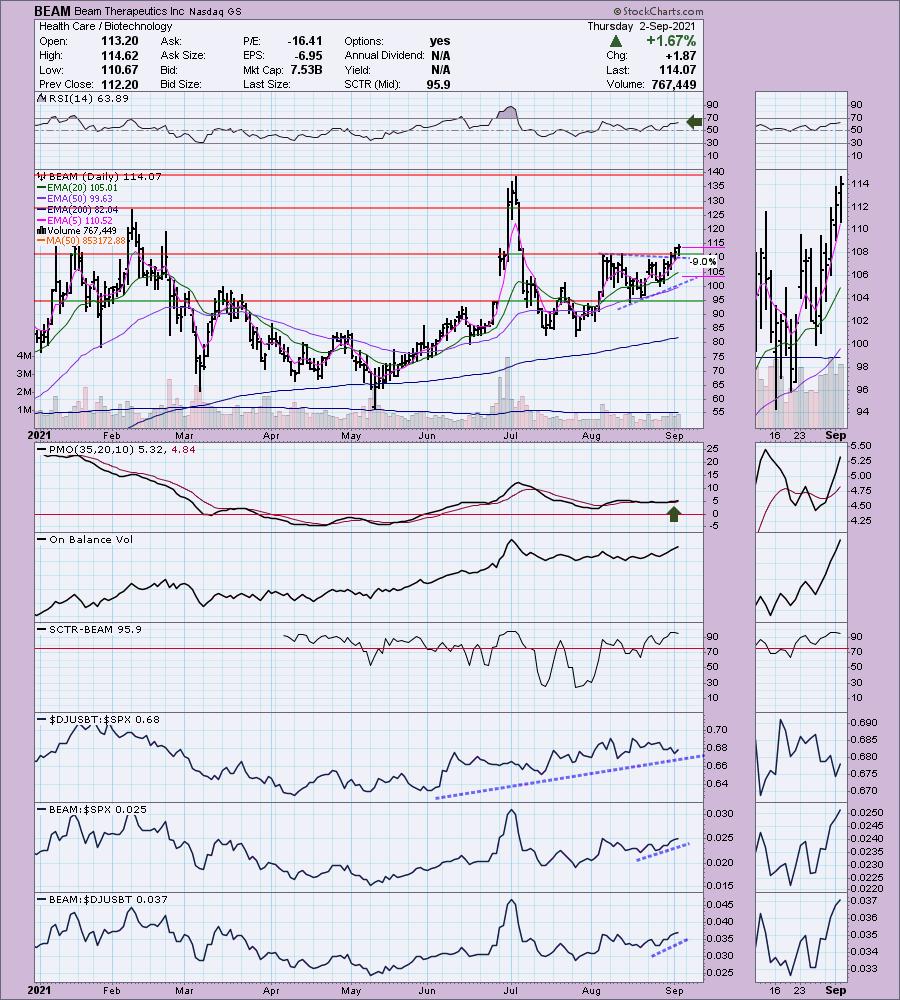
BEAM is down slightly at -0.01% in after hours trading. I like today's breakout from a symmetrical triangle or ascending triangle (however you want to look at, both pattens are bullish). The PMO is back on a crossover BUY signal and the RSI is positive and not overbought. The OBV is rising in concert with price and the SCTR is firmly in the "hot zone" above 75 (meaning it is in the upper quadrant of all mid-cap stocks). While in the short term Biotechs haven't been outperforming, in the intermediate term, they have. BEAM is a winner against the SPX and its group. The stop is set at 9%, aligning it closely with the mid-July top.
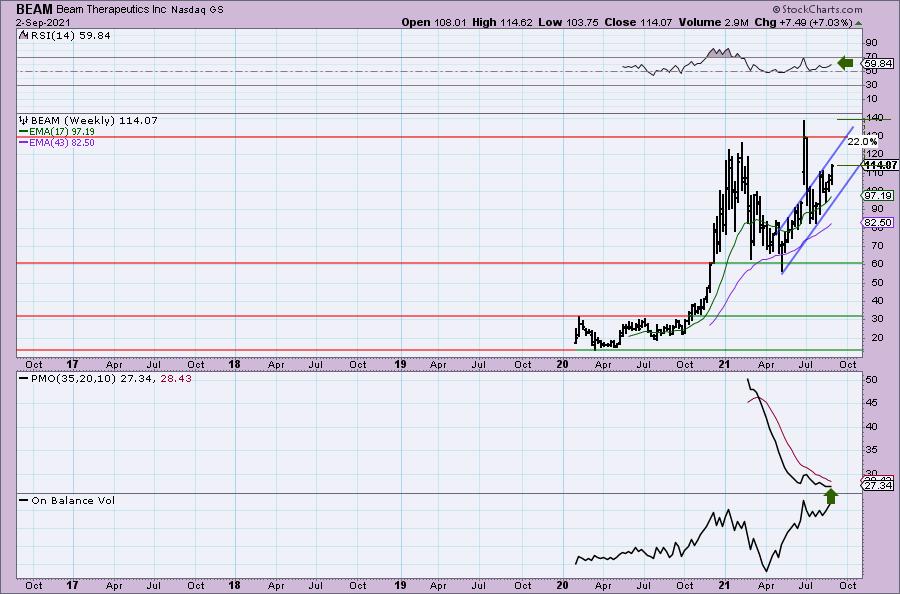
The weekly chart sports a rising trend channel and a PMO that is trying to bottom. The RSI is positive. A test of the all-time high would bring a 22% gain.
KAR Auction Services Inc. (KAR)
EARNINGS: 11/2/2021 (AMC)
KAR Auction Services, Inc. engages in the provision of used car auction services and salvage auction services in North America and the United Kingdom. It operates through the following segments: ADESA Auctions and Automotive Finance Corporation (AFC). The ADESA segment provides whole car auctions and related services to the vehicle remarketing industry in North America. The AFC segment provides floor plan financing to used vehicle dealers. The company was founded on November 9, 2006 and is headquartered in Carmel, IN.
KAR is down -0.79% in after hours trading. I covered KAR in the March 11th 2021 Diamonds Report. It was a beat down pick and I knew it might struggle at gap resistance. It did. It failed to close the gap and turned down at the 50-EMA which was definitely the signal to sell. The 8.2% stop was subsequently hit.
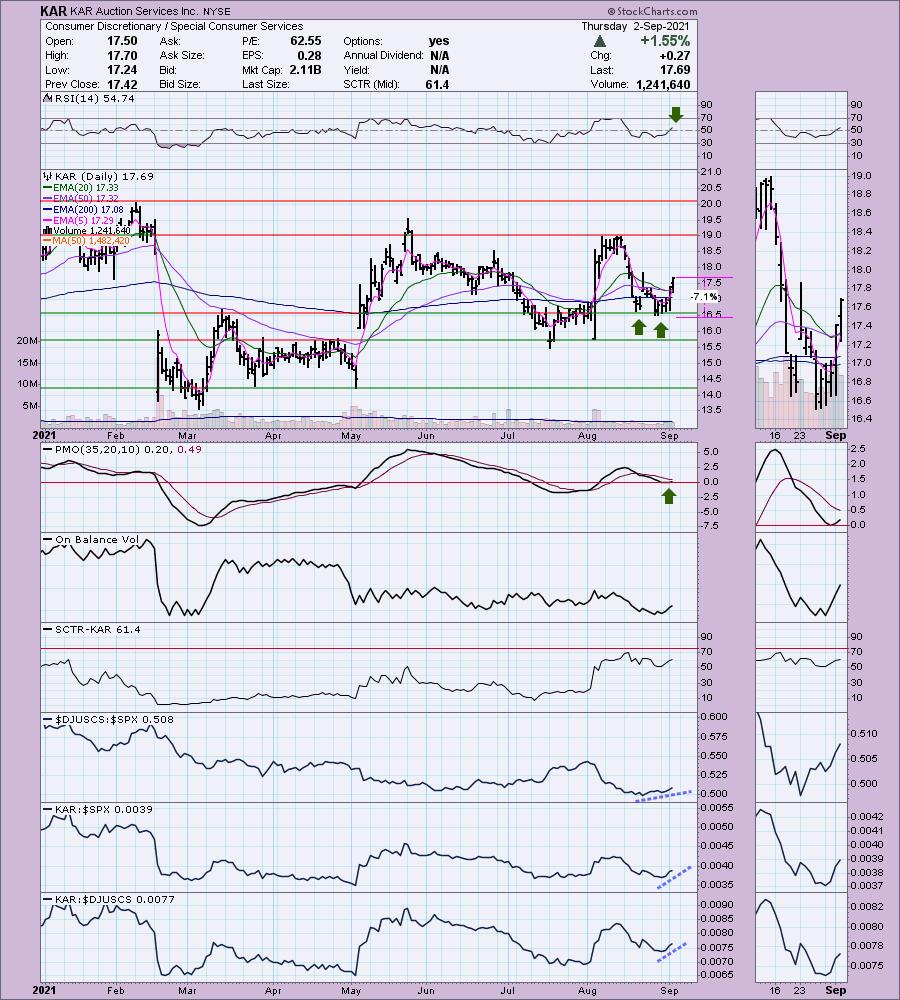
I like the double-bottom pattern and the positive crossovers that occurred with the 20/50-EMAs (a "silver cross"). The PMO turned up right above the zero line. The RSI is just reaching positive territory. This is from the Special Consumer Services industry group I mentioned earlier in the report. You can see the improvement in relative performance across the board. The stop is set at 7.1% just below support.
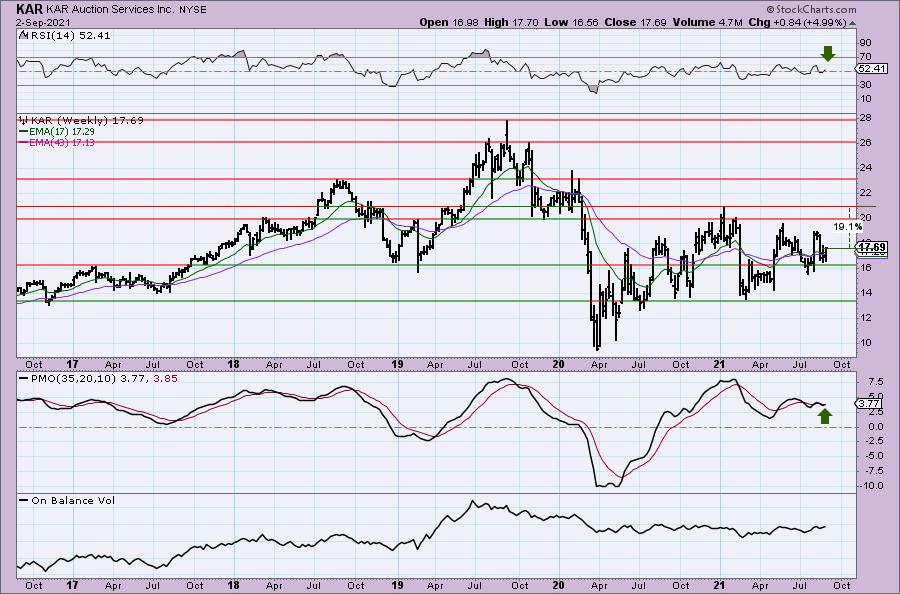
The weekly charts shows price in a large trading range. It is midway through it, so while we missed some of the price rise, there is still enough to get us an over 19% gain if it reaches the top of the range. The weekly PMO has turned back up and the RSI turned up out of neutral territory.
Matthews International Corporation (MATW)
EARNINGS: 10/26/2021 (AMC)
Matthews International Corp. engages in the provision of brand solutions, memorialization products, and industrial technologies. It operates through the following segments: SGK Brand Solutions, Memorialization, and Industrial Technologies. The SGK Brand Solutions segment consists of brand management, pre-media services, printing plates and cylinders, engineered products, imaging services, digital asset management, merchandising display systems, and marketing and design services for consumer goods and retail industries. The Memorialization segment consists of bronze and granite memorials, and other memorialization products, caskets and cremation and incineration equipment for cemetery and funeral home industries. The Industrial Technologies segment includes marking and coding equipment and consumables, industrial automation products and order fulfillment systems for identifying, tracking, picking and conveying consumer, and industrial products. The company was founded by John Dixon Matthews in 1850 and is headquartered in Pittsburgh, PA.
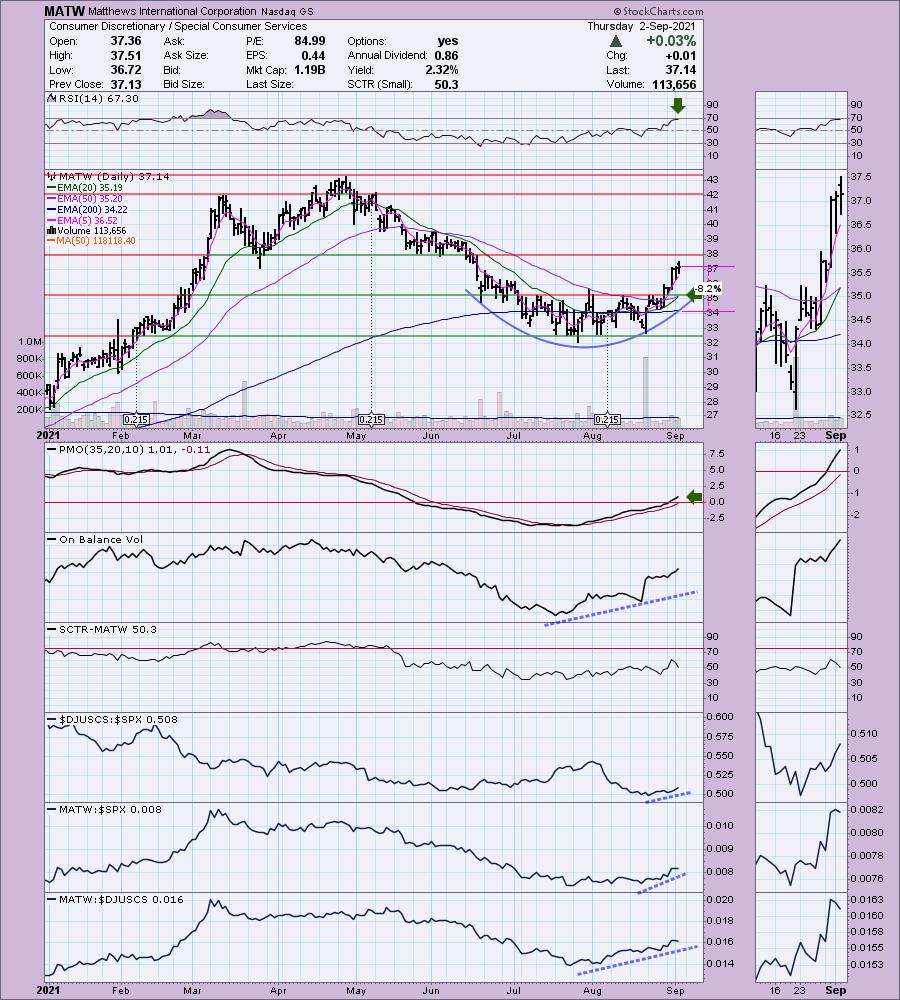
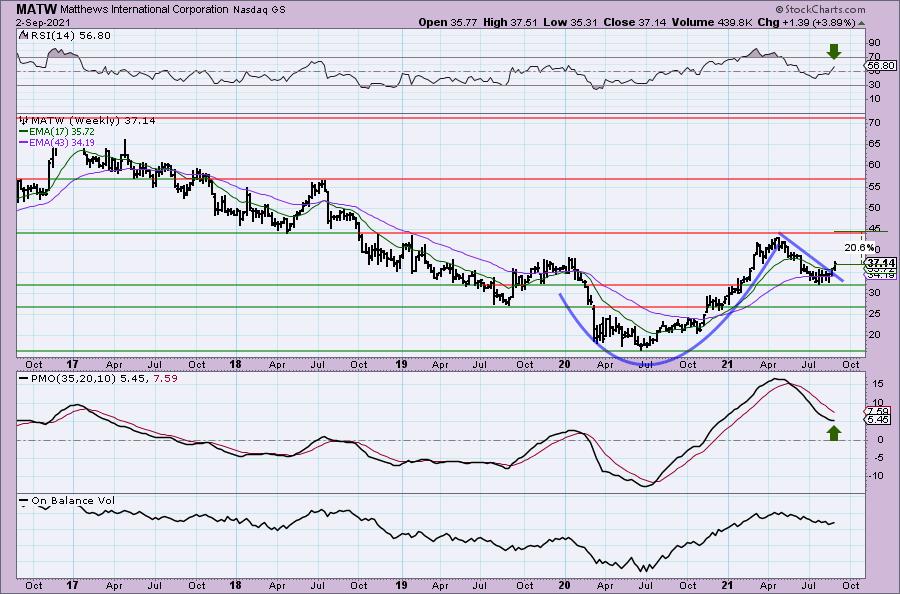
MATW is unchanged in after hours trading. This chart is very bullish for a number of reasons. The price pattern is a cup shaped basing pattern. Price broke above key moving averages this past week and is headed toward a test of overhead resistance at $38. We could see a pullback there to form a handle on this saucer, but it isn't a given. The RSI is positive and not yet overbought. The PMO just hit positive territory after a clean upside crossover. The OBV has a positive divergence with the almost flat price bottoms. The SCTR could use some help, but relative strength looks very good. I've set the stop at the 200-EMA.
Speaking of saucers and cups. There is a clear cup with handle bullish pattern on the weekly chart that just executed with this week's breakout. The weekly RSI is in positive territory and the PMO is bottoming. Upside potential is over 20% if it makes it back to the beginning of the handle.
Northern Oil and Gas, Inc. (NOG)
EARNINGS: 11/5/2021 (BMO)
Northern Oil & Gas, Inc. engages in the acquisition, exploration, development, and production of crude oil and natural gas properties. It focuses on the Bakken and Three Forks formation within the Williston Basin in North Dakota and Montana. The company was founded on March 20, 2007 and is headquartered in Minnetonka, MN.
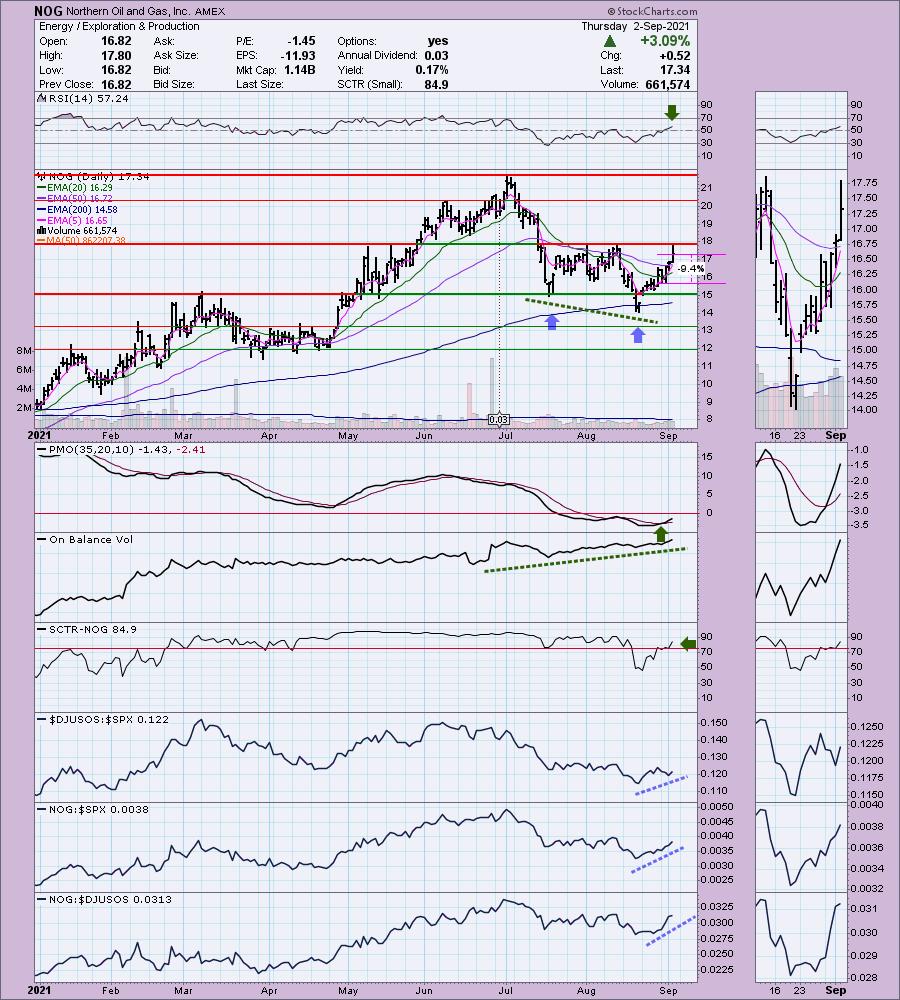
NOG is up +0.06% in after hours trading. The Energy sector has been steadily improving and that will help NOG. We don't have the price breakout yet, but given today's strong move, I believe it will. The RSI is now in positive territory. There is a bullish double-bottom and a positive OBV divergence leading into this rally. The PMO is on a crossover BUY signal. The SCTR has just hit the "hot zone" above 75 and relative performance is continuing to improve. The stop is rather deep at 9.4%. It is aligned with the early August bottom.
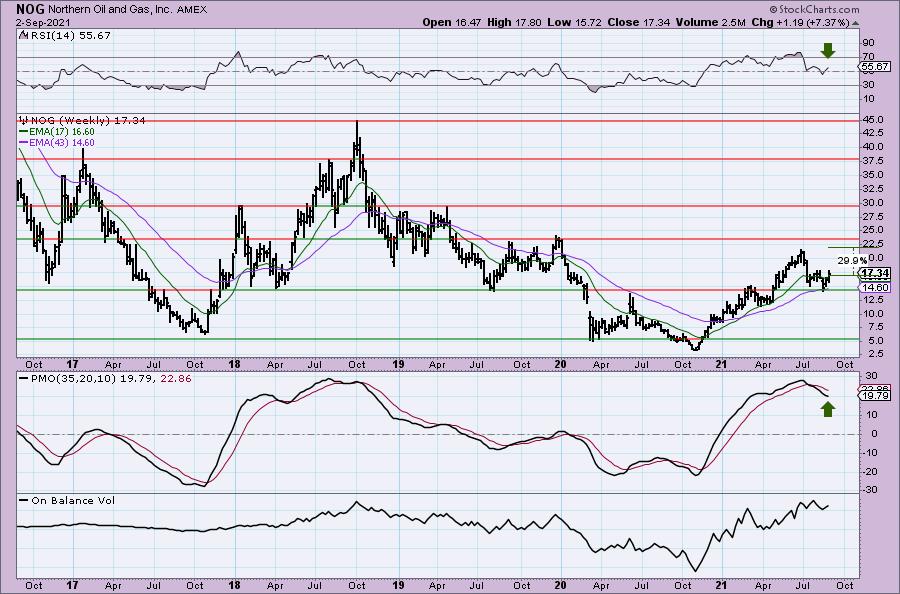
The weekly chart is improving with the weekly RSI moving back into positive territory and the weekly PMO decelerating for a possible bottom. If price can make it to this year's high, that would be an almost 30% gain.
Don't forget, on Thursdays I look at reader-requested symbols, so shoot me an email at erin@decisionpoint.com. I read every email I receive and try to answer them all!
Current Market Outlook:
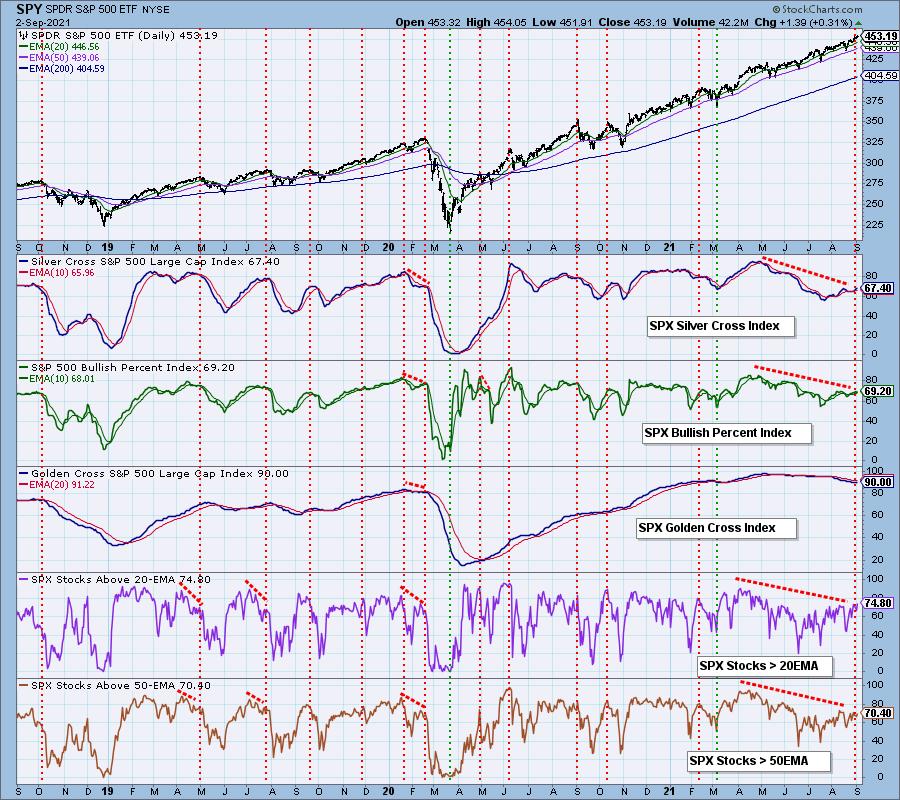
Market Environment: It is important to consider the odds for success by assessing the market tides. The following chart uses different methodologies for objectively showing the depth and trend of participation for intermediate- and long-term time frames.
- The Silver Cross Index (SCI) shows the percentage of SPX stocks on IT Trend Model BUY signals (20-EMA > 50-EMA)
- The Golden Cross Index (GCI) shows the percentage of SPX stocks on LT Trend Model BUY signals (50-EMA > 200-EMA)
- The Bullish Percent Index (BPI) shows the percentage of SPX stocks on Point & Figure BUY signals.
Don't forget that as a "Diamonds" member, you have access to our GCI/SCI curated ChartList on DecisionPoint.com. You'll find it under "Members Only" links on the left side on the Blogs and Links Page.
Here is the current chart:
Full Disclosure: I'm about 70% invested and 30% is in 'cash', meaning in money markets and readily available to trade with.
Technical Analysis is a windsock, not a crystal ball.
Happy Charting!
- Erin
erin@decisionpoint.com
Watch the latest episode of DecisionPoint with Carl & Erin Swenlin on Mondays 7:00p EST or on the DecisionPoint playlist on the StockCharts TV YouTube channel here!
NOTE: The stocks reported herein are from mechanical trading model scans that are based upon moving average relationships, momentum and volume. DecisionPoint analysis is then applied to get five selections from the scans. The selections given should prompt readers to do a chart review using their own analysis process. This letter is not a call for a specific action to buy, sell or short any of the stocks provided. There are NO sure things or guaranteed returns on the daily selection of "Diamonds in the Rough."
Helpful DecisionPoint Links:
DecisionPoint Shared ChartList and DecisionPoint Chart Gallery
Price Momentum Oscillator (PMO)
Swenlin Trading Oscillators (STO-B and STO-V)
For more links, go to DecisionPoint.com