
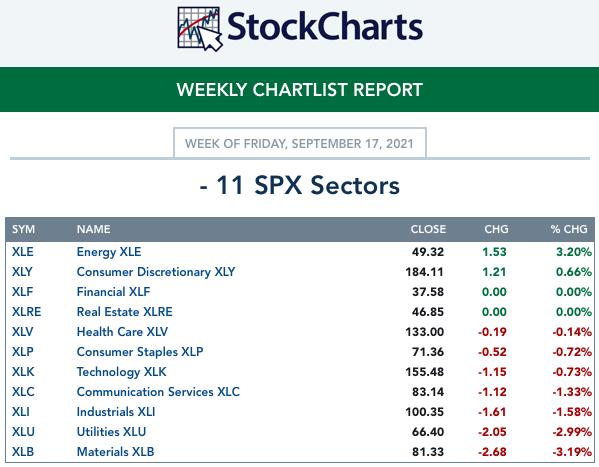
The Energy sector was on fire this week, outpacing all of the other sectors. It was up a whopping +3.2% while the closest runner-up, Consumer Discretionary (XLY) was up +0.66%. Speaking of these sectors, their chart and "under the hood" indicators suggest we will see a continuation of this week's rallies.
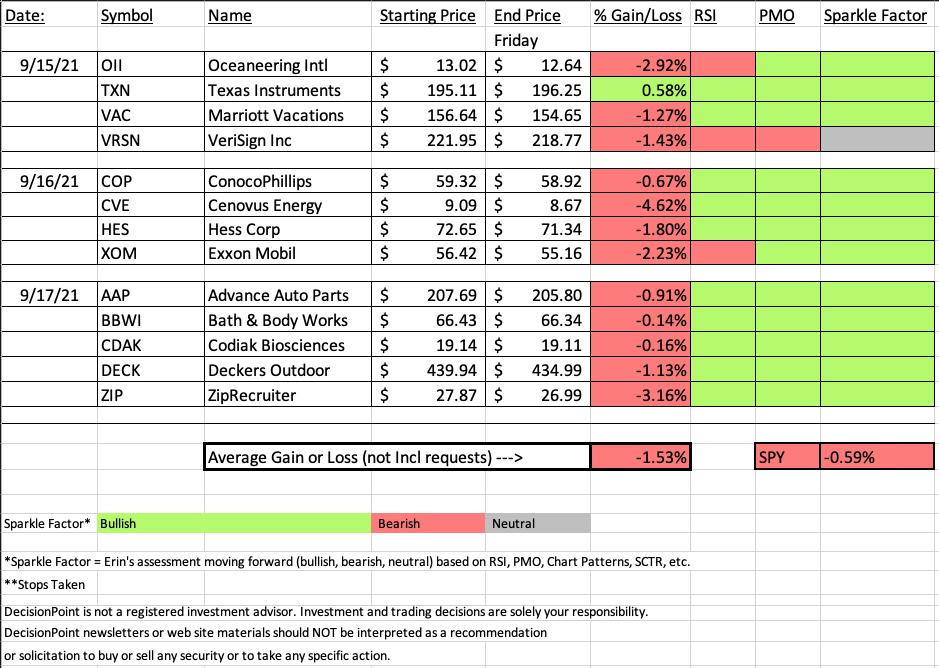
After the big rally in Energy stocks on Wednesday, it shouldn't have been a surprise that you would see my "Diamonds in the Rough" come from that sector. On the flip side, they picks came in after very big rally pops so consequently on the pullbacks of yesterday and today, they lost ground on the Recap spreadsheet.
You'll notice on today's spreadsheet that "Sparkle Factors" going forward are all 'green', meaning I think the charts are still bullish enough for a hold or possible entry on these pullbacks.
The "Darling" of the week is the only position that finished in the green this week, Texas Instruments (TXN). Full disclosure, I own this stock.
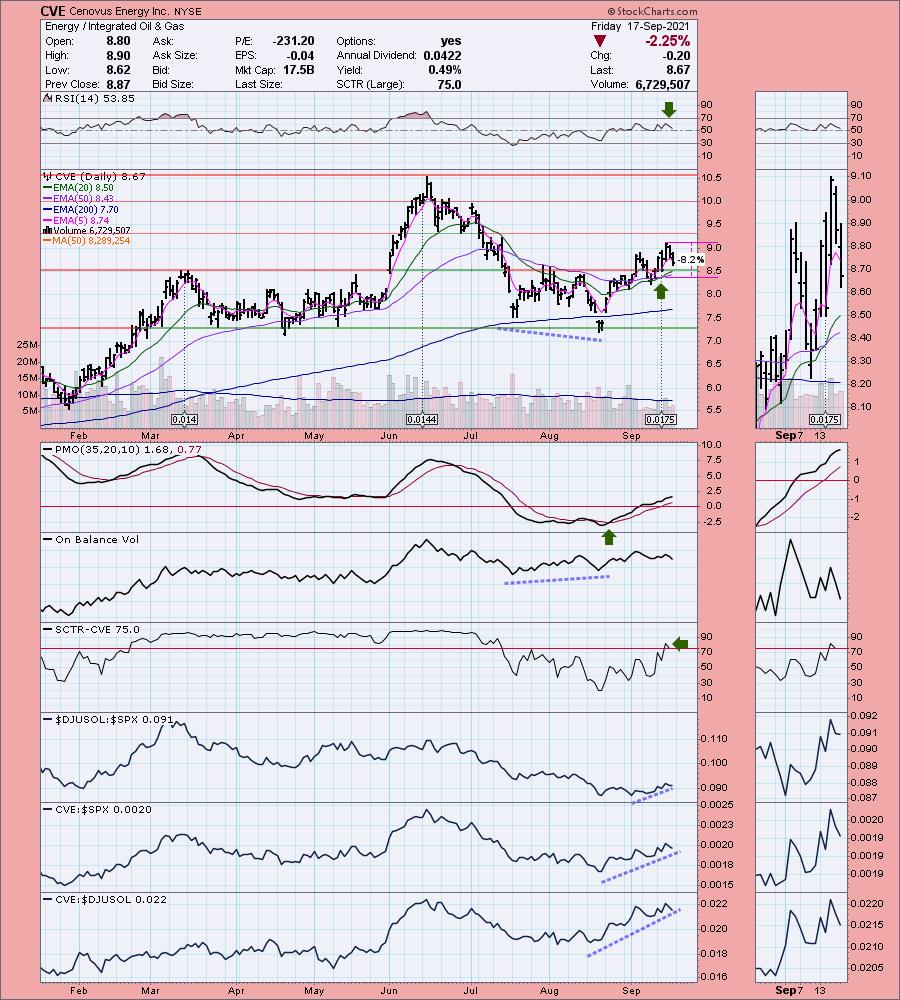
The "Dud" of the week is the very low volume Energy stock, Cenovus Energy (CVE). It is a low-priced stock and tends to show a lot of volatility so it wasn't a complete surprise to see it down the most at -4.62%. The chart is still very interesting, but keep in mind that it is low-priced and low-volume.
Register now for next Friday's Diamond Mine trading room below or right HERE.

RECORDING LINK Friday (9/17):
Topic: DecisionPoint Diamond Mine (9/17/2021) LIVE Trading Room
Start Time : Sep 17, 2021 09:00 AM
Meeting Recording Link.
Access Passcode: Sept/17th
REGISTRATION FOR FRIDAY 9/24 Diamond Mine:
When: Sep 24, 2021 09:00 AM Pacific Time (US and Canada)
Topic: DecisionPoint Diamond Mine (9/24/2021) LIVE Trading Room
Register in advance for this webinar HERE.
Save the registration confirmation email with login instructions in case Zoom doesn't notify you in time.

Free DP Trading Room (9/7) RECORDING LINK:
Topic: DecisionPoint Trading Room
Start Time : Sep 13, 2021 09:01 AM
Meeting Recording Link.
Access Passcode: Sept/13th
For best results, copy and paste the access code to avoid typos.
Last Chance to Download FREE eBook!
"Smart Choices for Treacherous Markets"

Listen To These 11 Women!

These 11 women have more than 221 years combined experience in trading...
Which is why you should pay close attention to what they have to say.
If you ever wondered how to build wealth and generate income with less risk...
Or if there were simple tools that traders use to find profitable "big move trades" without risking all their capital...
My video chapter on Using Momentum and Relative Strength to Find the Best Trades shares how this smart woman is beating the markets.
To download your FREE copy, click HERE.
A few items about the spreadsheet: I've put on the spreadsheet whether the RSI is positive (green) or negative (red). The PMO column tells you if it is rising (green) or falling (red). Finally I've added my own "Sparkle Factor" that gives you my assessment going forward, bullish (green), bearish (red) or neutral (gray). The Sparkle Factor is basically my thoughts on whether I expect it to rise or fall. A neutral means it could really go either way so it could be added to a watch list. If you're in a stock I consider "neutral" going forward, the ball is in your court.
Darling:
Texas Instruments, Inc. (TXN)
EARNINGS: 10/19/2021 (AMC)
Texas Instruments Incorporated engages in the design, manufacture, test, and sell analog and embedded semiconductors, which include industrial, automotive, personal electronics, communications equipment, and enterprise systems. It operates through the following segments: Analog and Embedded Processing. The Analog segment semiconductors change real-world signals, such as sound, temperature, pressure or images, by conditioning them, amplifying them and often converting them to a stream of digital data that can be processed by other semiconductors, such as embedded processors. The Embedded Processing segment designed to handle specific tasks and can be optimized for various combinations of performance, power and cost, depending on the application. The company was founded by Cecil H. Green, Patrick Eugene Haggerty, John Erik Jonsson, and Eugene McDermott in 1930 and is headquartered in Dallas, TX.
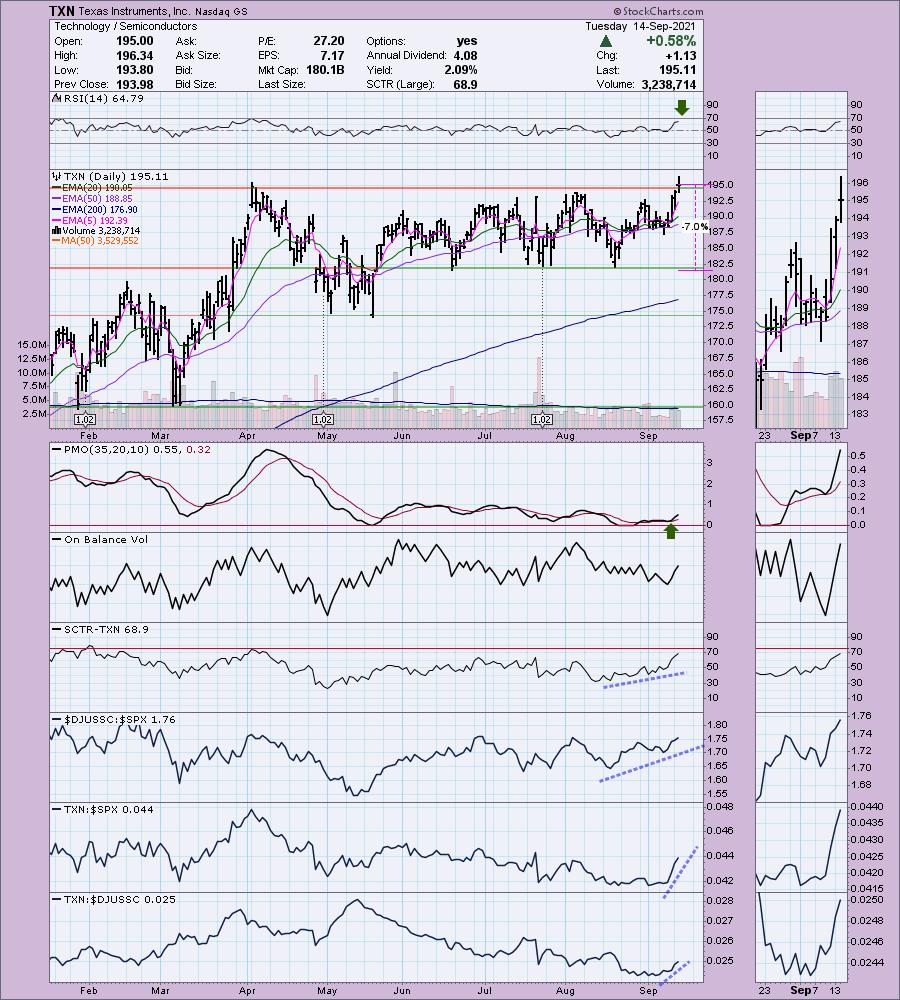
Below is the commentary and chart from 9/15:
"TXN is down -0.14% in after hours trading. This base breakout looks great. The RSI is positive and not overbought. The PMO bottomed above its signal line and took off out of oversold territory. Relative strength continues to improve. My one complaint is the OBV. We should've seen a breakout to new highs like price. However, I'll forgive that given the rally has seen heavy volume. The stop is set below support at 7%."
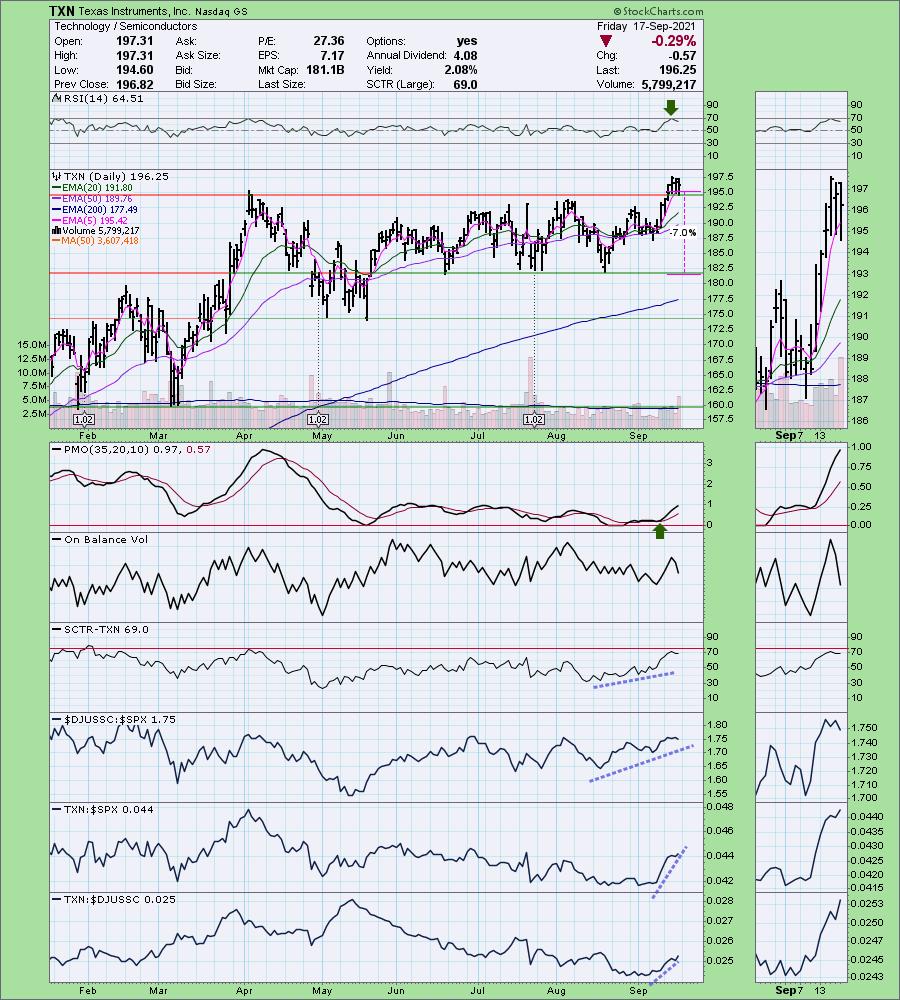
Here is today's chart:
The recent pullback has price holding above important support. It successfully tested that level today. I like that the pullback has also kept the RSI out of overbought territory. The chart continues to grow more bullish in my opinion. Full Disclosure: I own TXN.
Don't forget, on Thursdays I look at reader-requested symbols, so shoot me an email at erin@decisionpoint.com. I read every email I receive and try to answer them all!
Dud:
Cenovus Energy Inc. (CVE)
EARNINGS: 10/28/2021 (BMO)
Cenovus Energy, Inc. engages in provision of gas and oil. Its activities include development, production, and marketing of crude oil, natural gas liquids (NGLS), and natural gas in Canada. The firm operates through four segments: Oil Sands, Conventional, Refining & Marketing, and Corporate & Eliminations. The Oil sands segment includes the development and production of bitumen in northeast Alberta including Foster Creek, Christina Lake and Narrows Lake as well as projects in the early stages of development. The Conventional segment includes includes land primarily in the Elmworth-Wapiti, Kaybob-Edson, and Clearwater operating areas. The Refining and Marketing segment provides transportation and selling of crude oil, natural gas and NGLS. The Corporate and Eliminations segment includes unrealized gains and losses recorded on derivative financial instruments, divestiture of assets, as well as other administrative, financing activities and research costs. The company was founded in 1881 and is headquartered in Calgary, Canada.
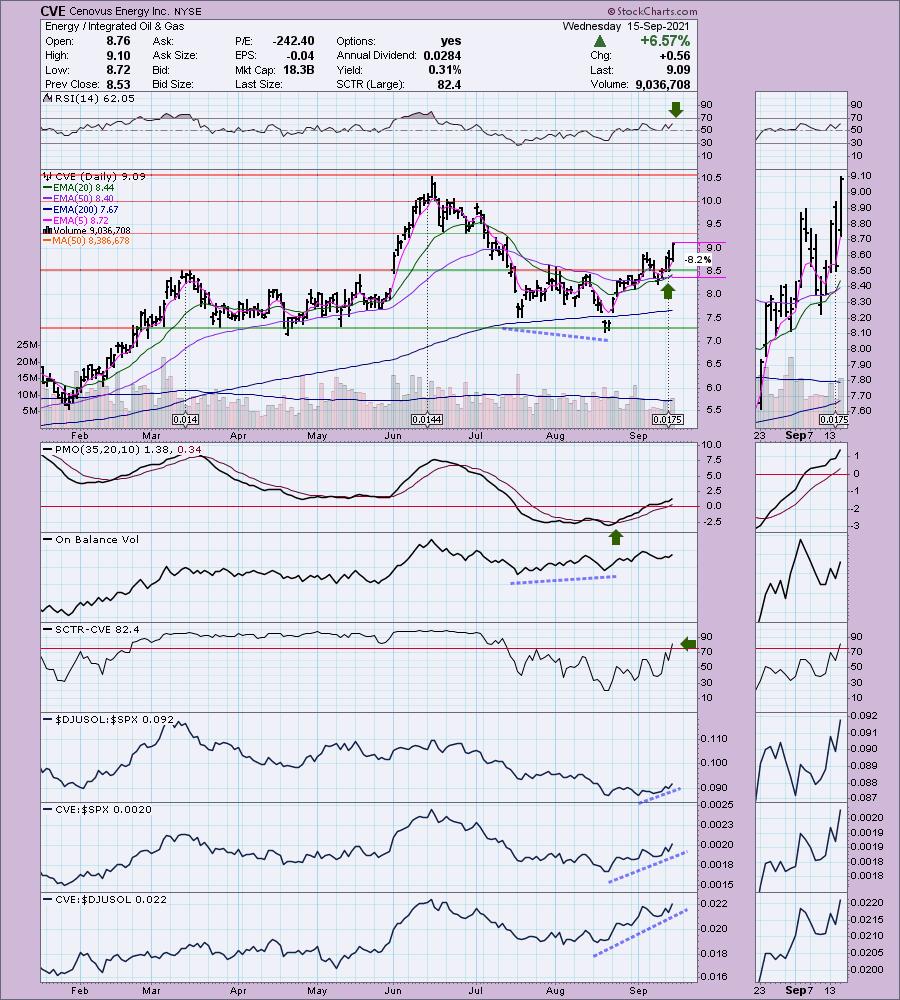
Below is the chart and commentary from 9/15:
"CVE is unchanged in after hours trading. The RSI is positive and the PMO is accelerating its descent in positive territory. We had a positive OBV divergence leading into this rally off the August low. The SCTR has just entered the "hot zone" above 75. An IT Trend Model "Silver Cross" BUY signal was just triggered this week. Relative strength is very good. The stop is set below the 50-EMA at 8.2%."
Below is today's chart:
You notice that CVE still has a 'green' Sparkle Factor, meaning I believe the chart still has merit despite the recent pullback. The technicals on the chart are still positive. The rising trend is still mostly intact. It appears it is pulling back to support at the 20-EMA and the March top. Overall we didn't see much in the way of damage on the PMO. Granted we do have a negative OBV divergence between price tops and OBV tops. Still I like this area of the market and am willing to give it time to more than likely, successfully test support.
THIS WEEK's Sector Performance:
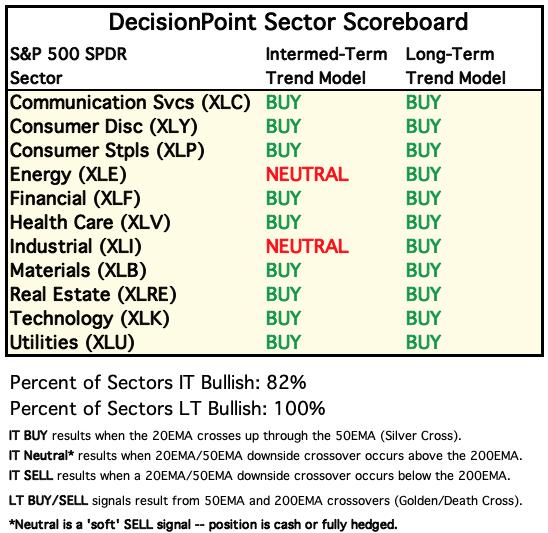
DecisionPoint Sector Scoreboard (Mechanical Trend Model Signals):
Click Here to view Carl's annotated Sector ChartList!
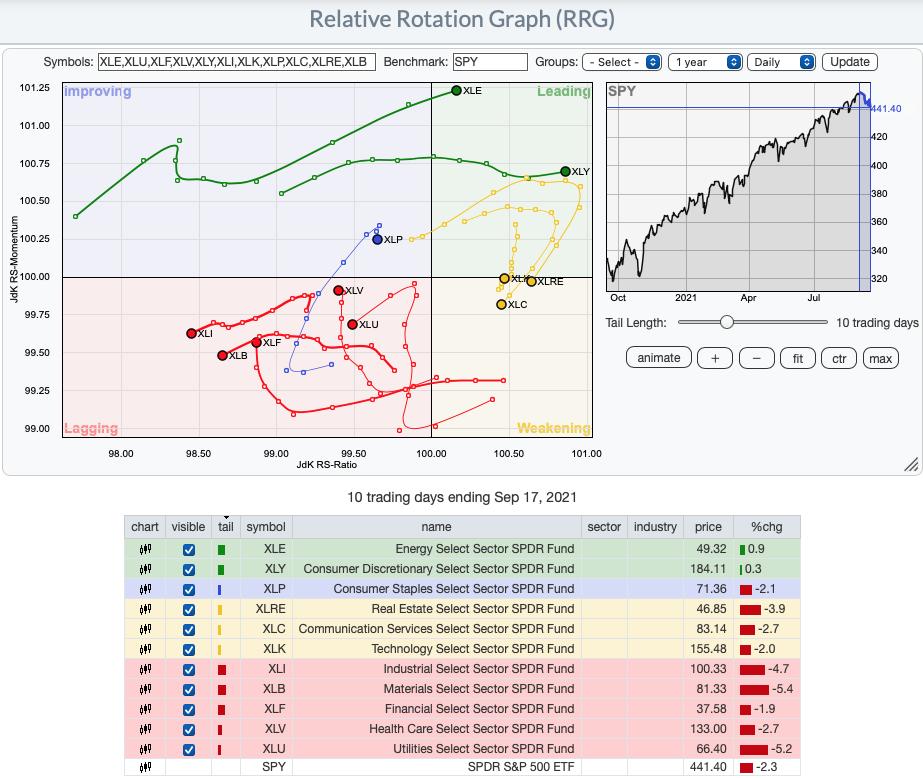
Short-term RRG: As far as the short-term RRG, XLK is losing strength. XLY just entered "Leading" and looks healthy on the chart. XLRE and XLC are in Leading, but they are beginning to rotate back toward Weakening.
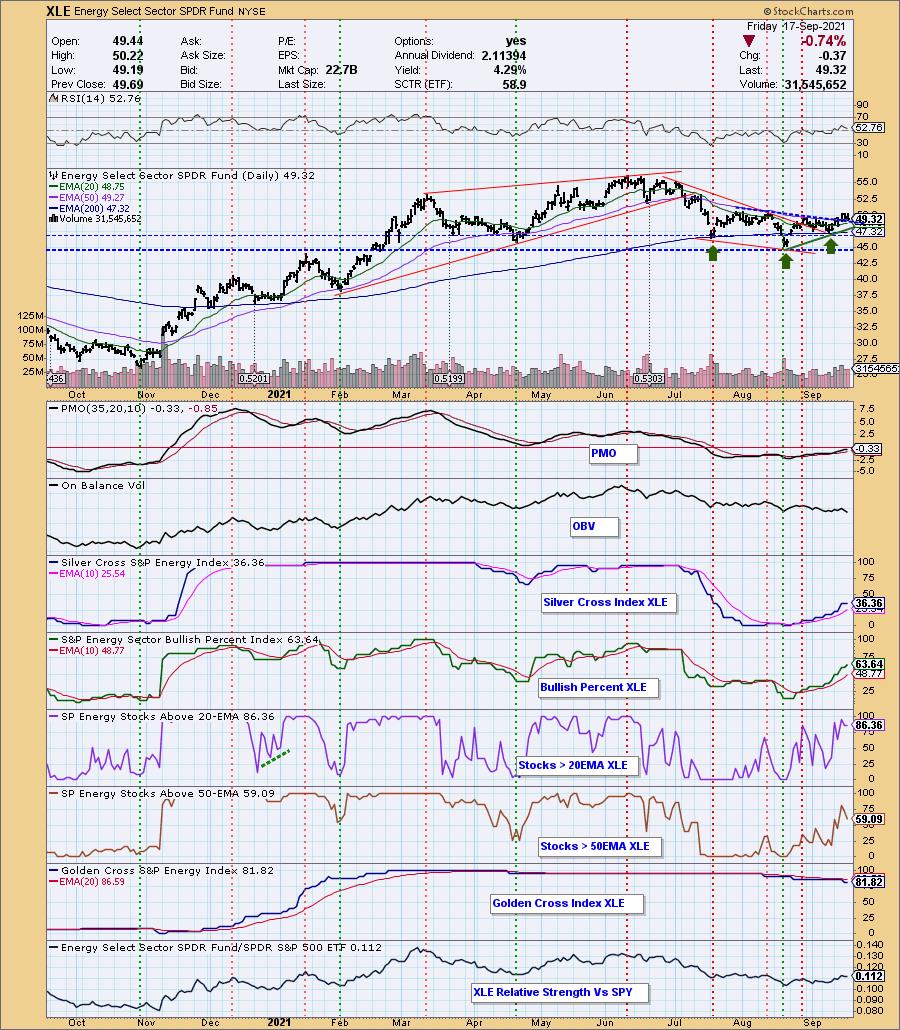
Sector to Watch: Energy (XLE)
Consumer Discretionary (XLY) was the only other sector showing strong positive momentum. However, participation and the SCI strongly favored Energy (XLE) so it is again my sector to watch going into next week. We have a reverse head and shoulders that is attempting execute. The RSI is positive and the PMO is rising. You'll note that the SCI is in a rising trend and its reading is well below the participation readings for stocks above the 20/50-EMAs. That gives XLE a strong bullish bias moving into next week.
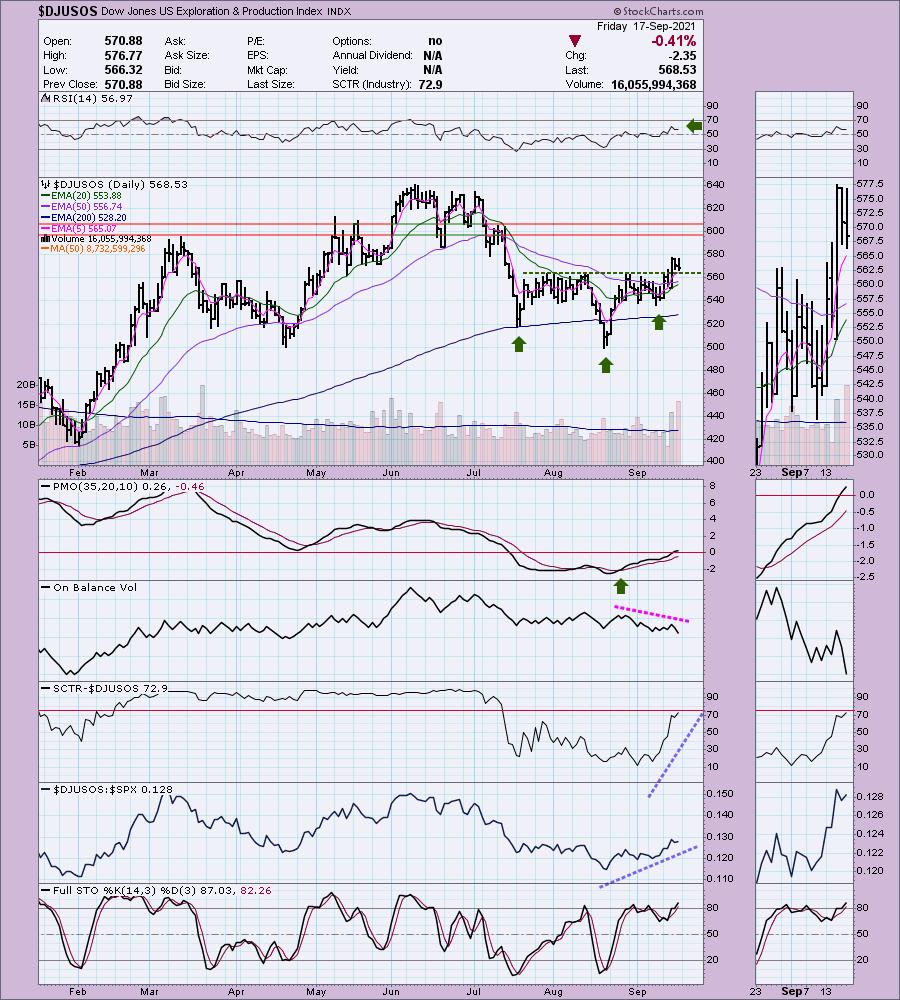
Industry Group to Watch: Exploration & Production ($DJUSOS)
Other than Coal, most of the industry groups within XLE are bullish. Given a choice though, I picked $DJUSOS as the strongest in my opinion. The reverse head and shoulders has executed and price is staying above the neckline even after the recent decline. The RSI is positive and the PMO is rising and now in positive territory. Clearly relative performance is strong against the SPX and I included Stochastic which looks positive as well (albeit a bit overbought).
Go to our Sector ChartList on DecisionPoint.com to get an in depth view of all the sectors.
Technical Analysis is a windsock, not a crystal ball.
Have a great weekend & Happy Charting! Next Diamonds Report is Tuesday 9/21.
- Erin
erin@decisionpoint.com
Full Disclosure: I'm about 70% invested right now and 30% is in 'cash', meaning in money markets and readily available to trade with.
Watch the latest episode of DecisionPoint with Carl & Erin Swenlin on Mondays 7:00p EST or on the DecisionPoint playlist on the StockCharts TV YouTube channel here!
NOTE: The stocks reported herein are from mechanical trading model scans that are based upon moving average relationships, momentum and volume. DecisionPoint analysis is then applied to get five selections from the scans. The selections given should prompt readers to do a chart review using their own analysis process. This letter is not a call for a specific action to buy, sell or short any of the stocks provided. There are NO sure things or guaranteed returns on the daily selection of "diamonds in the rough."
Helpful DecisionPoint Links:
DecisionPoint Shared ChartList and DecisionPoint Chart Gallery
Price Momentum Oscillator (PMO)
Swenlin Trading Oscillators (STO-B and STO-V)
(c) Copyright 2021 DecisionPoint.com