
In the background, I have been testing out a popular indicator to see if it fits into my current analysis process. I've determined I like it better than the StockCharts Technical Rank (SCTR). I already added relative strength analysis on the chart a few months back, so I decided I could take the SCTR off my default ChartStyle. I have decided to add Full Stochastics in its place. I like that it doesn't seem to lag as much. It has been proving useful in picking out "Diamonds in the Rough" based on its direction and thrust.
I'm also going to list the various StockCharts "Predefined Scans" that were triggered on "Diamonds in the Rough". If you go to the "Symbol Summary" on StockCharts, it lists them there. Since they do all the work, I'll post them. I don't follow the indicators that trigger these scans, but maybe you do.
The "short list" is very short. It was slim pickin's out there. I've included a short selling opportunity in the list, but opted not to cover it in today's report. The four I've picked have very strong charts, but I would hesitate to expand your exposure to such a weak market despite these nice chart set-ups.
Finally, I have another presentation coming up on Thursday for Synergy Trader's "VIX and News Event Trading" Live Training Session. I'll be discussing how to use the VIX as part of my "climax" analysis to determine pivot points in the market. I'd really appreciate you signing up. You don't have to attend the live event. Recordings will be sent to those who register. If you're interested, here's the link.
Today's "Diamonds in the Rough" are: BGS, CATO, INVA and IRWD.
"Short List" (no order): SLRC, SGEN and PDD (short).

RECORDING LINK Friday (9/17):
Topic: DecisionPoint Diamond Mine (9/17/2021) LIVE Trading Room
Start Time : Sep 17, 2021 09:00 AM
Meeting Recording Link.
Access Passcode: Sept/17th
REGISTRATION FOR FRIDAY 9/24 Diamond Mine:
When: Sep 24, 2021 09:00 AM Pacific Time (US and Canada)
Topic: DecisionPoint Diamond Mine (9/24/2021) LIVE Trading Room
Register in advance for this webinar HERE.
Save the registration confirmation email with login instructions in case Zoom doesn't notify you in time.

Free DP Trading Room (9/13) RECORDING LINK:
Topic: DecisionPoint Trading Room
Start Time : Sep 13, 2021 09:01 AM
Meeting Recording LINK.
Access Passcode: Sept/13th
For best results, copy and paste the access code to avoid typos.
Welcome to DecisionPoint Daily Diamonds, wherein I highlight five "Diamonds in the Rough." These are selected from the results of my DecisionPoint scans, which search for stocks that could benefit from the trend and condition of the market. Remember, these are not recommendations to buy or sell, but are the most interesting of the stocks that surfaced in my scans. My objective is to save you the work of the initial, tedious culling process, but you need to apply your own analysis to see if these stocks pique your interest as well. There are no guaranteed winners here!
B&G Foods Inc. (BGS)
EARNINGS: 11/4/2021 (AMC)
B&G Foods, Inc.is a holding company, which engages in the manufacture, sale, and distribution of shelf-stable frozen food, and household products in the U.S., Canada, and Puerto Rico. Its products include frozen and canned vegetables, hot cereals, fruit spreads, canned meats and beans, bagel chips, spices, seasonings, hot sauces, and wine vinegar. Its brands include Back to Nature, Bear Creek, Cream of Wheat, Green Giant, Mrs. Dash, and Ortega. The company was founded in 1889 and is headquartered in Parsippany, NJ.
Predefined Scans Triggered: Improving Chaikin Money Flow, P&F Bullish Signal Reversal, Bullish MACD Crossovers, P&F Double Bottom Breakout.
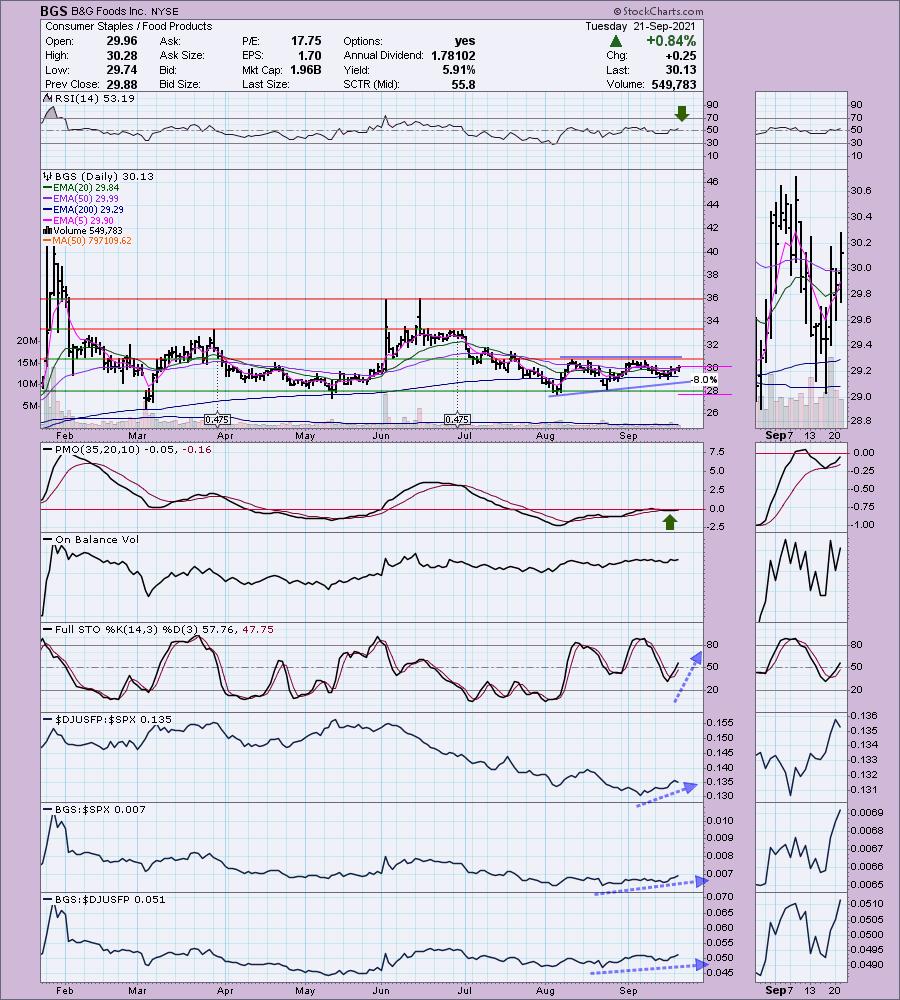
BGS is up +0.23% in after hours trading. I covered BGS in the April 21st, 2021 Diamonds Report. The stop was never hit, but the position is currently down -1.18%. This is a fairly boring chart, but I liked the bullish ascending triangle that suggests the next test of overhead resistance will be successful. Price closed above the 50-EMA and yesterday, despite the market tanking, it held above its 20-EMA. We have a recent 5/20-EMA positive crossover. The RSI is positive and the PMO has bottomed above its signal line. Stochastic show an upward thrust from mildly oversold territory. Relative strength is improving. The stop is at 8%, set similarly to my April stop.
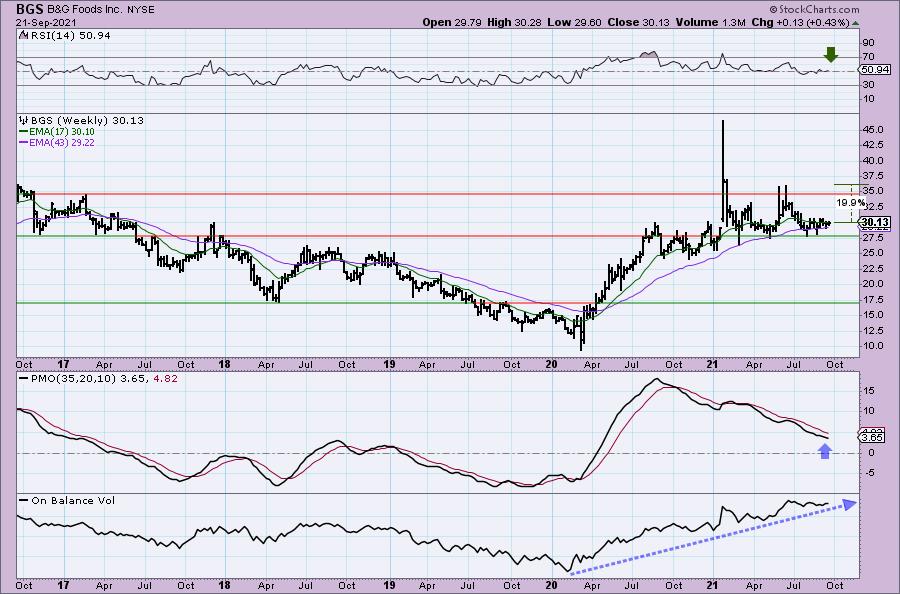
I like the very positive OBV on the weekly chart. The PMO isn't great, but the weekly RSI is staying mostly positive. If price can get to the June highs, that would be about a 20% gain.
Cato Corp. (CATO)
EARNINGS: 11/18/2021 (BMO)
The Cato Corp. engages in the operation of apparel and accessories specialty stores. It operates through Retail and Credit segments. The Retail segment include retailing of women's apparel, shoes, and accessories. The Credit segment offers credit card and credit authorization services. The company was founded in 1946 and is headquartered in Charlotte, NC.
Predefined Scans Triggered: P&F Double-Bottom Breakout
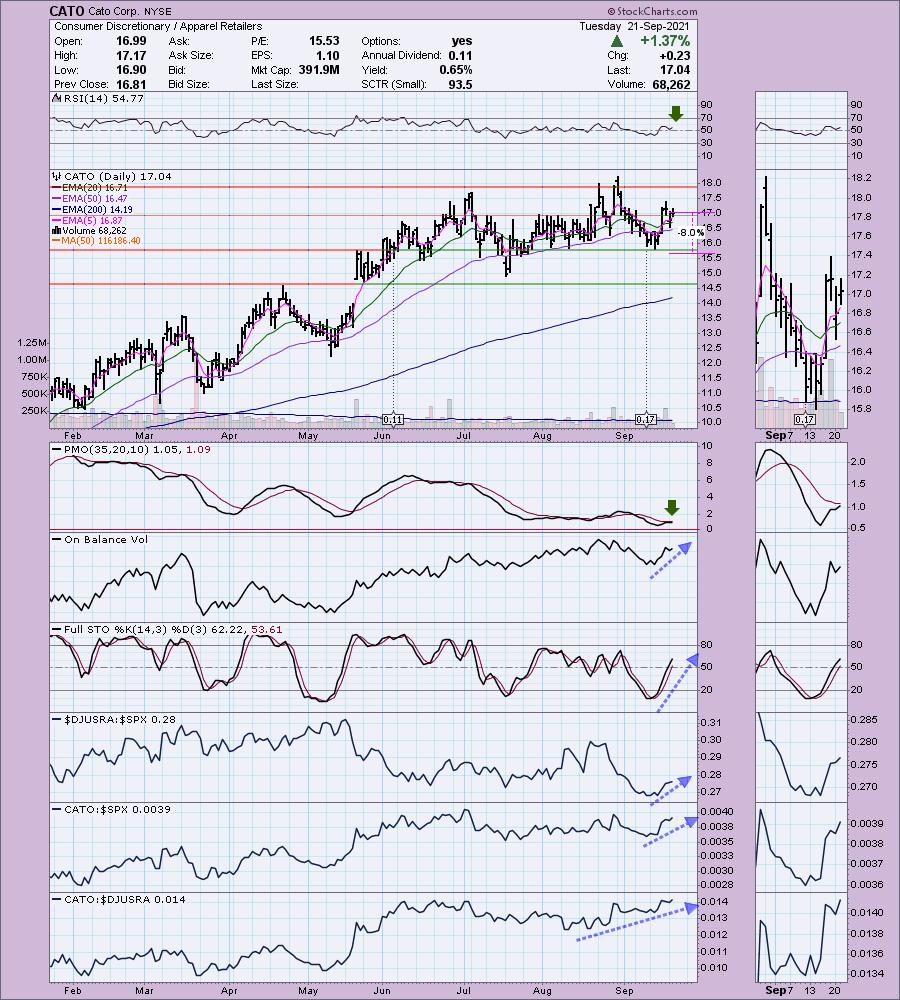
CATO is unchanged in after hours trading. I'm not thrilled with this area of the market given Cyclicals generally don't outperform in a weak market, but the chart is promising. Price pulled back yesterday like most stocks, but it closed above its 20-EMA. The PMO is nearing a crossover BUY signal and the RSI is positive. Stochastics are showing an upward thrust out of oversold territory. Relative strength is looking good. The stop is set beneath support at 8%.
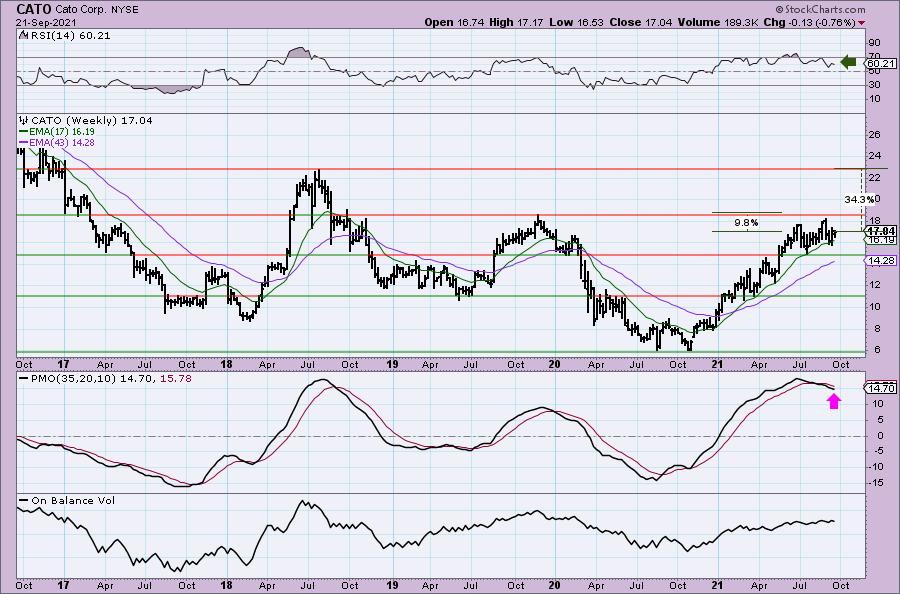
The weekly RSI is positive. However, the PMO really isn't. It may be decelerating somewhat. Upside potential could be as high as 34%, but I do think you need to watch what it does at the $18 level. If it turns over, I'd get rid of it.
Innoviva, Inc. (INVA)
EARNINGS: 10/27/2021 (AMC)
Innoviva, Inc. is engaged in the development, commercialization, and financial management of bio-pharmaceuticals. Its portfolio includes Relvar Breo Ellipta, which is a once-daily combination medicine consisting of a long-acting beta2 agonist, vilanterol, and an inhaled corticosteroid, fluticasone furoate; and Anoro Ellipta, a once-daily medicine combining a long-acting muscarinic antagonist, umeclidinium bromide, LABA, VI. The company was founded by P. Roy Vagelos, Mathai Mammen, and George M. Whitesides in November 1996 and is headquartered in Burlingame, CA.
Predefined Scans Triggered: Improving Chaikin Money Flow, New CCI Buy Signals, Moved Above Upper Bollinger Band.
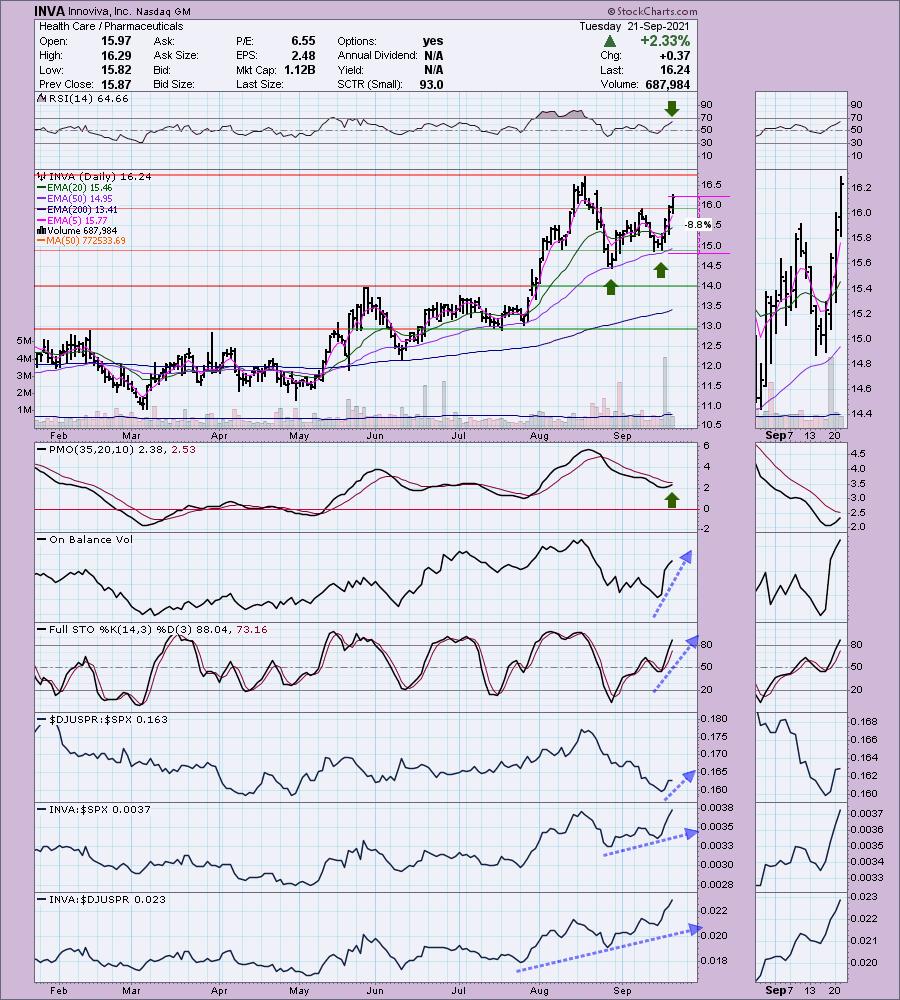
INVA is up +1.42% in after hours trading. The chart is very strong given the double-bottom price pattern, the bounces off the 50-EMA, and the positive RSI. The PMO is rising and nearing a crossover BUY signal. Volume is sailing in. Relative strength is strong and Stochastic is rising, albeit getting a bit overbought. The stop is rather deep at 8.8%, but you could tighten it up all the way to the 20-EMA if you wish.
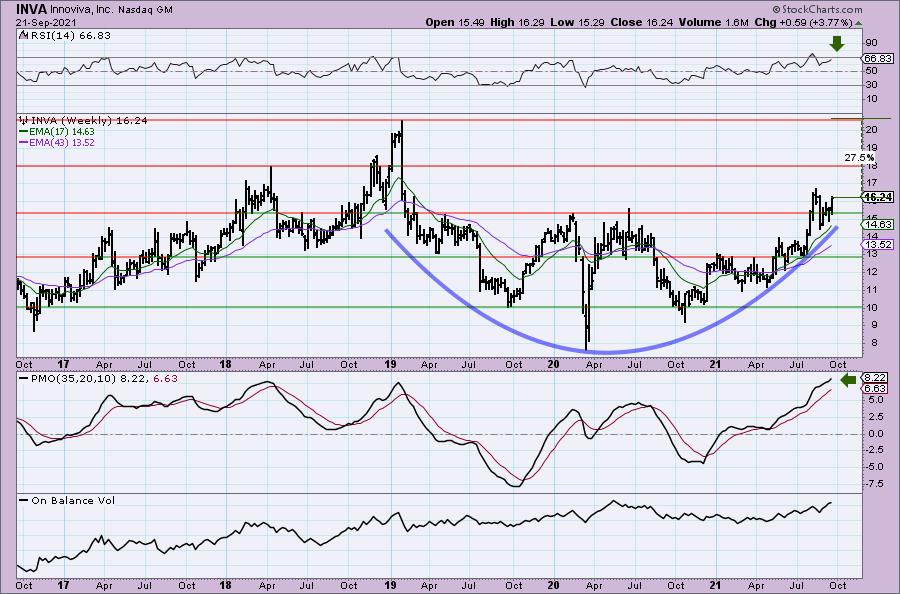
We have a very large cup shaped bottom and price has broken out above the 2020 highs. The weekly RSI and PMO are rising. Upside potential is tasty at 27%.
Ironwood Pharmaceuticals Inc. (IRWD)
EARNINGS: 11/4/2021 (BMO)
Ironwood Pharmaceuticals, Inc. is a healthcare company, which focuses on the development and commercialization of Gastrointestinal (GI) product opportunities in areas of significant unmet need, leveraging demonstrated expertise and capabilities in GI diseases. Its products include linaclotide, a guanylate cyclase type-C agonists which treats patients irritable bowel syndrome with constipation and chronic constipation. The company was founded by Peter M. Hecht, Eric F. Summers, G. Todd Milne, Brian M. Cali, Joseph C. Cook Jr., and Gina Bornino Miller on January 5, 1998 and is headquartered in Boston, MA.
Predefined Scans Triggered: Elder Bar Turned Green, Parabolic SAR Buy Signals
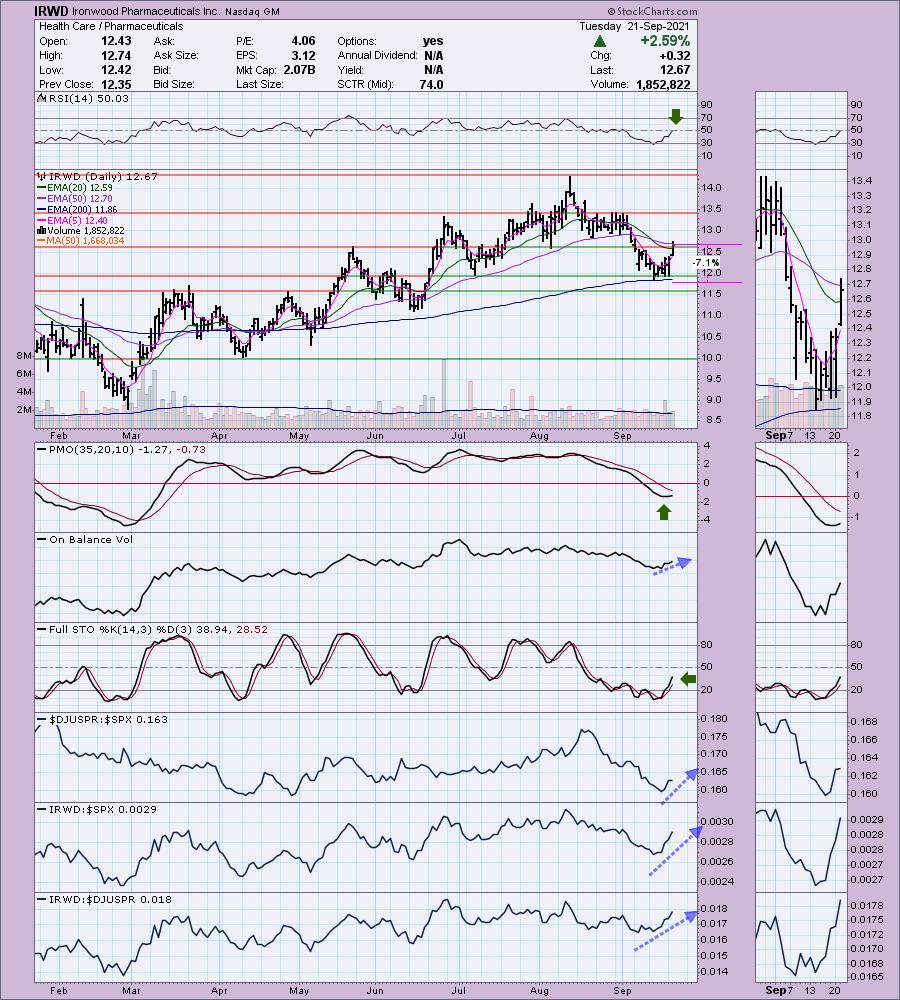
IRWD is up +0.32% in after hours trading. I covered IRWD on June 22nd, 2020 and on July 9th, 2020. I didn't list stops on these. I liked it on 6/22/20, but wrote that I no longer liked it on 7/9/20. Looking at the weekly chart, the positions were not successful.
I like today's breakout and the cup shaped bottom. The PMO is just turning up and the RSI is just now getting positive. Stochastics look great as they thrust upward. Relative strength is strong. We also have a bounce off the 200-EMA. Price has just peaked above resistance at the May top. I'd set the stop at or just below the 200-EMA.
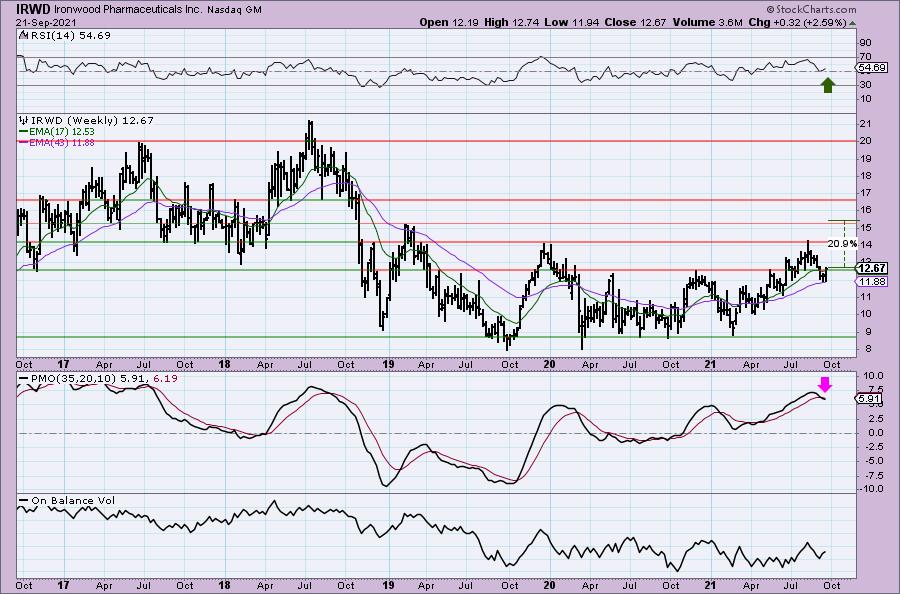
Apparently, price also popped above resistance at the 2020 tops as well. The RSI turned up in positive territory. The weekly PMO did just trigger a crossover SELL signal on the recent correction, but price is holding above the 43-week EMA on this bounce. Upside potential if it reaches the 2019 top is almost 21%.
Don't forget, on Thursdays I look at reader-requested symbols, so shoot me an email at erin@decisionpoint.com. I read every email I receive and try to answer them all!
Current Market Outlook:
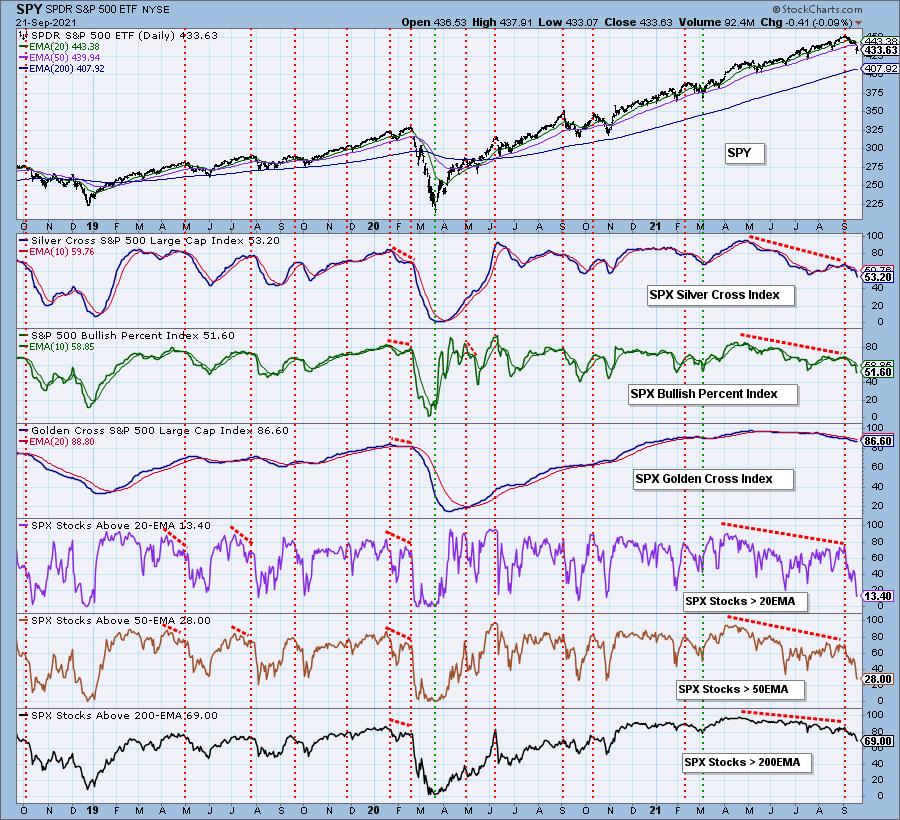
Market Environment: It is important to consider the odds for success by assessing the market tides. The following chart uses different methodologies for objectively showing the depth and trend of participation for intermediate- and long-term time frames.
- The Silver Cross Index (SCI) shows the percentage of SPX stocks on IT Trend Model BUY signals (20-EMA > 50-EMA)
- The Golden Cross Index (GCI) shows the percentage of SPX stocks on LT Trend Model BUY signals (50-EMA > 200-EMA)
- The Bullish Percent Index (BPI) shows the percentage of SPX stocks on Point & Figure BUY signals.
Don't forget that as a "Diamonds" member, you have access to our GCI/SCI curated ChartList on DecisionPoint.com. You'll find it under "Members Only" links on the left side on the Blogs and Links Page.
Here is the current chart:
Full Disclosure: I'm about 70% invested and 30% is in 'cash', meaning in money markets and readily available to trade with.
Technical Analysis is a windsock, not a crystal ball.
Happy Charting!
- Erin
erin@decisionpoint.com
Watch the latest episode of DecisionPoint with Carl & Erin Swenlin on Mondays 7:00p EST or on the DecisionPoint playlist on the StockCharts TV YouTube channel here!
NOTE: The stocks reported herein are from mechanical trading model scans that are based upon moving average relationships, momentum and volume. DecisionPoint analysis is then applied to get five selections from the scans. The selections given should prompt readers to do a chart review using their own analysis process. This letter is not a call for a specific action to buy, sell or short any of the stocks provided. There are NO sure things or guaranteed returns on the daily selection of "Diamonds in the Rough."
Helpful DecisionPoint Links:
DecisionPoint Shared ChartList and DecisionPoint Chart Gallery
Price Momentum Oscillator (PMO)
Swenlin Trading Oscillators (STO-B and STO-V)
For more links, go to DecisionPoint.com