
When I run my scans each day I usually spot a "theme". Today's theme was Biotechnology. Additionally, I noted Healthcare stocks had a high profile as well. I have two Biotechs for you to review and I threw in a pharmaceutical stock that also caught my eye. I have a few others in the "Stocks to Review".
Overall scan results were much thinner than usual. My Momentum Sleepers scan and PMO Crossover scan generally return well over 50 to 80 results. Today they returned less than 30. Today the market finished with a black candlestick which does make me concerned that a decline or at least sideways churn is ahead. Remember that Biotechs are highly volatile so you'll want to be prepared if the market declines and takes your stocks down with it.
Today's "Diamonds in the Rough": CRL, ERAS, RGEN and TVTX.
"Stocks to Review": CCCC, TEAM, AKRO, CMAX, CVRX, RGEN and NEOG.

RECORDING LINK Friday (10/22):
Topic: DecisionPoint Diamond Mine (10/22/2021) LIVE Trading Room
Start Time : Oct 22, 2021 09:00 AM
Meeting Recording Link HERE.
Access Passcode: October@22
REGISTRATION FOR FRIDAY 10/29 Diamond Mine:
When: Oct 29, 2021 09:00 AM Pacific Time (US and Canada)
Topic: DecisionPoint Diamond Mine (10/29/2021) LIVE Trading Room
Register in advance for this webinar HERE.
Save the registration confirmation email with login instructions in case Zoom doesn't notify you in time.

Free DP Trading Room (10/18) RECORDING LINK:
Topic: DecisionPoint Trading Room
Start Time: Oct 25, 2021 09:00 AM
Meeting Recording LINK.
Access Passcode: October#25
For best results, copy and paste the access code to avoid typos.
Welcome to DecisionPoint Daily Diamonds, wherein I highlight five "Diamonds in the Rough." These are selected from the results of my DecisionPoint scans, which search for stocks that could benefit from the trend and condition of the market. Remember, these are not recommendations to buy or sell, but are the most interesting of the stocks that surfaced in my scans. My objective is to save you the work of the initial, tedious culling process, but you need to apply your own analysis to see if these stocks pique your interest as well. There are no guaranteed winners here!
Charles River Laboratorie (CRL)
EARNINGS: 11/3/2021 (BMO)
Charles River Laboratories International, Inc. is an early-stage contract research company, which provides essential products and services to help pharmaceutical and biotechnology companies, government agencies and academic institutions. It operates through the following segments: Research Models & Services, Discovery & Safety Assessment and Manufacturing Support. The Research Models & Services segment comprises of the production and sale of research models, and also offers services designed to support its client's use of research models in screening non-clinical drug candidates. The Discovery & Safety Assessment segment offers discovery and safety assessment services, both regulated and non-regulated, in which it include both in vivo and in vitro studies, supporting laboratory services, and strategic preclinical consulting and program management to support product development. The Manufacturing Support segment provides endotoxin and microbial detection, avian vaccine and biologics testing solutions. The company was founded by Henry L. Foster in 1947 and is headquartered in Wilmington, MA.
Predefined Scans Triggered: Moved Above Upper Bollinger Band and P&F Double Top Breakout.
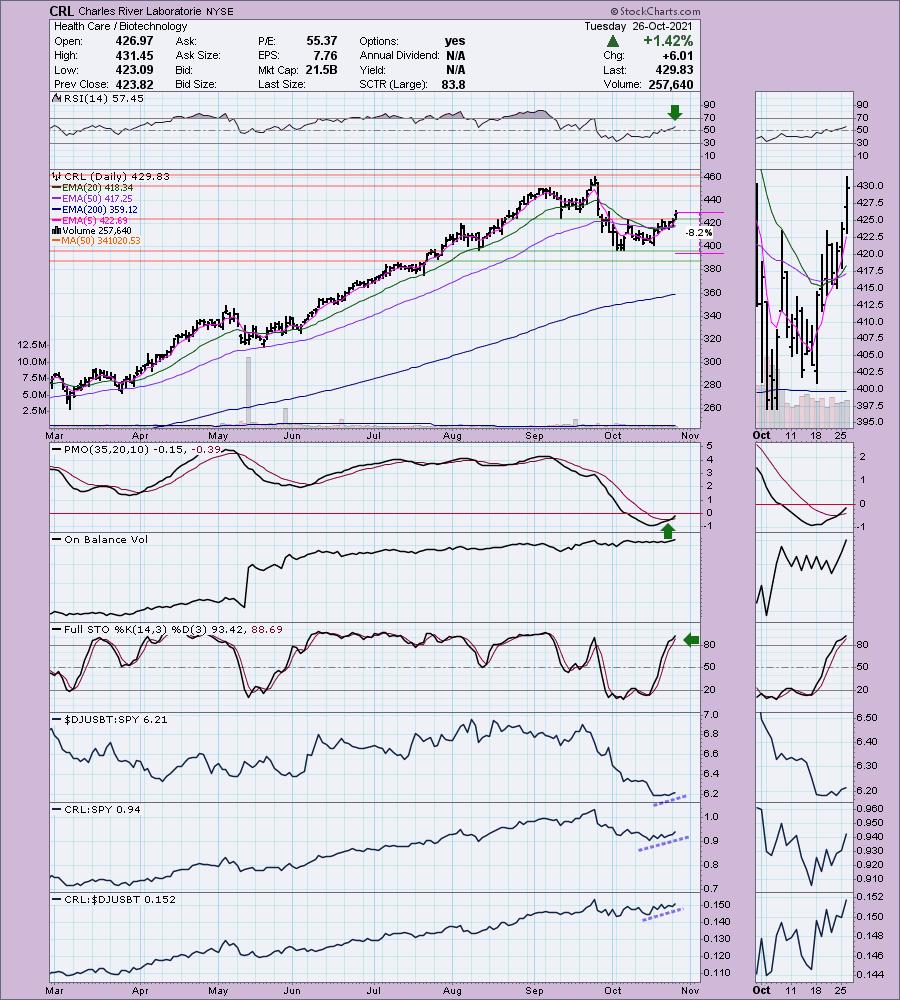
CRL is up +0.04% in after hours trading. I've covered CRL once before on September 15th 2020. The position was not stopped out so it is currently up +90.8%. This was a healthy pullback (no pun intended) after a long-term rally that is the reason the September position is up. It has formed a short-term double-bottom pattern and today's rally executed it. The minimum upside target would take to at least the early September top. I'm looking for a challenge of new all-time highs. The PMO is on an oversold BUY signal and the RSI has just entered positive territory. Volume is coming in. Stochastics are positive and suggest internal strength. There was a recent IT Trend Model "Silver Cross" BUY signal as price broke out above the key moving averages. Relative strength shows us that Biotechs have been keeping up with the market, but seem to be trending up very slightly this week. CRL is outperforming the group and the SPY. The stop is set below support at the October low.
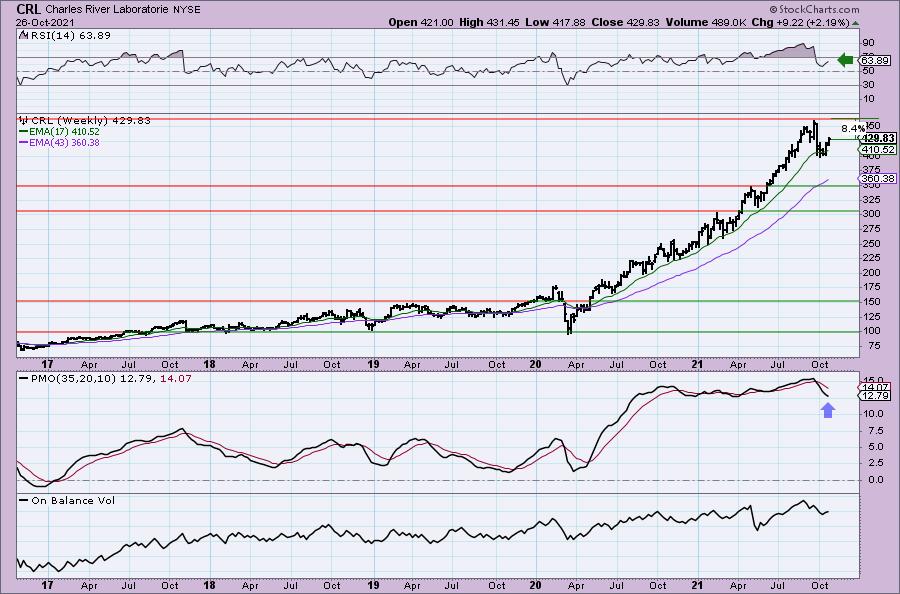
The weekly chart shows a decelerating weekly PMO, but it is still looking bearish in its fall from overbought territory. The RSI had been overbought for well over a month, but is now in positive territory and no longer overbought. It's also rising. I expect all-time highs to be broken, but this does tell us that resistance is only about 8.4% away.
Erasca Inc. (ERAS)
EARNINGS: 10/28/2021 (AMC)
Erasca, Inc. is a clinical stage precision oncology company that focuses on discovering, developing, and commercializing therapies for RAS/MAPK pathway-driven cancers. It has assembled a wholly owned or controlled RAS/MAPK pathway focused pipeline comprising modality-agnostic programs. The company was founded by Jonathan E. Lim on July 2, 2018 and is headquartered in San Diego, CA.
Predefined Scans Triggered: Parabolic SAR Buy Signals and P&F Double Top Breakout.
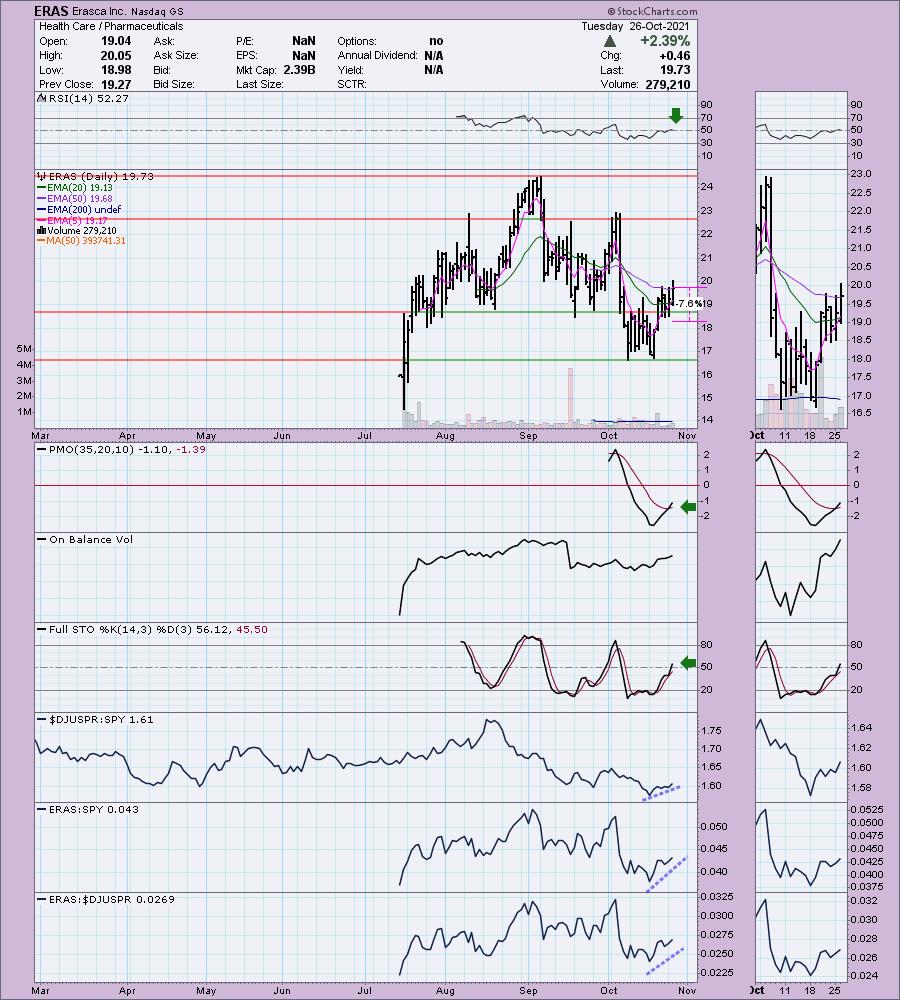
ERAS is unchanged in after hours trading. It reports on Thursday afternoon, so keep that in mind. This is a relatively new stock so we don't have a lot of history here. I do like the double-bottom pattern and the rally today that took it above the confirmation line with a close above the 50-EMA. Today the 5-EMA crossed above the 20-EMA for a ST Trend Model BUY signal. The PMO triggered a BUY signal today and the RSI is in positive territory. Stochastics definitely sold me on this one given they are rising strongly and aren't yet overbought. Relative performance is also very strong within the Pharma group. The group itself, like Biotechs, is beginning to show new relative strength. The stop is set below support at the August/September lows.
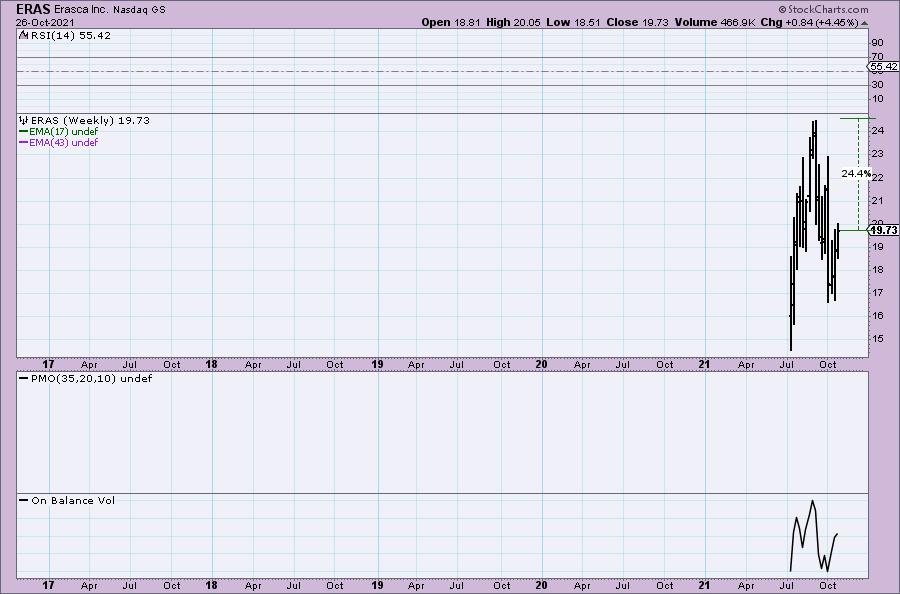
The weekly chart is void on any information, but we do see that if it can reach prior highs, it would be a 24.4% gain.
Travere Therapeutics, Inc. (TVTX)
EARNINGS: 10/28/2021 (AMC)
Travere Therapeutics, Inc. is a biopharmaceutical company. It engages in the identification, development, commercialization, and distribution of therapies to people living with rare diseases. The firm's products include Chenodal, Cholbam, and Thiola. The company was founded by Martin Shkreli on February 8, 2008 and is headquartered in San Diego, CA.
Predefined Scans Triggered: Moved Above Upper Price Channel, P&F Double Top Breakout and P&F Ascending Triple Top Breakout.
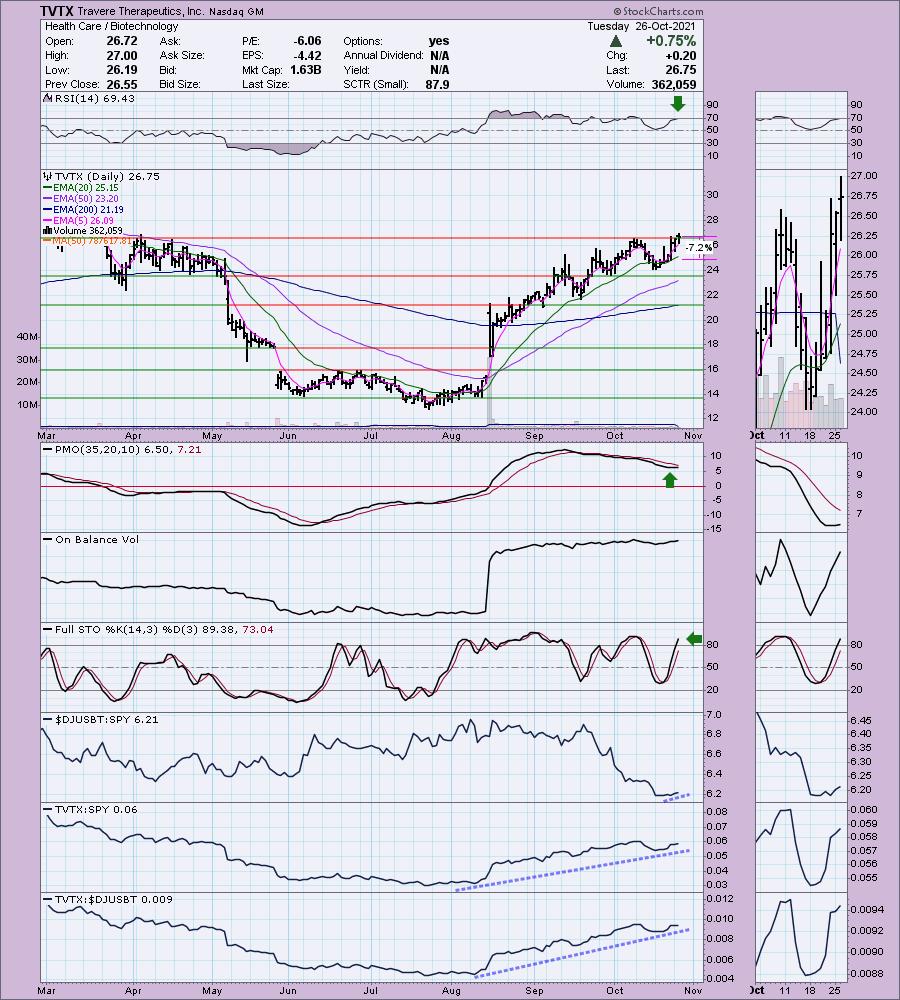
TVTX is unchanged in after hours trading. Please note that it reports earnings on Thursday night. I like the look of this chart for a few reasons. The RSI is positive and not yet overbought. Price is breaking out above strong resistance at the October high, but also the April highs. The PMO has turned back up. Price bounced off the 20-EMA and its "personality" suggests that it likes to pullback to the 20-EMA and rally. Stochastics are rising and overbought. With Stochastics, when it moves above 80 and stays there, it suggests internal strength. This stocks shows great relative strength v. the market and the industry group. I've set the stop below the 20-EMA.
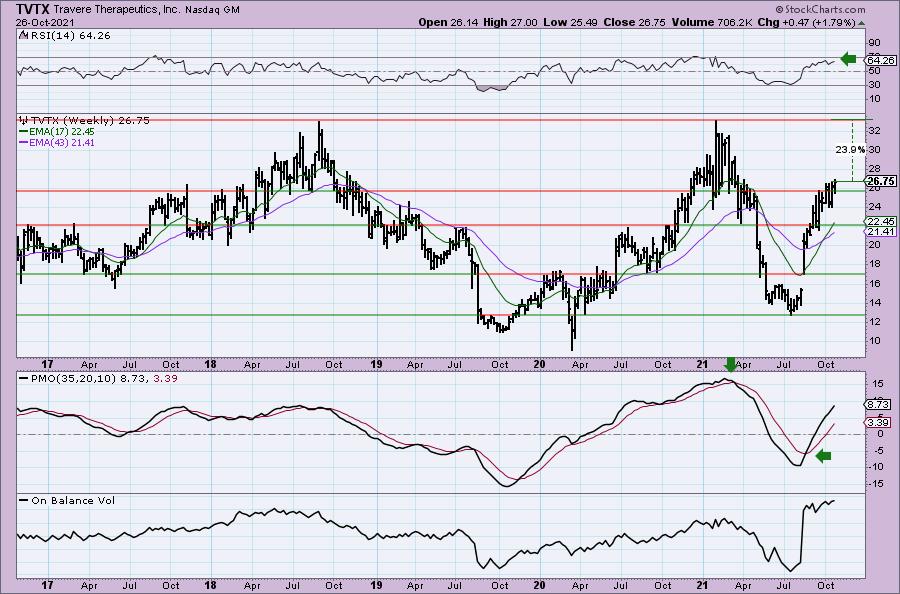
Probably the best weekly chart I've seen on a "Diamond in the Rough" for a long time. The PMO is already on a BUY signal and rising. It is not overbought yet. The weekly RSI is positive and not overbought. If it can reach its all-time high, that would be nearly a 24% gain on the position.
Don't forget, on Thursdays I look at reader-requested symbols, click HERE to shoot me an email. I read every email I receive and try to answer them all!
Current Market Outlook:
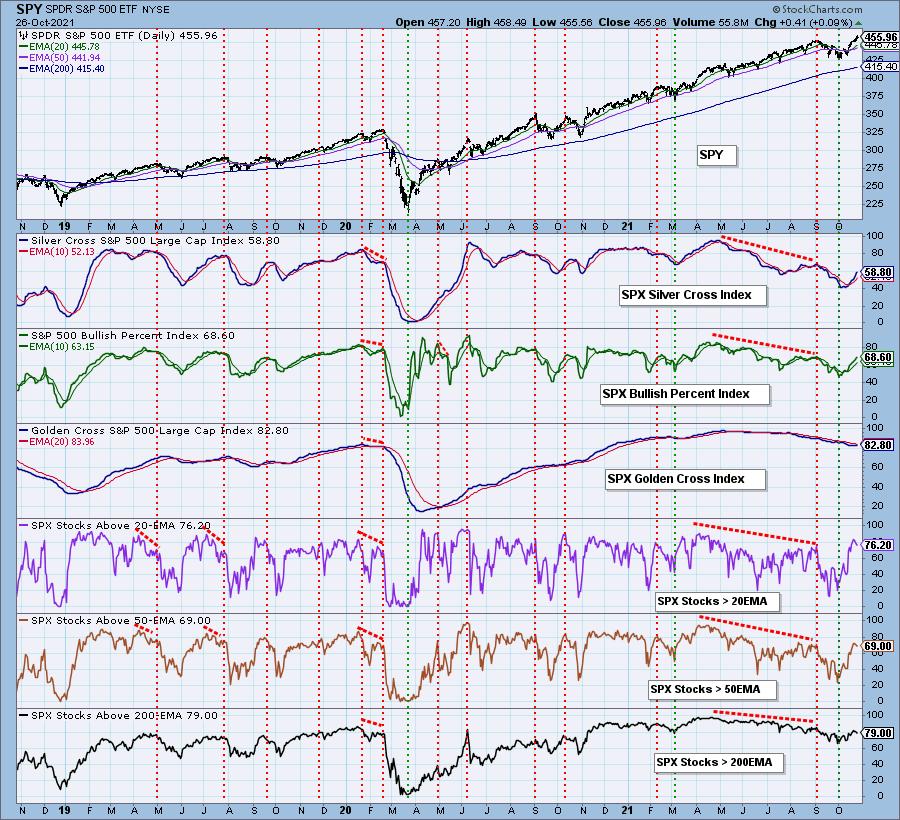
Market Environment: It is important to consider the odds for success by assessing the market tides. The following chart uses different methodologies for objectively showing the depth and trend of participation for intermediate- and long-term time frames.
- The Silver Cross Index (SCI) shows the percentage of SPX stocks on IT Trend Model BUY signals (20-EMA > 50-EMA)
- The Golden Cross Index (GCI) shows the percentage of SPX stocks on LT Trend Model BUY signals (50-EMA > 200-EMA)
- The Bullish Percent Index (BPI) shows the percentage of SPX stocks on Point & Figure BUY signals.
Don't forget that as a "Diamonds" member, you have access to our GCI/SCI curated ChartList on DecisionPoint.com. You'll find it under "Members Only" links on the left side on the Blogs and Links Page.
Here is the current chart:
Full Disclosure: I'm back to 85% invested and 15% is in 'cash', meaning in money markets and readily available to trade with.
I'm required to disclose if I currently own a stock and/or may buy it within the next 72 hours.
Technical Analysis is a windsock, not a crystal ball.
Happy Charting!
- Erin
erin@decisionpoint.com
Watch the latest episode of DecisionPoint with Carl & Erin Swenlin on Mondays 7:00p EST or on the DecisionPoint playlist on the StockCharts TV YouTube channel here!
NOTE: The stocks reported herein are from mechanical trading model scans that are based upon moving average relationships, momentum and volume. DecisionPoint analysis is then applied to get five selections from the scans. The selections given should prompt readers to do a chart review using their own analysis process. This letter is not a call for a specific action to buy, sell or short any of the stocks provided. There are NO sure things or guaranteed returns on the daily selection of "Diamonds in the Rough."
Helpful DecisionPoint Links:
DecisionPoint Shared ChartList and DecisionPoint Chart Gallery
Price Momentum Oscillator (PMO)
Swenlin Trading Oscillators (STO-B and STO-V)
For more links, go to DecisionPoint.com