
It's already Thursday!? It is Reader Request Day in the DP Diamonds Report. The list was full of very interesting symbols and come from different sectors and industry groups. Every one of these charts has merit, as did the ones I've listed in the "Stocks to Review". I just can't cover them all.
I did run my new "Momentum Sleepers" scan and I'm really impressed with the results that I'm getting. I noted at least two requests that were in the results. The majority of the "Diamonds in the Rough" this week came from that scan.
Solar backed up a bit this morning offering some great entries. I did pick up PLUG on the pullback this morning using the 5-minute candlestick chart. It moved up from there but did pull back again at the end of the day to about where I bought it.
The REITs I gave you on Tuesday are continuing to outperform. I think it's going to be a good week for "Diamonds in the Rough" (again!).
Don't forget to sign up for tomorrow's Diamond Mine trading room! The link is below as well as right here.
Today's "Diamonds in the Rough": CDNS, RAD, RDNT, UMH and UPS.
"Stocks to Review" (no order): FDX, AMBA, MSFT, SLB, BMBL, RDFN, NET and DT.

RECORDING LINK Friday (10/8):
Topic: DecisionPoint Diamond Mine (10/8/2021) LIVE Trading Room
Start Time : Oct 8, 2021 09:00 AM
Meeting Recording Link HERE.
Access Passcode: October@8
REGISTRATION FOR FRIDAY 10/15 Diamond Mine:
When: Oct 15, 2021 09:00 AM Pacific Time (US and Canada)
Topic: DecisionPoint Diamond Mine (10/15/2021) LIVE Trading Room
Register in advance for this webinar HERE.
Save the registration confirmation email with login instructions in case Zoom doesn't notify you in time.

Free DP Trading Room (10/11) RECORDING LINK:
Topic: DecisionPoint Trading Room
Start Time : Oct 11, 2021 09:00 AM
Meeting Recording LINK.
Access Passcode: October#11
For best results, copy and paste the access code to avoid typos.
Welcome to DecisionPoint Daily Diamonds, wherein I highlight five "Diamonds in the Rough." These are selected from the results of my DecisionPoint scans, which search for stocks that could benefit from the trend and condition of the market. Remember, these are not recommendations to buy or sell, but are the most interesting of the stocks that surfaced in my scans. My objective is to save you the work of the initial, tedious culling process, but you need to apply your own analysis to see if these stocks pique your interest as well. There are no guaranteed winners here!
Cadence Design Systems, Inc. (CDNS)
EARNINGS: 10/25/2021 (AMC)
Cadence Design Systems, Inc. engages in the design and development of integrated circuits and electronic devices. Its products include electronic design automation, software, emulation hardware, and intellectual property, commonly referred to as verification IP, and design IP. The company was founded by Alberto Sangiovanni-Vincentelli, Gudmundur A. Hjartarson, K. Bobby Chao, and K. Charles Janac in June 1988 and is headquartered in San Jose, CA.
Predefined Scans Triggered: Bullish MACD Crossovers.
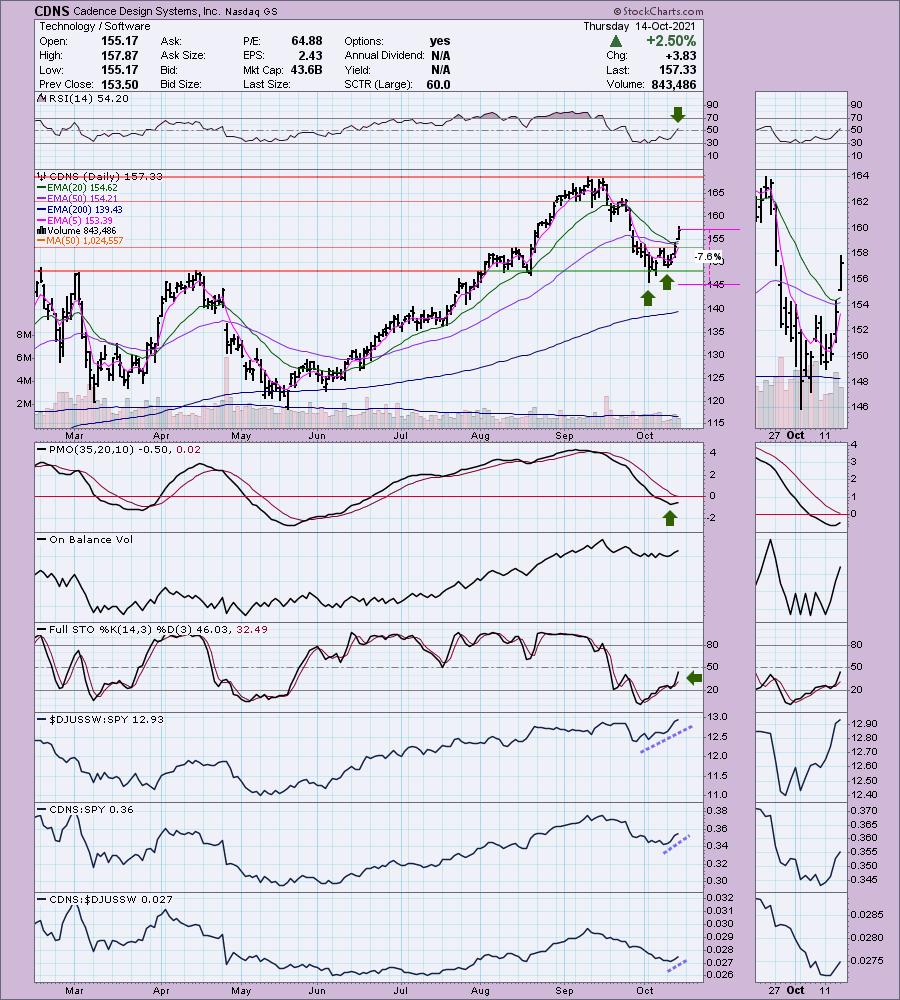
CDNS is up +0.01% in after hours trading. I've covered Cadence Design two prior times on August 20th 2020 (position hit its 7.1% stop early in September) and September 30th 2020 (timing was much better, the stop hasn't been hit so the position is up +47.5%).
I mentioned yesterday that Software had broken out. CDNS had its major breakout today. Yesterday the short-term double-bottom pattern was triggered as price moved past the confirmation line at the middle of the "W". Upside target would have price testing the next level of overhead resistance at the mid-September low and late-September high. It's a flimsy line of resistance in my estimation so I would expect a move to at least test the September highs. The RSI is now positive. The PMO is scooping up toward a crossover BUY signal in oversold territory. Stochastics are just starting to thrust upward. Relative performance is good. The stop is set beneath the first low of the double bottom.
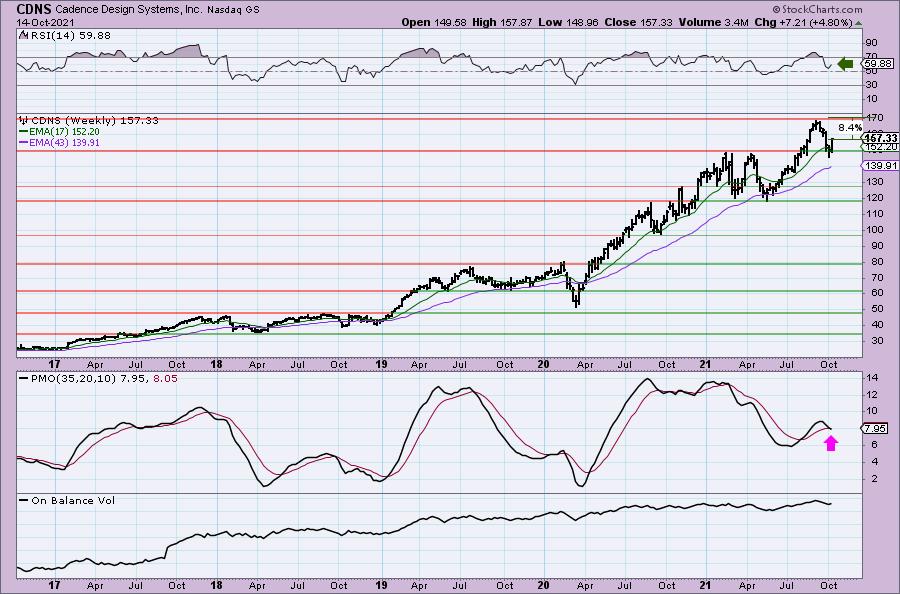
The weekly chart shows a very negative PMO, but the RSI is turning up in positive territory and is not overbought. This bounce off support at the early 2021 highs looks like a good reversal point. It's about 8% away from all-time highs, but I believe it will move even higher.
Rite Aid Corp. (RAD)
EARNINGS: 12/16/2021 (BMO)
Rite Aid Corp. engages in the ownership and management of retail drug stores. It operates through following segments: Retail Pharmacy and Pharmacy Services. The Retail Pharmacy segment includes branded and generic prescription drugs, health and beauty aids, personal care products, and walk-in retail clinics. The Pharmacy Services segment offers transparent and traditional pharmacy benefit management for insurance companies, employers, health plans, and government employee groups. The company was founded by Alex Grass on September 12, 1962 and is headquartered in Camp Hill, PA.
Predefined Scans Triggered: Elder Bar Turned Green and Bullish MACD Crossovers.
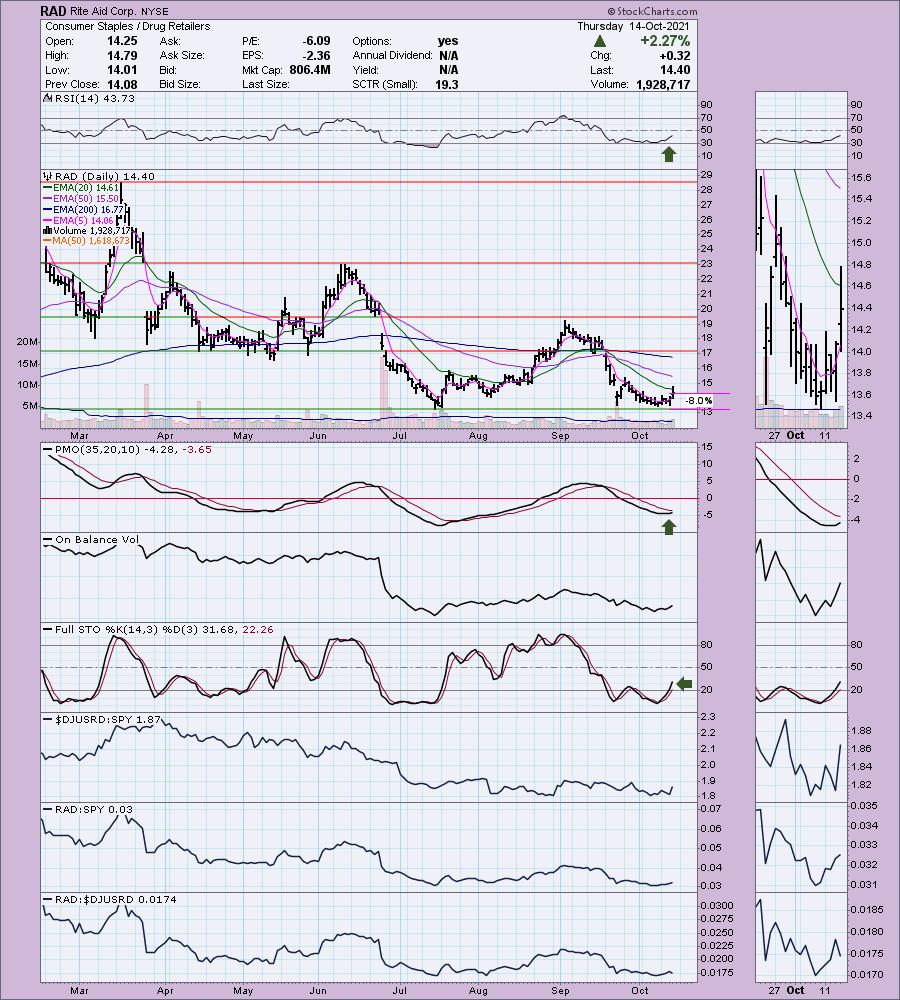
RAD is up +0.49% in after hours trading. I've covered this one multiple times in Diamonds. The April 15th 2020 Report (Timing was off by one day. 6.3% stop was hit almost immediately), June 2nd 2020 Report (Was up 53% before it backed down and triggered the 9.9% stop) and again on June 25th 2020 as a reader request (It rose about 14.5% and then later triggered the stop at $14). The last time was on March 11th 2021 (the position was up over 15% and then pulled back and triggered the 9% stop).
So this on has been on my radar plenty of times. I was happy to see it as a reader request, especially given the bullish chart and setup. This is the first "rad" reader request. Price is beginning to form at cup shaped bottom. Today it popped above the 20-EMA briefly. The RSI is negative but rising. The PMO has bottomed and is rising toward a crossover BUY signal. Stochastics look favorable as we are starting to see it rise. Relative performance is flat, but acceptable. I set the 8% stop just below resistance.
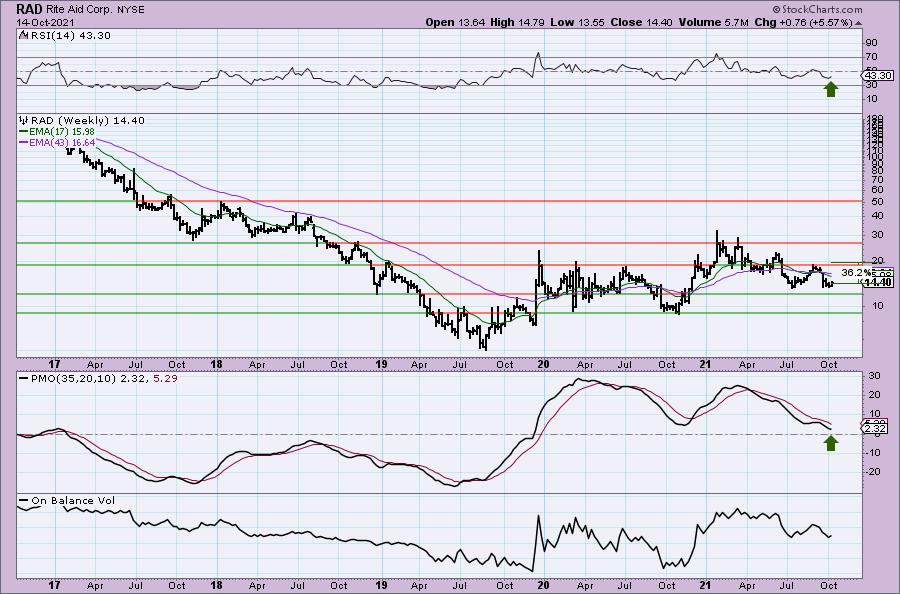
It's way too early, but we could be seeing a bullish double-bottom forming. I must note that I used a log scale weekly chart so we could better see price movement. Remember these are great, but trendlines aren't always accurate on a log scale chart when converted back to an arithmetic chart. The weekly PMO is negative but has turned up. The weekly PMO is already decelerating. The upside potential is excellent even if it just manages to hit resistance at the June top. If it can breakout from there and reach the next area of overhead resistance, that would be an almost 80% gain.
RadNet, Inc. (RDNT)
EARNINGS: 11/8/2021 (BMO)
RadNet, Inc. provides freestanding, fixed-site outpatient diagnostic imaging services in the United States. Its centers provide physicians with imaging capabilities to facilitate the diagnosis and treatment of diseases and disorders and reduce unnecessary invasive procedures. The firm offers magnetic resonance imaging, computed tomography, positron emission tomography, nuclear medicine, mammography, ultrasound, diagnostic radiology, fluoroscopy, and other related procedures. RadNet was founded by Howard G. Berger in 1980 and is headquartered in Los Angeles, CA.
Predefined Scans Triggered: Elder Bar Turned Green, Parabolic SAR Buy Signals, P&F Triple Bottom Breakdown and P&F Double Bottom Breakout.
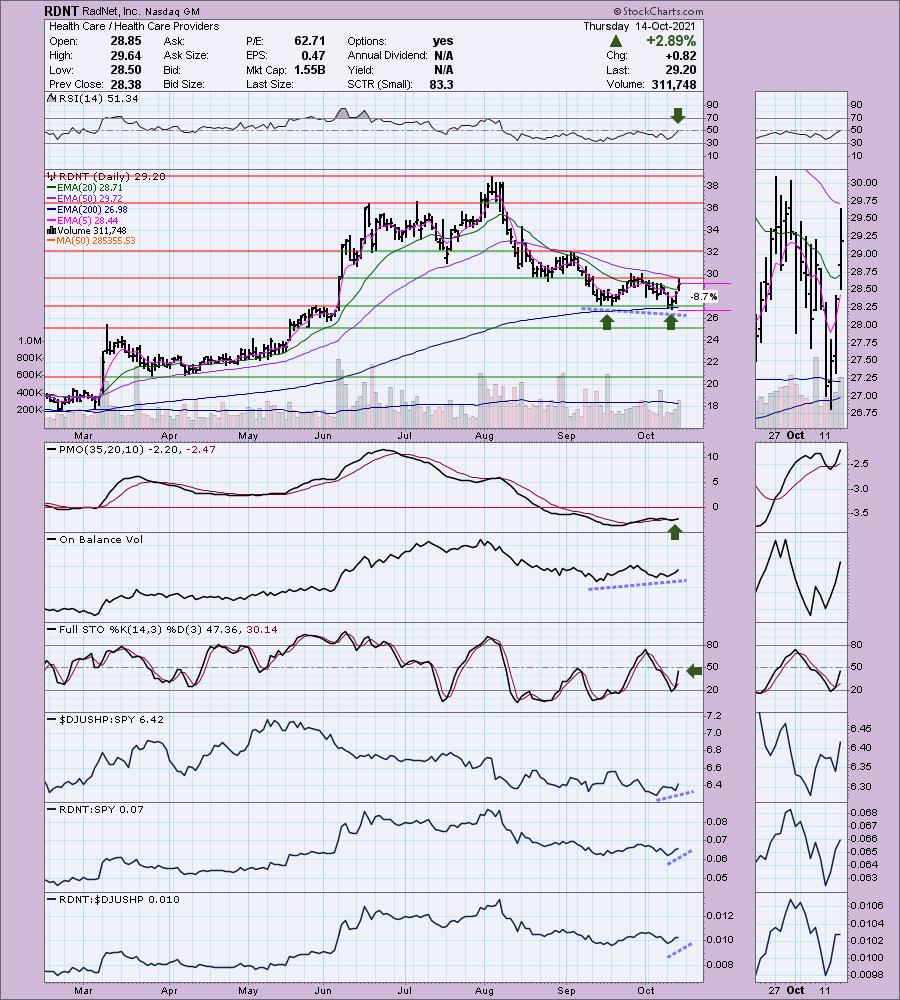
RDNT is unchanged in after hours trading. This is the second "rad" stock, RadNet Inc. Love this chart. Price has formed a bullish double-bottom and is ready to trigger it. The RSI is positive now and the PMO has whipsawed into a BUY signal. There is an OBV positive divergence between OBV lows and price bottoms. Stochastics have just started moving up. Relative performance is improving. The stop is set below the double-bottom pattern.
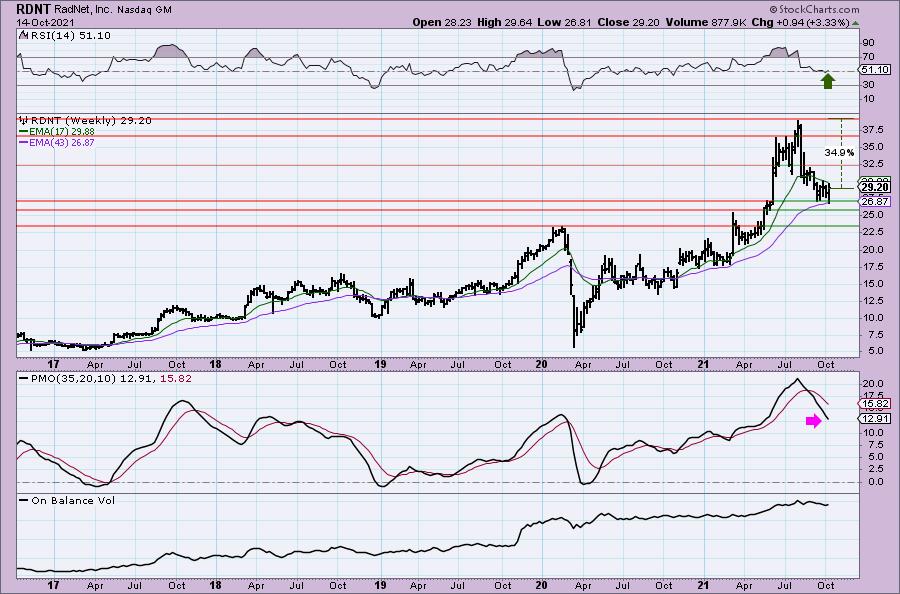
Ugly weekly PMO that is on a SELL signal. It isn't decelerating. Price is finding support, but hasn't yet broken the declining trend. If it can reverse on the 43-week EMA, upside potential is almost 35%.
UMH Properties, Inc. (UMH)
EARNINGS: 11/3/2021 (AMC)
UMH Properties, Inc. operates as a real estate investment trust. It engages in the ownership and operation of manufactured home communities. The firm also leases manufactured home sites to private manufactured home owners. It designs accommodate detached, single-family manufactured homes which are produced off-site by manufacturers and installed on sites within the communities. The company was founded by Eugene W. Landy in 1968 and is headquartered in Freehold, NJ.
Predefined Scans Triggered: Bullish MACD Crossovers, P&F Ascending Triple Top Breakout and P&F Double Top Breakout.
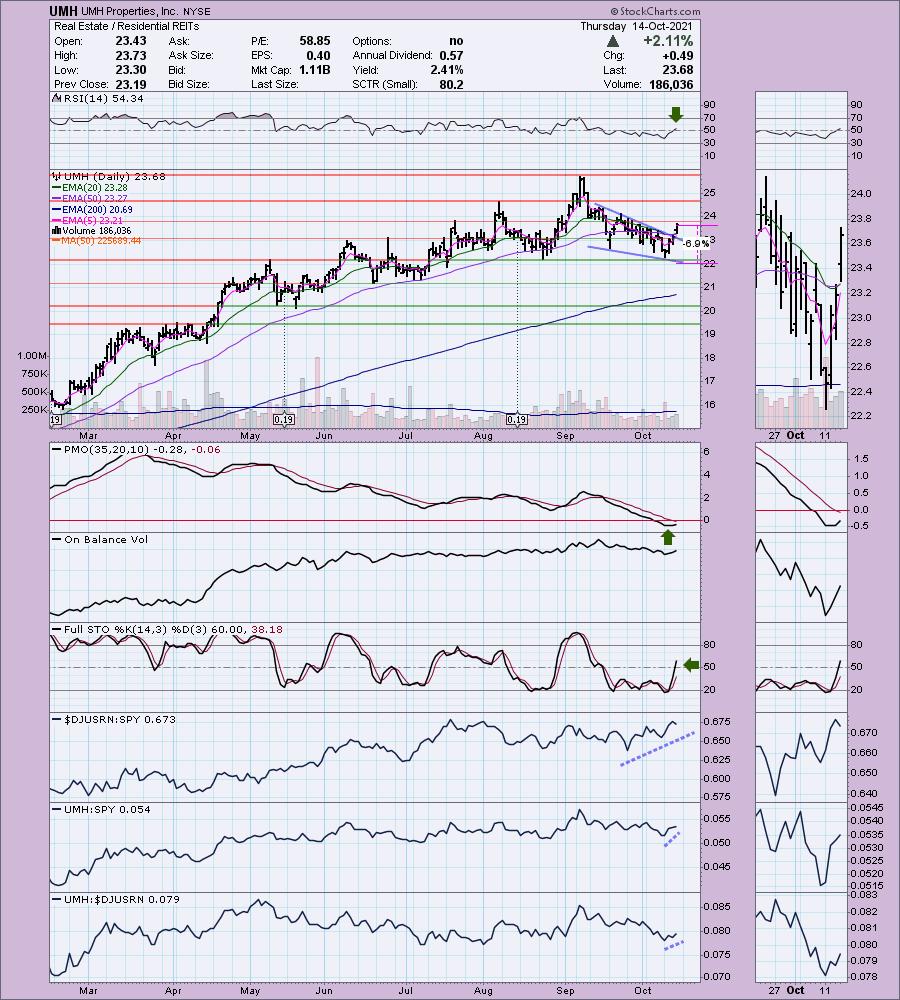
UMH is unchanged in after hours trading. Price just broke out of a bullish falling wedge. The RSI is now in positive territory. The PMO has turned up in oversold territory and is heading toward a crossover BUY signal. Stochastics are rising strongly. Relative performance is increasing. The stop is set below support at the October low.
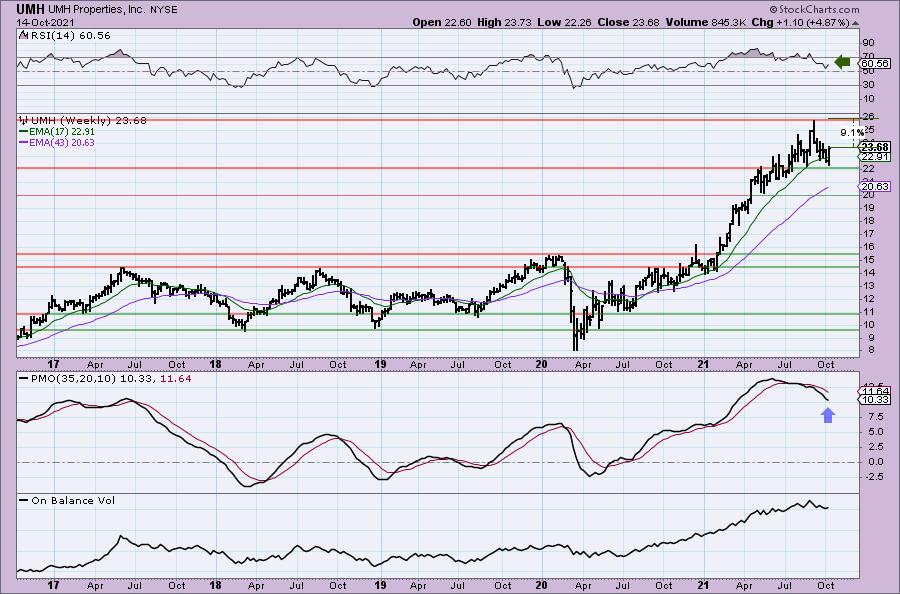
The weekly chart is somewhat positive. The weekly RSI is in positive territory and it appears that the PMO may be decelerating somewhat. I don't like the toppy look of price here. If we do get the reversal that the daily chart suggests we will, it is 9.1% away from all-time highs. I would expect a breakout if the PMO turns up.
United Parcel Service, Inc. (UPS)
EARNINGS: 10/26/2021 (BMO)
United Parcel Service, Inc. operates as a logistics and package delivery company that provides supply chain management services. Its logistics services include transportation, distribution, contract logistics, ground freight, ocean freight, air freight, customs brokerage, insurance, and financing. The firm operates through the following segments: U.S. Domestic Package, International Package, and Supply Chain and Freight. The U.S. Domestic Package segment offers a full spectrum of U.S. domestic air and ground package transportation services. The International Package segment consists of small package operations in Europe, Asia Pacific, Canada, Latin America and the Indian sub-continent, Middle East and Africa (ISMEA) and offers a selection of day and time definite international shipping services. The Supply Chain & Freight consists of forwarding, truckload brokerage, logistics, UPS Freight, UPS Capital and other businesses. The company was founded by James E. Casey and Claude Ryan on August 28, 1907 and is headquartered in Atlanta, GA.
Predefined Scans Triggered: None.
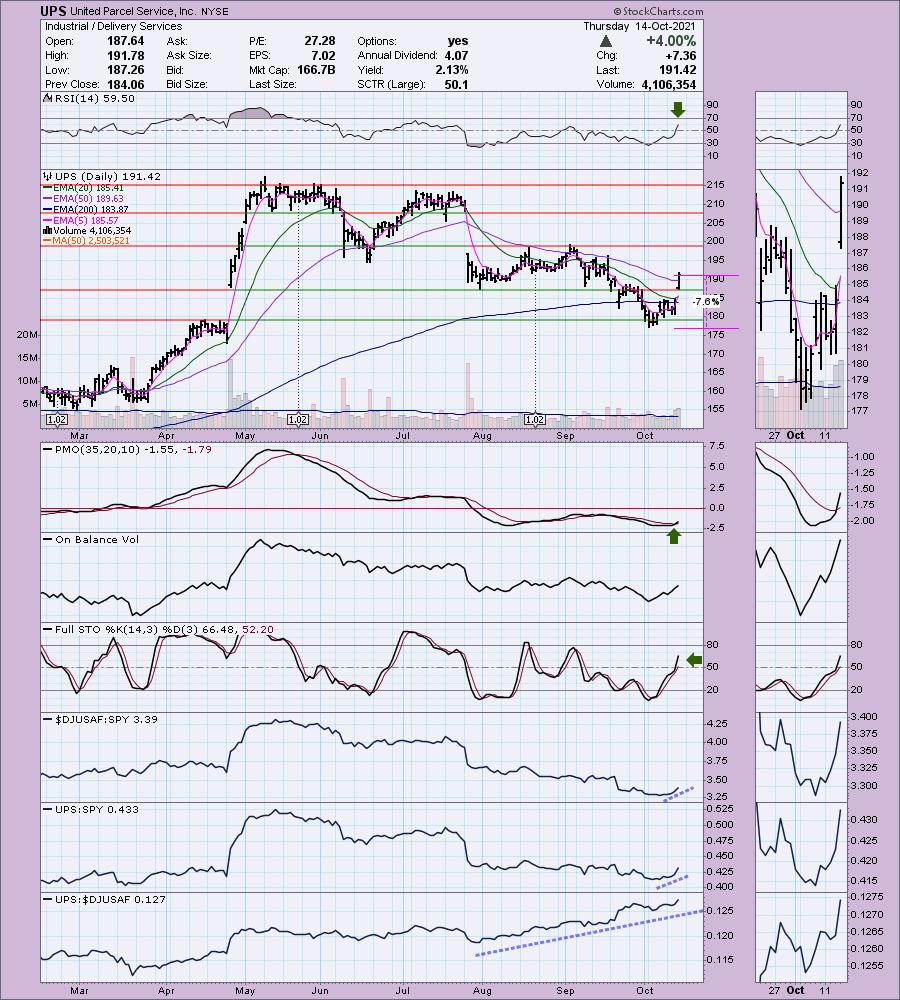
UPS is up +0.19% in after hours trading. I covered it on July 6th 2021. The gap down in late July had the 8% stop hit. Right now we have a strong breakout above both the 20/50-EMAs. Additionally, we have a new ST Trend Model "Bronze Cross" BUY signal on the 5/20-EMA positive crossover. The RSI is in positive territory. The PMO just triggered a crossover BUY signal. Stochastics are rising and aren't overbought yet. Relative performance is increasing on the industry group and UPS is one of the clear leaders in that group. The stop is reasonable at 7.6%.
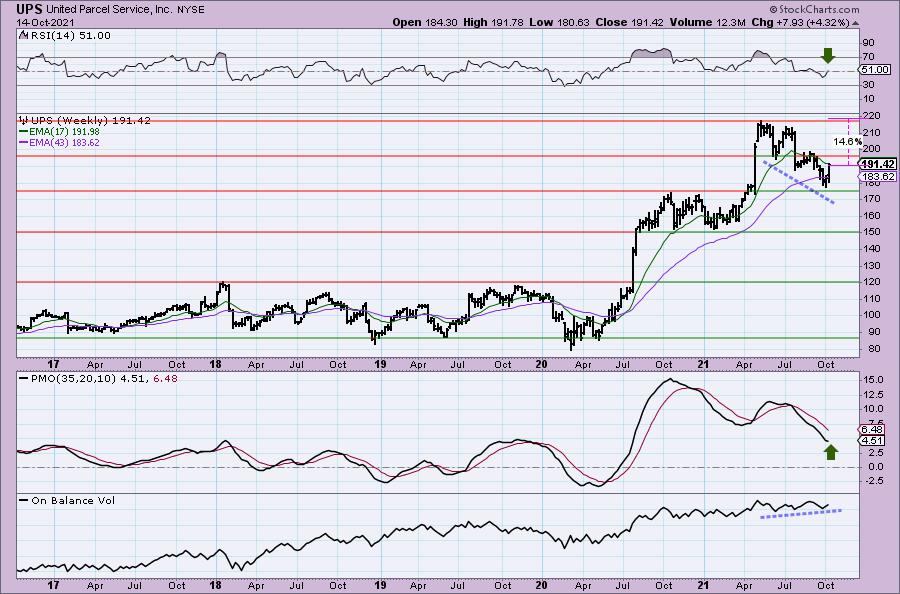
The weekly PMO is turning up already. The weekly RSI just hit positive territory and we have strong positive OBV divergence. If it can reach prior all-time highs, that would be an over 14% gain.
Don't forget, on Thursdays I look at reader-requested symbols, click HERE to shoot me an email. I read every email I receive and try to answer them all!
Current Market Outlook:
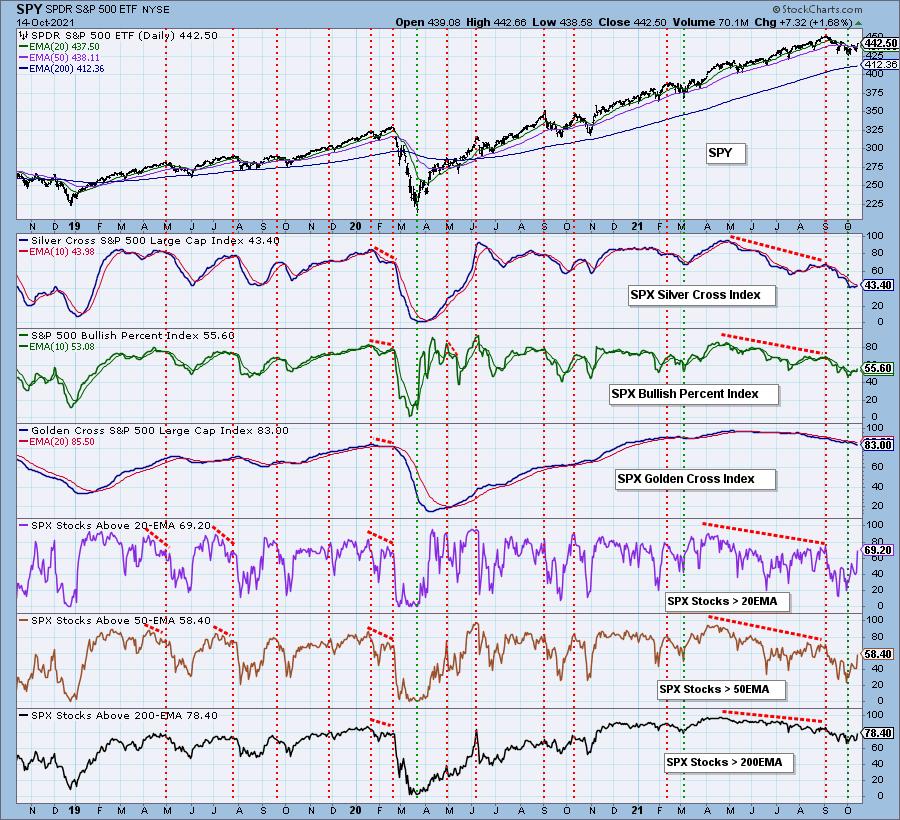
Market Environment: It is important to consider the odds for success by assessing the market tides. The following chart uses different methodologies for objectively showing the depth and trend of participation for intermediate- and long-term time frames.
- The Silver Cross Index (SCI) shows the percentage of SPX stocks on IT Trend Model BUY signals (20-EMA > 50-EMA)
- The Golden Cross Index (GCI) shows the percentage of SPX stocks on LT Trend Model BUY signals (50-EMA > 200-EMA)
- The Bullish Percent Index (BPI) shows the percentage of SPX stocks on Point & Figure BUY signals.
Don't forget that as a "Diamonds" member, you have access to our GCI/SCI curated ChartList on DecisionPoint.com. You'll find it under "Members Only" links on the left side on the Blogs and Links Page.
Here is the current chart:
Full Disclosure: I'm back to 70% invested and 30% is in 'cash', meaning in money markets and readily available to trade with. I added two positions this morning after closing a position yesterday.
I'm required to disclose if I currently own a stock and if I may buy it within the next 72 hours.
Technical Analysis is a windsock, not a crystal ball.
Happy Charting!
- Erin
erin@decisionpoint.com
Watch the latest episode of DecisionPoint with Carl & Erin Swenlin on Mondays 7:00p EST or on the DecisionPoint playlist on the StockCharts TV YouTube channel here!
NOTE: The stocks reported herein are from mechanical trading model scans that are based upon moving average relationships, momentum and volume. DecisionPoint analysis is then applied to get five selections from the scans. The selections given should prompt readers to do a chart review using their own analysis process. This letter is not a call for a specific action to buy, sell or short any of the stocks provided. There are NO sure things or guaranteed returns on the daily selection of "Diamonds in the Rough."
Helpful DecisionPoint Links:
DecisionPoint Shared ChartList and DecisionPoint Chart Gallery
Price Momentum Oscillator (PMO)
Swenlin Trading Oscillators (STO-B and STO-V)
For more links, go to DecisionPoint.com