
It wasn't a surprise to see scan results skewing toward the Financial sector. Why? XLF finished up over 1.5% today, second only to Energy (XLE) which was up over 3%. Since my scans are set up to find new momentum, they will generally follow sector rotation in the very short term.
I like the "Diamonds in the Rough", but I still am exercising caution on my own portfolio. Interestingly, none of my stops have been triggered so my exposure remains at 75%. I certainly have money to open my exposure further, but this is my limit given my somewhat bearish market outlook.
At the same time, DP Alert subscribers will hear that the VIX is high enough to look for a very short-term reversal, especially given the SPY is sitting on the 20-EMA. However, the key identifier is "very short-term". Any bump we get out of bearish sentiment will not likely last very long.
Don't forget! This week's Diamond Mine trading room will be TOMORROW, WEDNESDAY at Noon ET. The link to sign up is below.
Today's "Diamonds in the Rough": BBL, CLH, DFS, MS and WLTW.
A few "Stocks to Review": FBC, NOC, RFP and SLX.

RECORDING LINK Friday (11/19):
Topic: DecisionPoint Diamond Mine (11/19/2021) LIVE Trading Room
Start Time: Nov 19, 2021 09:00 AM
Meeting Recording Link.
Access Passcode: November$19
REGISTRATION FOR ** WEDNESDAY ** 11/24 Diamond Mine:
When: Nov 24, 2021 09:00 AM Pacific Time (US and Canada)
Topic: DP Diamond Mine (WEDNESDAY 11/24/2021) LIVE Trading Room
Register in advance for this webinar HERE.
Save the registration confirmation email with login instructions in case Zoom doesn't notify you in time.

Free DP Trading Room (11/22) RECORDING LINK:
Topic: DecisionPoint Trading Room
Start Time: Nov 22, 2021 09:00 AM
Meeting Recording Link.
Access Passcode: November@22
For best results, copy and paste the access code to avoid typos.
Welcome to DecisionPoint Daily Diamonds, wherein I highlight five "Diamonds in the Rough." These are selected from the results of my DecisionPoint scans, which search for stocks that could benefit from the trend and condition of the market. Remember, these are not recommendations to buy or sell, but are the most interesting of the stocks that surfaced in my scans. My objective is to save you the work of the initial, tedious culling process, but you need to apply your own analysis to see if these stocks pique your interest as well. There are no guaranteed winners here!
BHP Billiton plc (BBL)
EARNINGS: 2/14/2022
BHP Group Plc engages in the exploration, development, production, processing and marketing of minerals, and oil and gas. It operates through the following segments: Petroleum, Copper, Iron Ore, and Coal. The Petroleum segment focuses on exploration, development, and production of oil and gas. The Copper segment includes mining of copper, silver, lead, zinc, molybdenum, uranium, and gold. The Iron Ore segment focuses only on mining of iron ore. The Coal segment is the mining of metallurgical coal and thermal energy coal. The company was founded on June 29, 2001 and is headquartered in London, the United Kingdom.
Predefined Scans Triggered: Bullish MACD Crossovers, Parabolic SAR Buy Signals, New CCI Buy Signals and Entered Ichimoku Cloud.
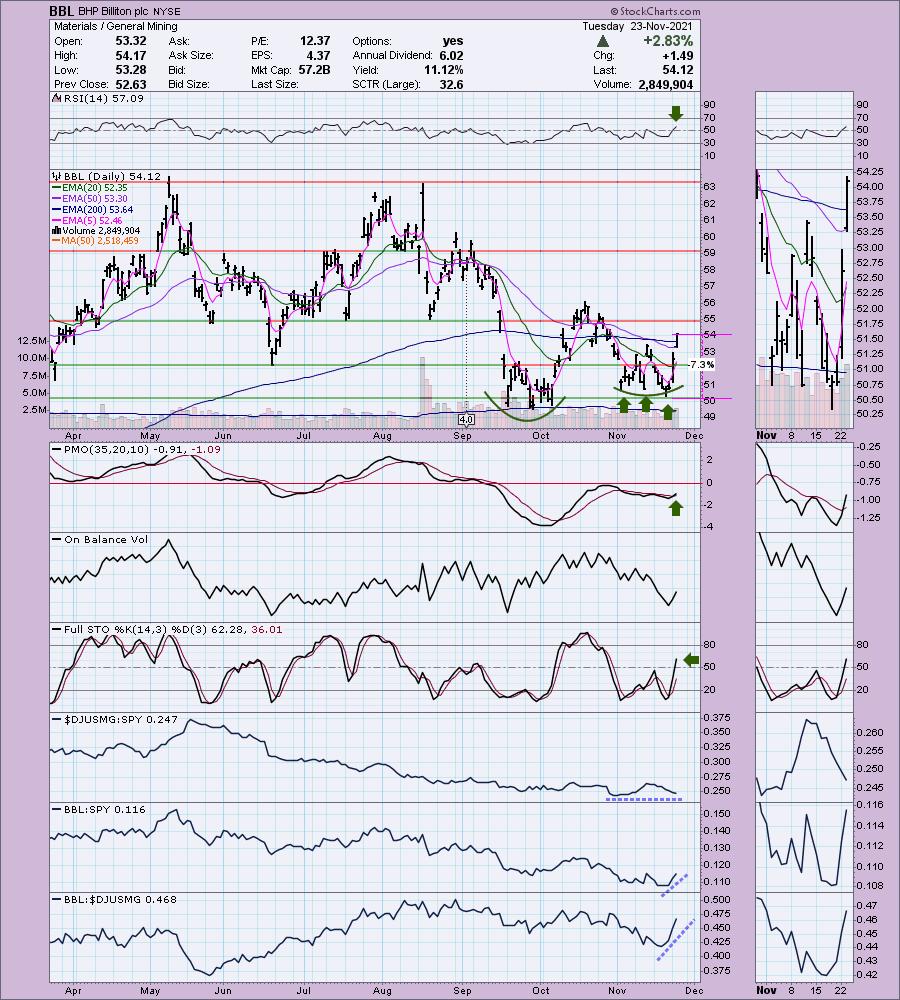
BBL is unchanged in after hours trading. Gold Miners (GDX) are pulling back and while this isn't a Gold Miner, I still would be careful. The triple-bottom on BBL in the short term and intermediate term double-bottom sold me on presenting this one. First we have the short-term double-bottom that has formed this month. You'll see the intermediate-term double-bottom best on the weekly chart, but I've annotated it on the daily chart as well. The RSI has moved into positive territory and the PMO triggered a crossover BUY signal today. Stochastics are rising strongly and relative strength is good for BBL, although like Gold Miners, the group is losing relative strength. The stop is set below the short-term triple-bottom.
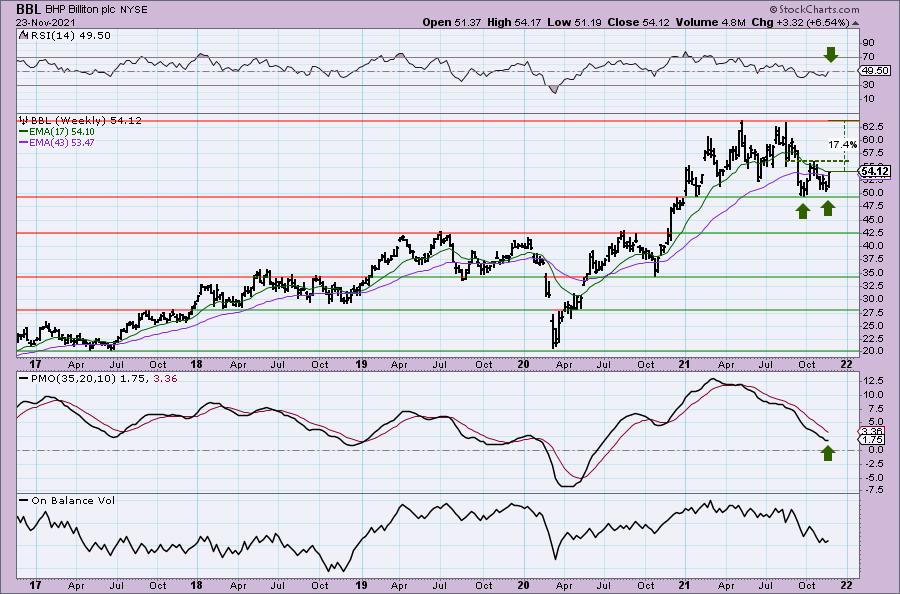
The double-bottom on the weekly chart is very nice and if it is confirmed, the minimum upside target would take price back to new all-time highs. The weekly RSI is almost in positive territory and the weekly PMO is decelerating.
Clean Harbors, Inc. (CLH)
EARNINGS: 2/23/2022 (BMO)
Clean Harbors, Inc. engages in the provision of environmental, energy, and industrial services. It operates through the Environmental Services and Safety-Kleen business segments. The Environmental Services segment consists of the technical services; industrial services; field services; and oil, gas, and lodging businesses. The Safety-Kleen segment includes parts washer services, containerized waste services, vac services, used motor oil collection, and sale of base and blended oil products. The company was founded by Alan S. McKim in 1980 and is headquartered in Norwell, MA.
Predefined Scans Triggered: None.
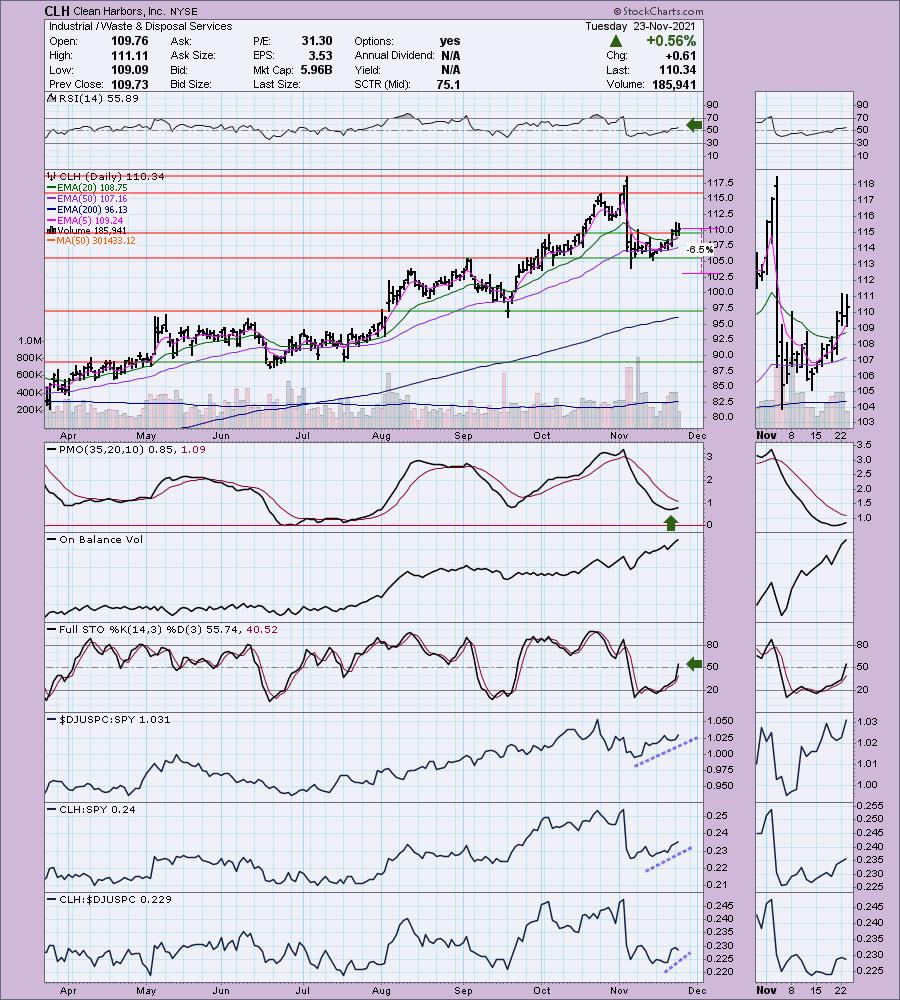
CLH is unchanged in after hours trading. Price has now successfully tested the 50-EMA and has moved above the 20-EMA. The RSI is positive and the PMO is rising again from oversold territory, but above the zero line. Volume is coming in, but there is a reverse divergence with the OBV. Tops on the OBV are continuing to rise, but price hasn't reached above the November top. So, while volume is coming in, it hasn't pushed price back to all-time highs. It's forgivable, but had to be pointed out. Relative strength studies are positive. The stop can be set at 6.5% below the November low, or you could tighten it to bring it closer to the 50-EMA.
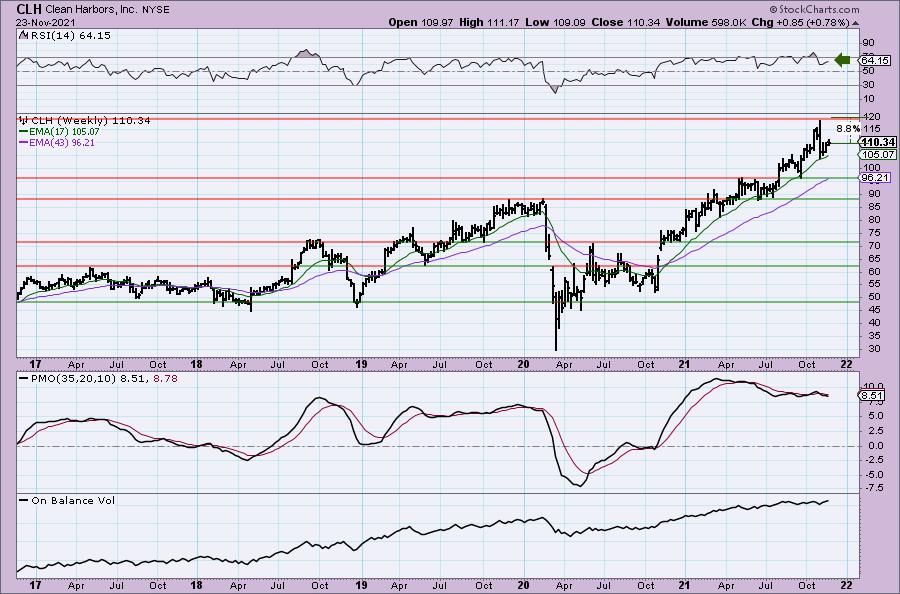
The weekly chart shows an RSI that is positive and not overbought. The weekly PMO is flat because price is rising at a steady pace, so while it is in overbought territory, it suggests that the steady rising trend will continue. It's only about 8.5% away from its all-time high so I'd consider an upside target of 16% at $128.
Discover Financial Services (DFS)
EARNINGS: 1/19/2022 (AMC)
Discover Financial Services is a holding company, which engages in the provision of direct banking and payment services. It operates through the Direct Banking and Payment Services segments. The Direct Banking segment offers Discover-branded credit cards issued to individuals on the Discover Network and other consumer products and services, including private student loans, personal loans, home loans, and other consumer lending and deposit products. The Payment Services segment includes PULSE, Diners Club, and the company's network partners business, which includes credit, debit, and prepaid cards issued on the Discover Network. The company was founded in 1986 and is headquartered in Riverwoods, IL.
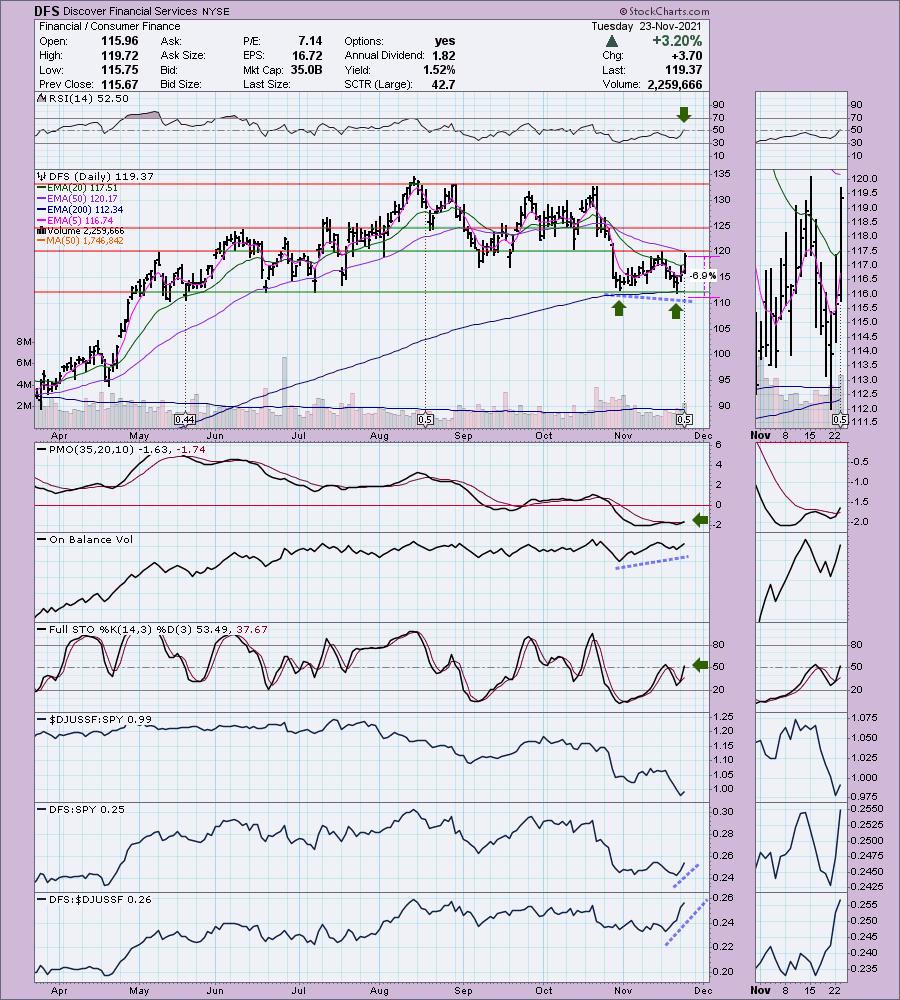
Predefined Scans Triggered: Elder Bar Turned Green, New CCI Buy signals, Moved Above Upper Bollinger Band and Parabolic SAR Buy Signals.
DFS is unchanged in after hours trading. This is a beat down industry group, but notice that DFS has not only been outperforming the group (moving lower at a slower pace mostly), it more importantly is outperforming the SPY on this rally. There is a bullish double-bottom forming. The two bottoms are in a positive divergence with the OBV which implies a breakout ahead. The PMO generated a crossover BUY signal today and the RSI just entered positive territory. Stochastics are rising again and those bottoms are also showing a positive divergence with price bottoms. They have also reached above net neutral (50). The stop was easy to set just below the double-bottom pattern.
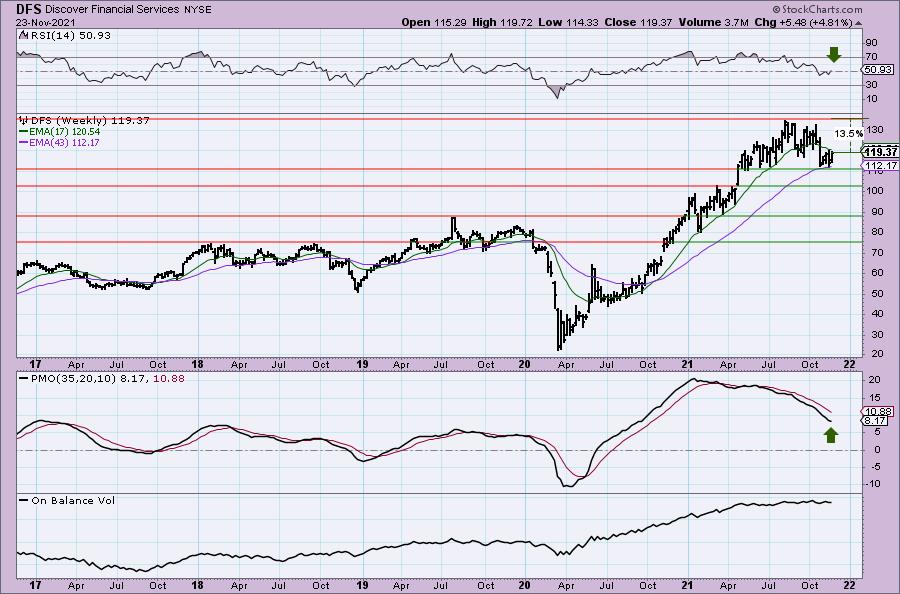
The chart shows us the importance of the support level that price is currently holding at the spring lows and 43-week EMA. The weekly RSI just hit positive territory and the weekly PMO is turning back up. If it reaches all-time highs again that would be a 13.5% gain.
Morgan Stanley (MS)
EARNINGS: 1/13/2022 (BMO)
Morgan Stanley operates as a global financial services company. The firm provides investment banking products and services to its clients and customers including corporations, governments, financial institutions, and individuals. It operates through the following segments: Institutional Securities, Wealth Management, and Investment Management. The Institutional Services segment provides financial advisory, capital-raising services, and related financing services on behalf of institutional investors. The Wealth Management segment offers brokerage and investment advisory services covering various types of investments, including equities, options, futures, foreign currencies, precious metals, fixed-income securities, mutual funds, structured products, alternative investments, unit investment trusts, managed futures, separately managed accounts, and mutual fund asset allocation programs. The Investment Management segment provides equity, fixed income, alternative investments, real estate, and merchant banking strategies. The company was founded by Harold Stanley and Henry S. Morgan in 1924 and is headquartered in New York, NY.
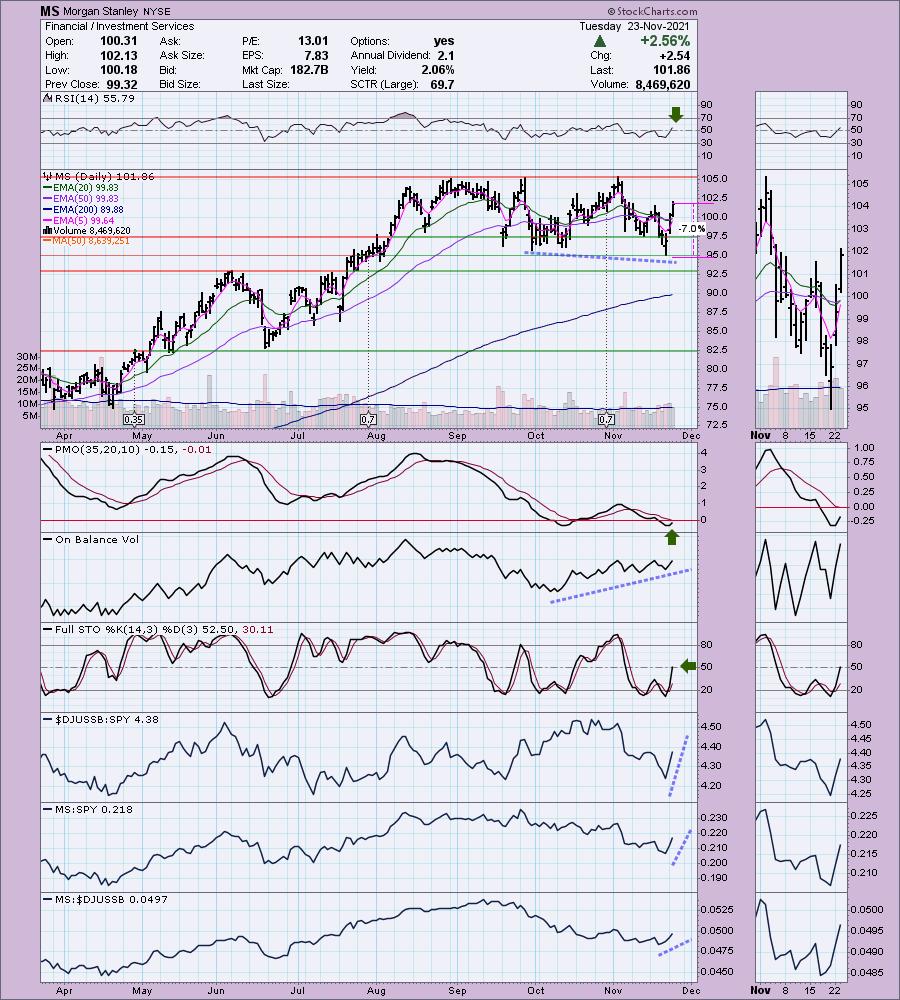
Predefined Scans Triggered: Moved Above Ichimoku Cloud and Parabolic SAR Buy Signals.
MS is down -0.26% in after hours trading. I covered MS in the July 1st 2021 Diamonds Report. The stop has never been hit so the position is currently up +10.7%. The chart is really shaping up but there is serious overhead resistance at the all-time highs. The positive indicators suggest it won't be a problem. The RSI just entered positive territory above net neutral (50). The PMO has turned up in oversold territory. There is a positive OBV divergence between OBV bottoms and price bottoms. These divergences usually lead to extended rallies. Stochastics are rising and just hit positive territory today. Relative strength studies are bullish. The stop is set below the intraday low from last week.
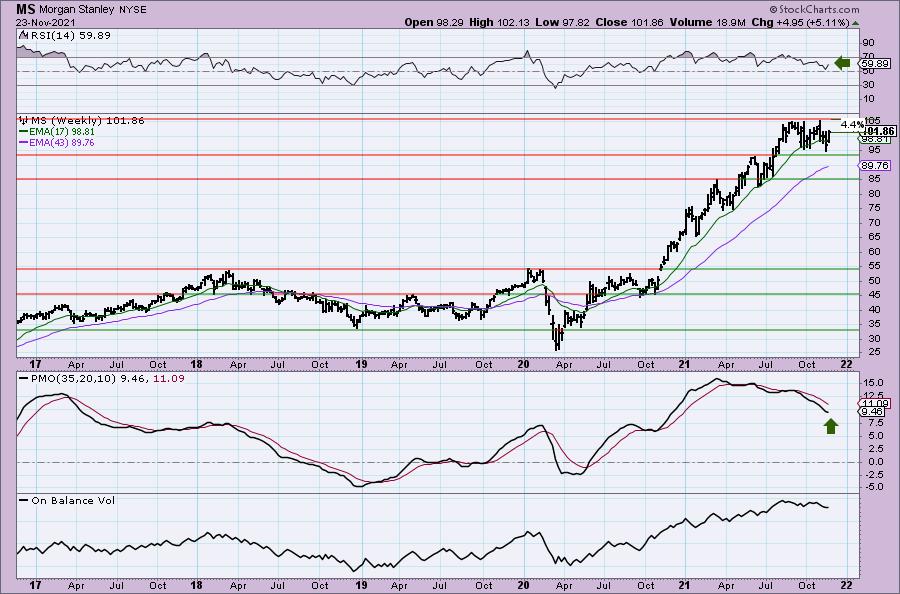
The weekly RSI is positive and the weekly PMO is attempting to form a bottom. It's only about 4.4% away from its all-time high, so I'd set my upside target at 16% around $118.15.
Willis Towers Watson Public Ltd. Co. (WLTW)
EARNINGS: 2/10/2022 (BMO)
Willis Towers Watson Plc engages in the provision of advisory, broking, and solutions services. It operates through the following segments: Human Capital and Benefits (HCB); Corporate Risk and Broking (CRB); Investment, Risk and Reinsurance (IRR); and Benefits Delivery and Administration (BDA). The HCB segment provides advice, broking, solutions, and software for employee benefit plans, the human resources organizations, and the management teams. The CRB segment offers a range of risk advice, insurance brokerage, and consulting services to clients ranging from small businesses to corporations. The IRR segment focuses in helping clients free up capital and manage investment complexity. The BDA segment covers medical and ancillary benefit exchange and outsourcing services to active employees and retirees across both the group and individual markets. The company was founded in 1828 and is headquartered in London, United Kingdom.
Predefined Scans Triggered: P&F High Pole and Bullish MACD Crossovers.
WLTW is unchanged in after hours trading. I like the bounce off the 200-EMA and that price has closed above both the 20/50-EMAs. The RSI just hit positive territory and the PMO has turned up. We have another positive OBV divergence (I love seeing these). Stochastics are rising strongly in positive territory. Relative strength shows us that the industry group is performing well against the SPY. WLTW is beginning to outperform both. The stop can be set thinly at -5.8% below support at the June/September lows.
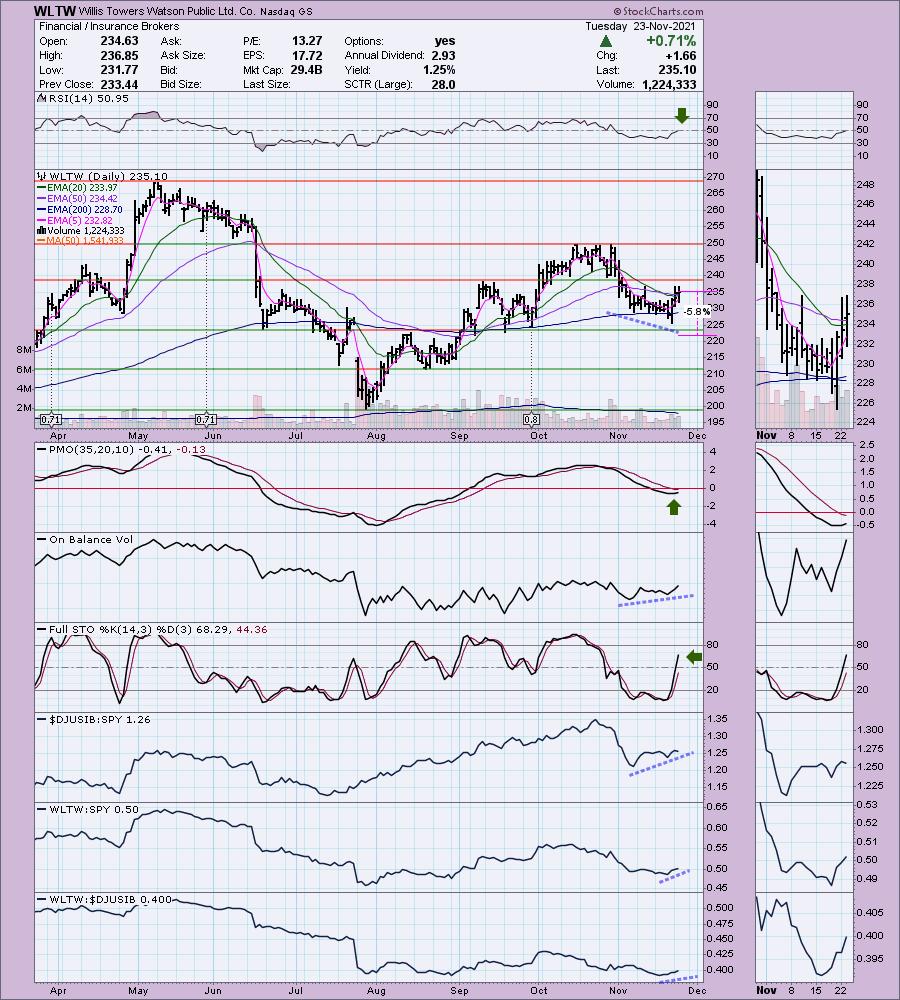
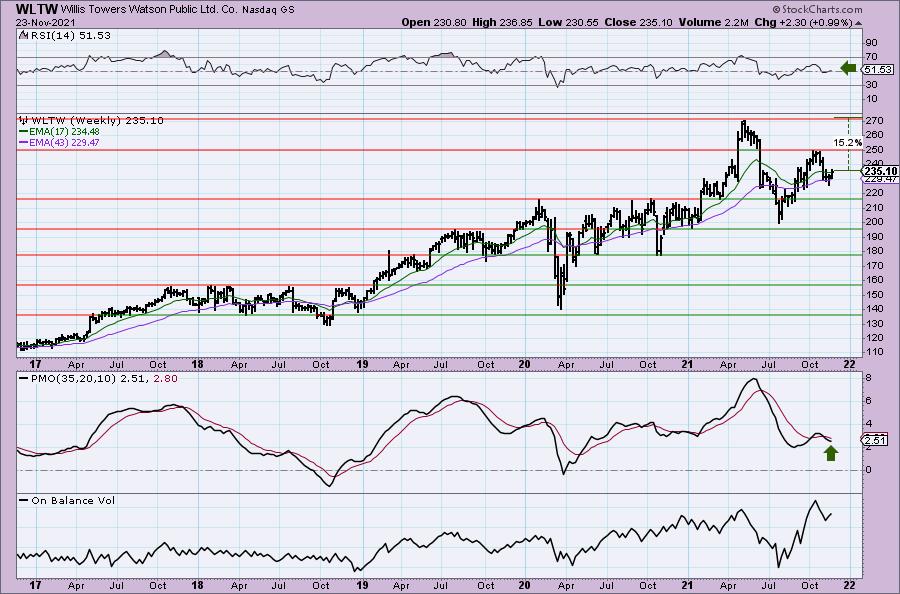
The weekly chart displays a positive RSI. The weekly PMO is decelerating but hasn't actually turned up yet. Upside target is new all-time highs about +15% away.
Don't forget, on Thursdays I look at reader-requested symbols, click HERE to shoot me an email. I read every email I receive and try to answer them all!
Current Market Outlook:
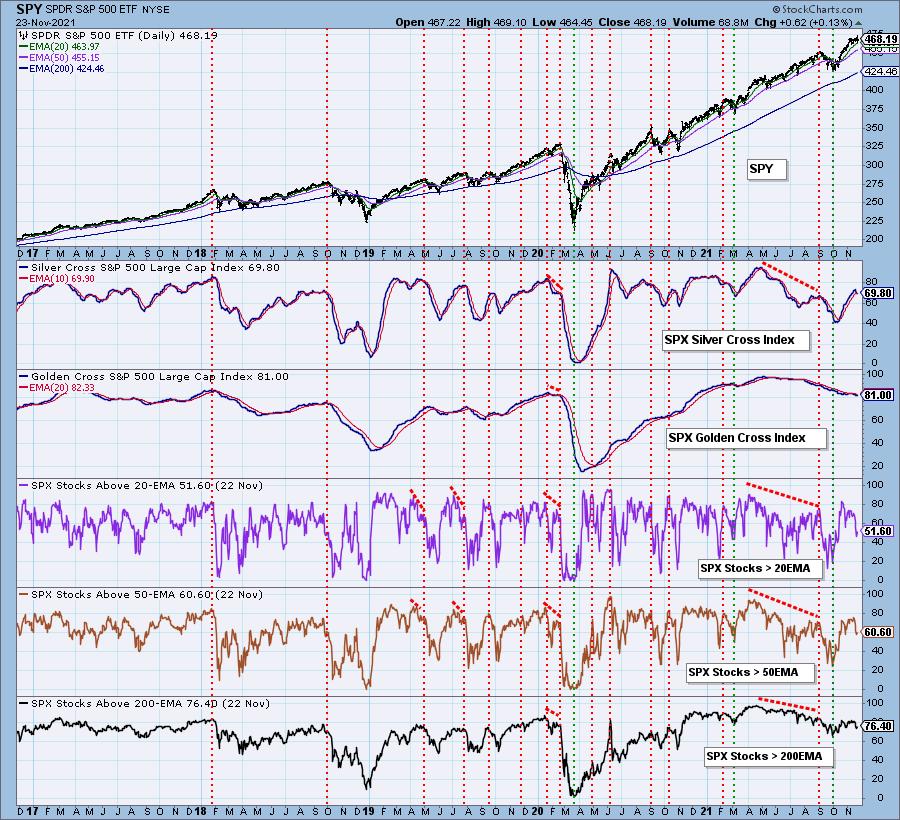
Market Environment: It is important to consider the odds for success by assessing the market tides. The following chart uses different methodologies for objectively showing the depth and trend of participation for intermediate- and long-term time frames.
- The Silver Cross Index (SCI) shows the percentage of SPX stocks on IT Trend Model BUY signals (20-EMA > 50-EMA)
- The Golden Cross Index (GCI) shows the percentage of SPX stocks on LT Trend Model BUY signals (50-EMA > 200-EMA)
- The Bullish Percent Index (BPI) shows the percentage of SPX stocks on Point & Figure BUY signals.
Don't forget that as a "Diamonds" member, you have access to our GCI/SCI curated ChartList on DecisionPoint.com. You'll find it under "Members Only" links on the left side on the Blogs and Links Page.
Here is the current chart:
Full Disclosure: I'm 75% invested and 25% is in 'cash', meaning in money markets and readily available to trade with.
I'm required to disclose if I currently own a stock and/or may buy it within the next 72 hours.
Technical Analysis is a windsock, not a crystal ball.
Happy Charting!
- Erin
erin@decisionpoint.com
Watch the latest episode of DecisionPoint with Carl & Erin Swenlin on Mondays 7:00p EST or on the DecisionPoint playlist on the StockCharts TV YouTube channel here!
NOTE: The stocks reported herein are from mechanical trading model scans that are based upon moving average relationships, momentum and volume. DecisionPoint analysis is then applied to get five selections from the scans. The selections given should prompt readers to do a chart review using their own analysis process. This letter is not a call for a specific action to buy, sell or short any of the stocks provided. There are NO sure things or guaranteed returns on the daily selection of "Diamonds in the Rough."
Helpful DecisionPoint Links:
DecisionPoint Shared ChartList and DecisionPoint Chart Gallery
Price Momentum Oscillator (PMO)
Swenlin Trading Oscillators (STO-B and STO-V)
For more links, go to DecisionPoint.com