
Reader requests were pretty good, but I am still not in favor of expanding exposure. Big reason would be the diminishing participation within the major indexes. It's going to get harder and harder to find solid winners as there are fewer to pick from.
Today's requests primarily come from Consumer Discretionary (XLY). This sector is healthier than most, but I have to wonder if these will be the first to pullback hard when the market does. Just be careful out there!
Tomorrow is the Diamond Mine trading room! Click here to register or the link below. See you in the room!
Today's "Diamonds in the Rough": AEO, DCBO, GLBE, LCID and WST.

RECORDING LINK Friday (11/12):
Topic: DecisionPoint Diamond Mine (11/12/2021) LIVE Trading Room
Start Time: Nov 12, 2021 09:00 AM
Meeting Recording Link HERE.
Access Passcode: November@12
REGISTRATION FOR FRIDAY 11/19 Diamond Mine:
When: Nov 19, 2021 09:00 AM Pacific Time (US and Canada)
Topic: DecisionPoint Diamond Mine (11/19/2021) LIVE Trading Room
Register in advance for this webinar HERE.
Save the registration confirmation email with login instructions in case Zoom doesn't notify you in time.

Free DP Trading Room (11/8) RECORDING LINK (There was no trading room on 11/15):
Topic: DecisionPoint Trading Room
Start Time: Nov 8, 2021 08:57 AM
Meeting Recording Link HERE.
Access Passcode: November%8
For best results, copy and paste the access code to avoid typos.
Welcome to DecisionPoint Daily Diamonds, wherein I highlight five "Diamonds in the Rough." These are selected from the results of my DecisionPoint scans, which search for stocks that could benefit from the trend and condition of the market. Remember, these are not recommendations to buy or sell, but are the most interesting of the stocks that surfaced in my scans. My objective is to save you the work of the initial, tedious culling process, but you need to apply your own analysis to see if these stocks pique your interest as well. There are no guaranteed winners here!
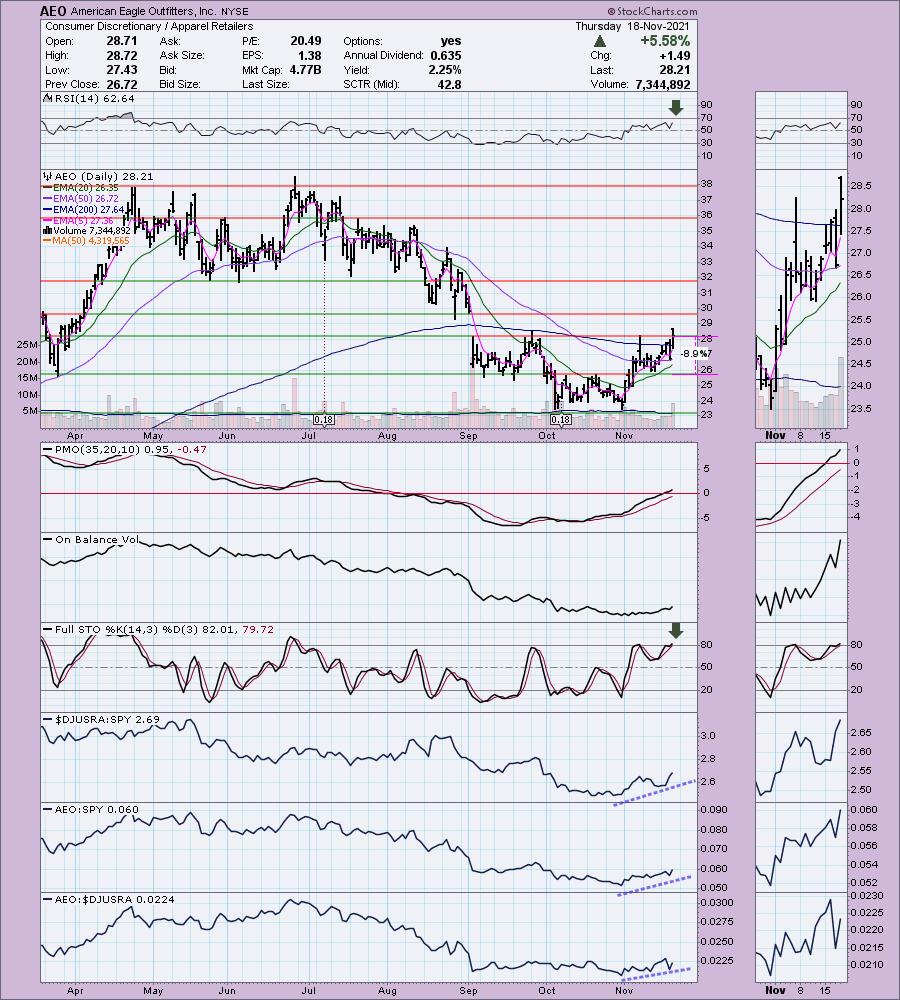
American Eagle Outfitters, Inc. (AEO)
EARNINGS: 11/23/2021 (BMO)
American Eagle Outfitters, Inc. is a multi-brand specialty retailer, which offers an assortment of apparel and accessories for men and women under the American Eagle Outfitters brand, and intimates, apparel and personal care products for women under the Aerie brand. The firm operates stores in the United States, Canada, Mexico, Hong Kong, China and the United Kingdom. It also acquired two emerging brands to complement its existing brands, Tailgate, a vintage sports-inspired apparel brand, and Todd Snyder New York, a premium menswear brand. The company was founded in 1977 and is headquartered in Pittsburgh, PA.
Predefined Scans Triggered: Elder Bar Turned Green, Stocks in a New Uptrend (Aroon) and Filled Black Candles.
AEO is up +0.14% in after hours trading. Today price closed above the 200-EMA and also briefly broke above overhead resistance. It closed on resistance. The RSI is positive and the PMO just hit positive territory on an oversold BUY signal. Stochastics are positive and today's move saw a lot of volume. Relative strength is trending higher in all categories. The stop is set at -8.9% just below support at the mid-November low.
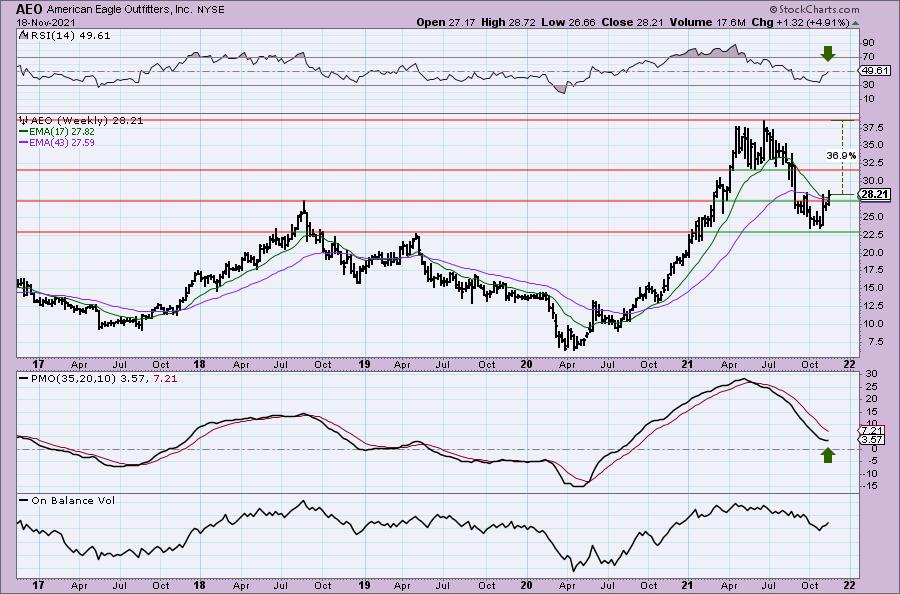
Notice that price is now above resistance at the 2018 high. Additionally price bounced of support at the 2019 high. The PMO is curling back up and the weekly RSI is nearly in positive territory. Upside potential if it can reach this year's high is over 36%.
Docebo Inc. (DCBO)
EARNINGS: None listed.
Docebo, Inc. develops a cloud-based learning management platform. The firm's cloud platform consists of the following interrelated modules: Docebo Learn, Docebo Discover, Coach and Share, Docebo Extended Enterprise, Docebo Virtual Coach, Docebo Mobile Pages, Docebo Discover and Docebo Learning Impact. It also offers Docebo for Saleforce, Docebo Embed and Docebo Mobile App Publisher. The company was founded by Claudio Erba in 2005 and is headquartered in Toronto, Canada.
Predefined Scans Triggered: P&F Bearish Signal Reversal and P&F Double Top Breakout.
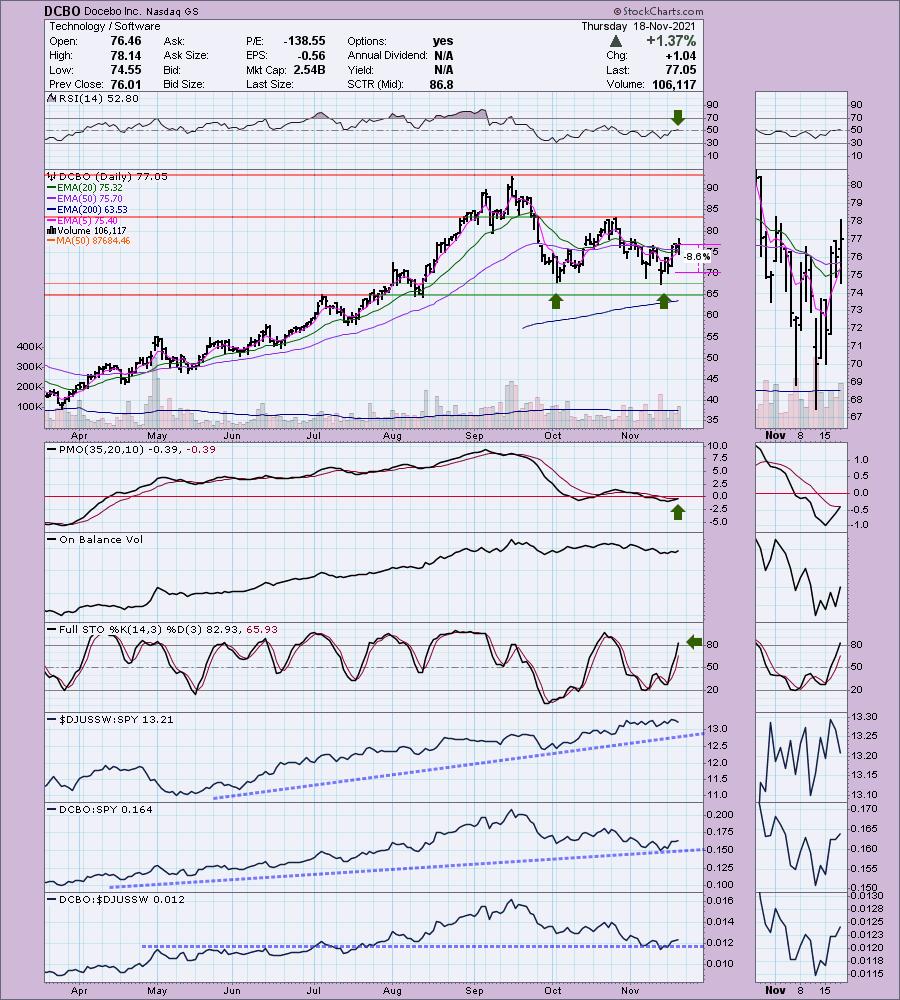
DCBO is unchanged in after hours trading. This one is thinly traded with a 50-EMA Volume under 100,000. It barely hits my threshold for trading which is 80,000+, but the chart is very interesting. We have a double-bottom pattern forming with the confirmation line of the pattern at the October high. The RSI just hit positive territory and the PMO has a new crossover BUY signal. Stochastics are rising strongly and have moved above 80. The software group has been outperforming nearly all year. While DCBO has trended higher against the SPY it is struggling to outperform now. I would love to have set the stop below the double-bottom, but it is just too deep for my taste.
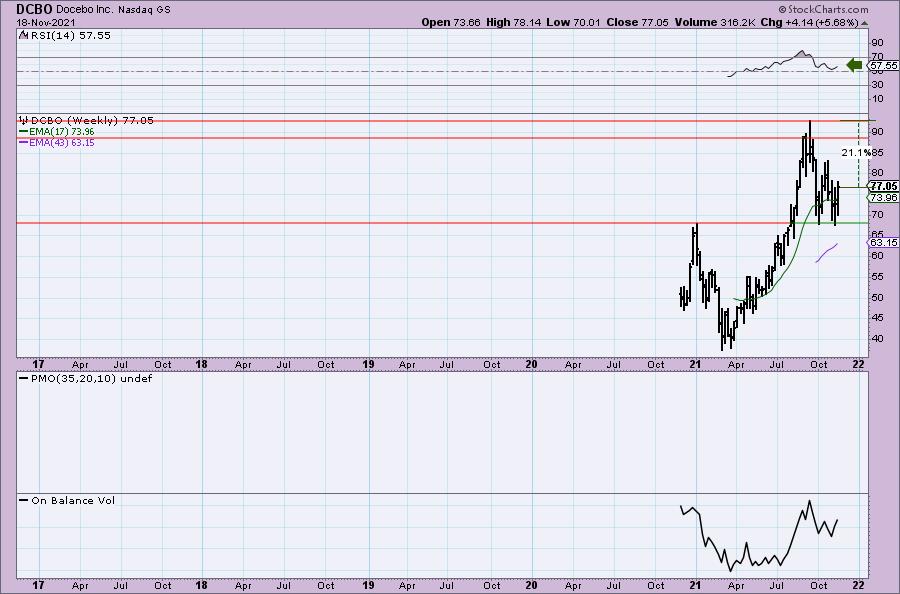
Not much information on the weekly chart since it is a new issue, but we do see a positive weekly RSI and upside potential of over 20%.
Global E Online Ltd. (GLBE)
EARNINGS: 2/24/2022 (AMC)
Global-e Online Ltd. engages in the provision of cross-border e-commerce solutions. It offers Global-e Pro and Global-e enterprise. The company was founded by Shahar Tamari, Amir Schlachet, and Nir Debbi on May 1, 2013 and is headquartered in Petach Tikva, Israel.
Predefined Scans Triggered: None.
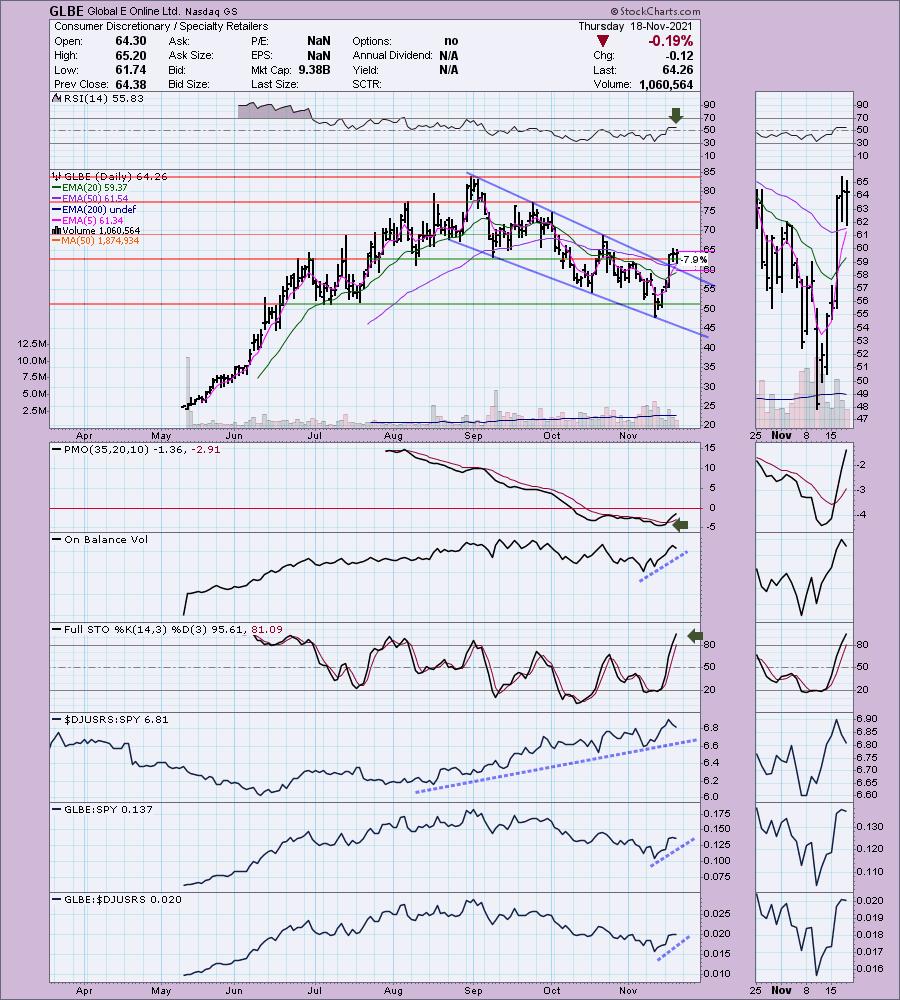
GLBE is up +0.06% in after hours trading. Price has broken out of a bullish falling wedge. I was concerned by the rounded top that has been forming, but the breakout from the declining trend suggests it is now ready to retest prior highs. The RSI is positive and the PMO is on a new crossover BUY signal that triggered in oversold territory. Stochastics are rising strongly and have just reached above 80. Volume pattern is strong on the OBV. Relative strength studies are bullish. The stop is set at the 20-EMA. Basically a break below the 20-EMA or reentrance into the declining trend would move me out of this one in a hurry.
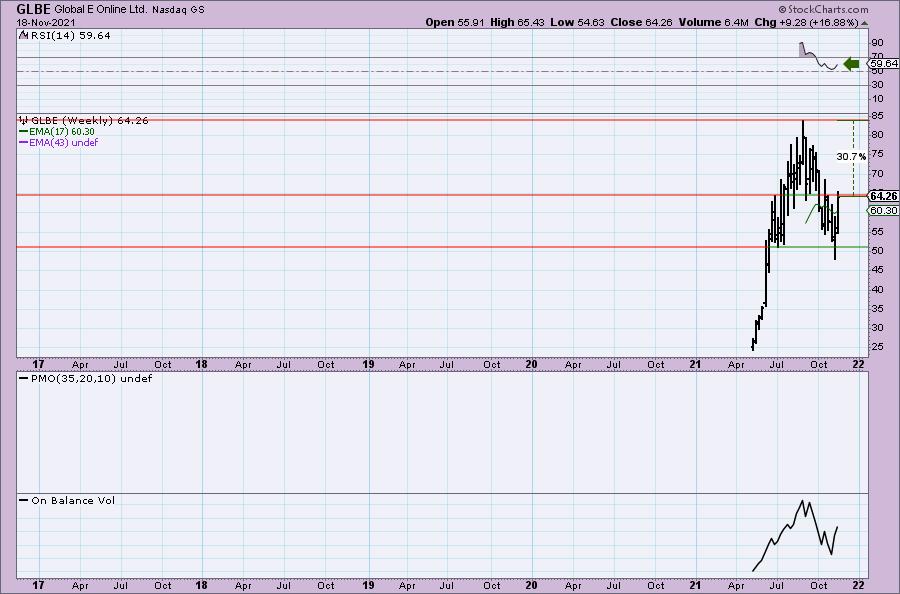
The weekly RSI is positive, but we don't have enough data for a PMO or a long-term 43-week EMA. Upside potential if it can reach all-time highs again is over 30%.
Lucid Group, Inc. (LCID)
EARNINGS: 3/30/2022 (AMC)
Lucid Group, Inc. manufactures electric vehicles. It designs, develops, and built energy storage systems for electric vehicles and supplied automakers with the battery pack system needed to power hybrid, plug-in, and electric vehicles. The company was founded in December 2007 and is headquartered in Newark, CA.
Predefined Scans Triggered: Hammer Candlestick, Elder Bar Turned Blue, Parabolic SAR Sell Signals and P&F High Pole.
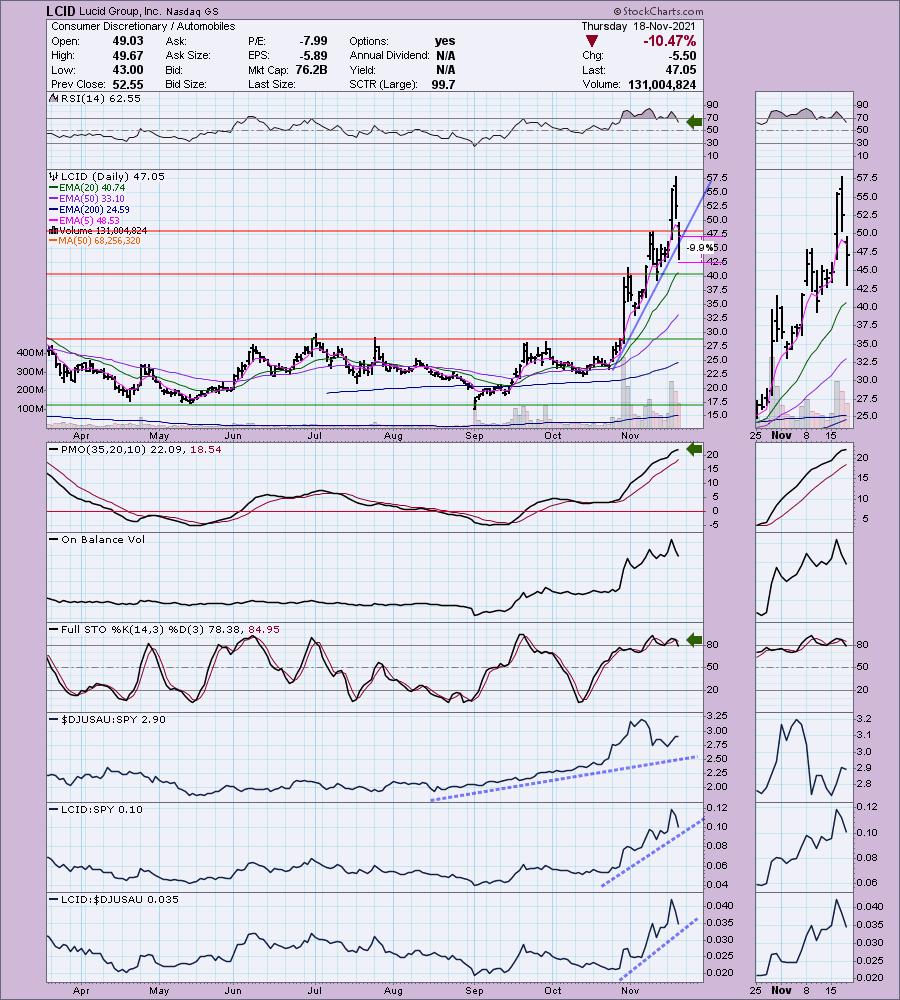
LCID is down -1.11% in after hours trading. I hesitated to pick this one as I'm not particularly thrilled with the chart, but I know this subscriber wanted some possible direction on what to do with it. I do hope you are sitting on profits still. I like what this company provides and with the infrastructure bill in place, charging stations and battery packs will be a growth industry. I simply think this one went up too far too fast and it is normalizing. Bright spots are an RSI that is no longer overbought and is positive. Despite today's and yesterday's giant declines, the PMO is still actually rising meaning there is still a lot of momentum here. Stochastics have been oscillating above 80. Two big declines didn't take Stochastics to negative territory, so there is internal strength. Relative strength is still positive. There is also a "hammer" candlestick which generally leads to higher prices. Here are the problems. The rising trend has been compromised and we know based on after hours trading that it isn't likely done declining. The 20-EMA will be critical support. I set the stop below today's intraday low.
If you own it, you've already taken a huge hit and I believe you are probably in for another 10%+ decline before it reverses. I expect it will not look good on the spreadsheet tomorrow, but reader request day is about providing you my thoughts on your stocks. Be careful with this one and decide if you want to take the chance at more losses or sell and get back in. You could consider adding to the position, but putting more money on a weak stock isn't always the best idea. Hopefully this is helpful!
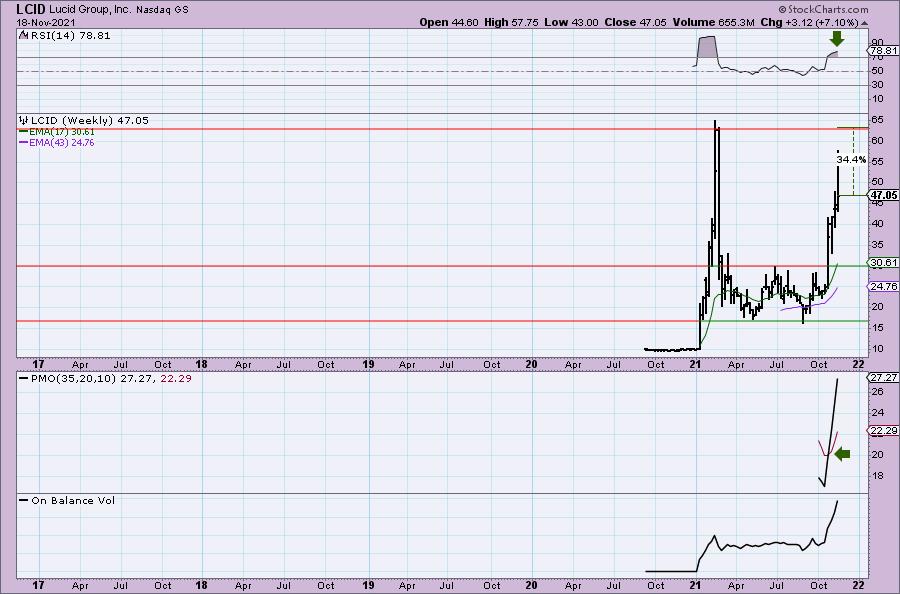
There isn't much data on the weekly chart, but the weekly RSI is still positive and technically there is a weekly PMO crossover BUY signal. Volume has also skyrocketed.
West Pharmaceutical Services (WST)
EARNINGS: 2/17/2022 (BMO)
West Pharmaceutical Services, Inc. manufactures and markets pharmaceuticals, biologics, vaccines and consumer healthcare products. It operates through the following business segments: Proprietary Products and Contract-Manufactured Products. The Proprietary Products segment offers proprietary packaging, containment and drug delivery products, along with analytical lab services, to biologic, generic and pharmaceutical drug customers. The Contract-Manufactured Products segment serves as a fully integrated business, focused on the design, manufacture and automated assembly of complex devices, primarily for pharmaceutical, diagnostic, and medical device customers. The company was founded by Herman O. West on July 27, 1923 and is headquartered in Exton, PA.
Predefined Scans Triggered: Moved Above Upper Keltner Channel, Moved Above Upper Bollinger Band and P&F Double Top Breakout.
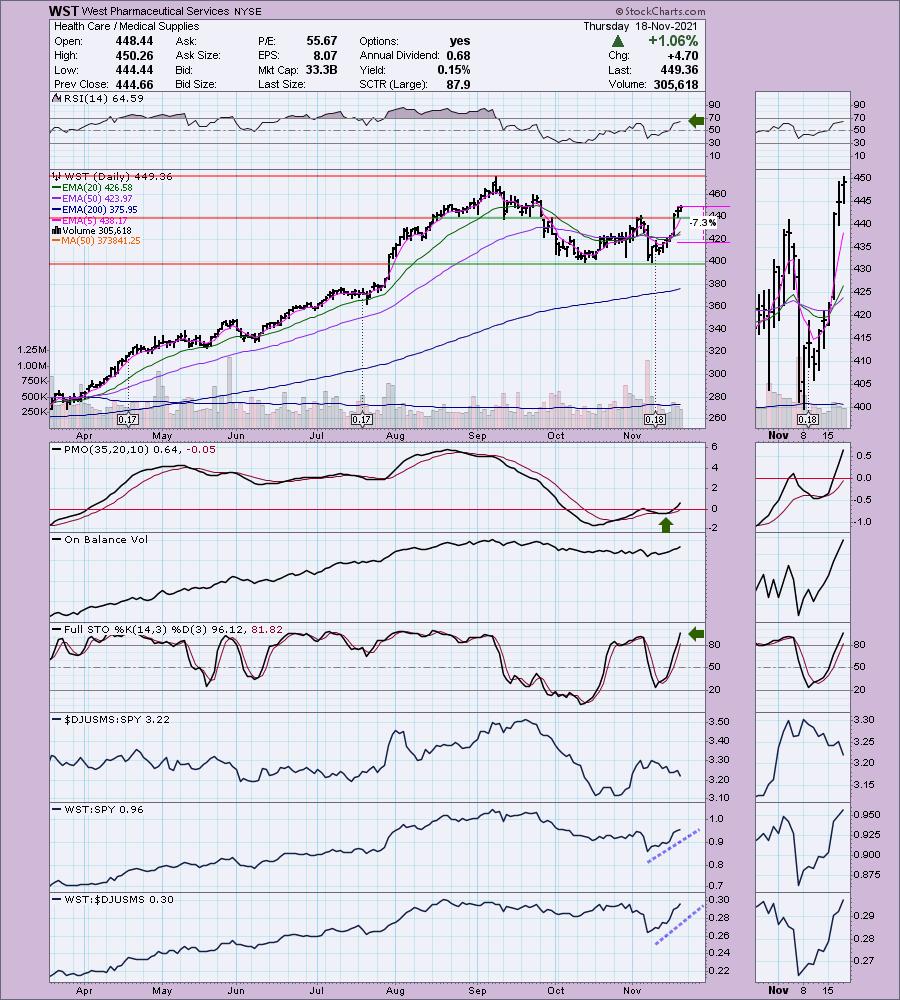
WST is unchanged in after hours trading. I really like this chart--probably my favorite of the day. We have a double-bottom pattern and price has just broken above the confirmation line. The minimum upside target of the pattern would have price testing all-time highs at the September top. The RSI is positive and the PMO is rising above zero after a whipsaw BUY signal. Volume is coming in and Stochastics are very positive. WST is outperforming the SPY and the group; although the group is anemic and losing relative strength so pay more attention to its outperformance against the SPY. The stop is set midway back into the pattern and beneath the EMAs.
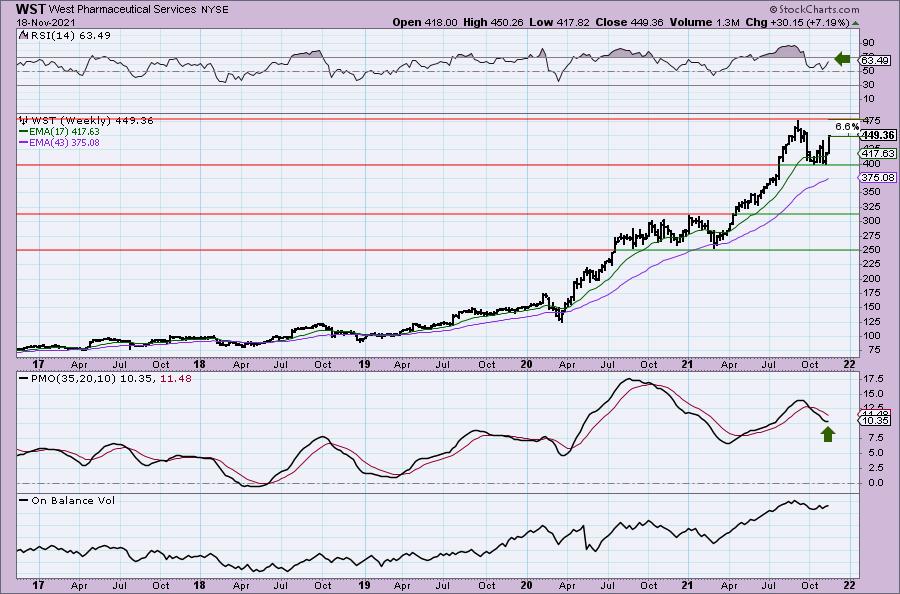
The weekly PMO has turned up and the weekly RSI is positive and rising. This has a bull flag feel. All-time highs are close so I'd set an upside target around $521.26 for a 16% gain.
Don't forget, on Thursdays I look at reader-requested symbols, click HERE to shoot me an email. I read every email I receive and try to answer them all!
Current Market Outlook:
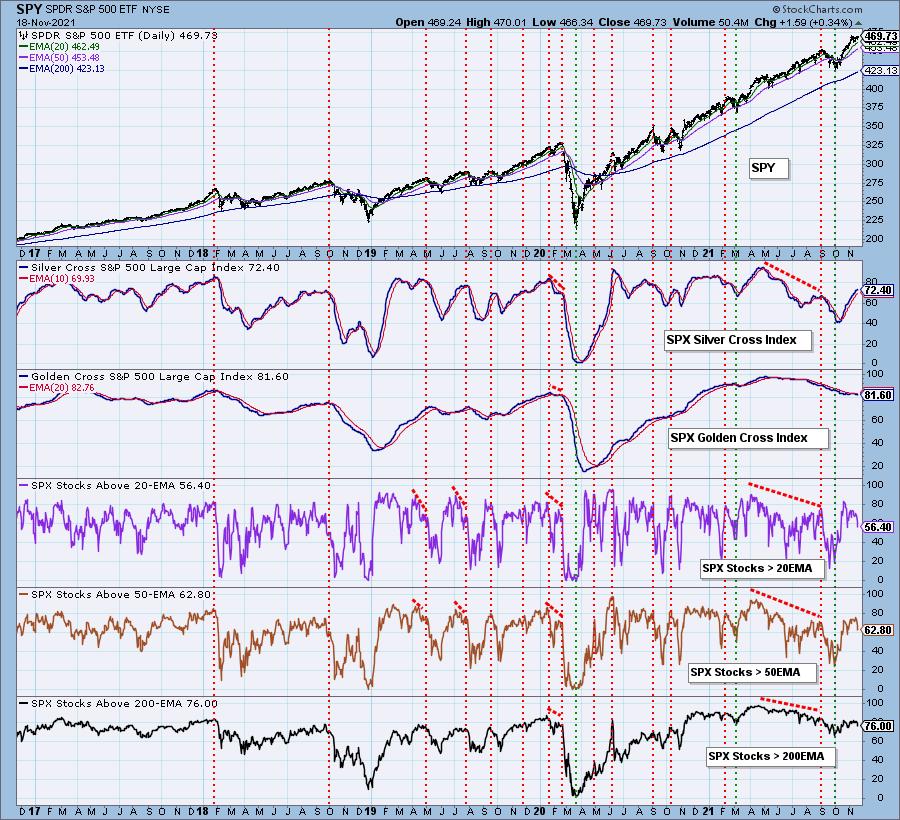
Market Environment: It is important to consider the odds for success by assessing the market tides. The following chart uses different methodologies for objectively showing the depth and trend of participation for intermediate- and long-term time frames.
- The Silver Cross Index (SCI) shows the percentage of SPX stocks on IT Trend Model BUY signals (20-EMA > 50-EMA)
- The Golden Cross Index (GCI) shows the percentage of SPX stocks on LT Trend Model BUY signals (50-EMA > 200-EMA)
- The Bullish Percent Index (BPI) shows the percentage of SPX stocks on Point & Figure BUY signals.
Don't forget that as a "Diamonds" member, you have access to our GCI/SCI curated ChartList on DecisionPoint.com. You'll find it under "Members Only" links on the left side on the Blogs and Links Page.
Here is the current chart:
Full Disclosure: I'm 75% invested and 25% is in 'cash', meaning in money markets and readily available to trade with.
I'm required to disclose if I currently own a stock and/or may buy it within the next 72 hours.
Technical Analysis is a windsock, not a crystal ball.
Happy Charting!
- Erin
erin@decisionpoint.com
Watch the latest episode of DecisionPoint with Carl & Erin Swenlin on Mondays 7:00p EST or on the DecisionPoint playlist on the StockCharts TV YouTube channel here!
NOTE: The stocks reported herein are from mechanical trading model scans that are based upon moving average relationships, momentum and volume. DecisionPoint analysis is then applied to get five selections from the scans. The selections given should prompt readers to do a chart review using their own analysis process. This letter is not a call for a specific action to buy, sell or short any of the stocks provided. There are NO sure things or guaranteed returns on the daily selection of "Diamonds in the Rough."
Helpful DecisionPoint Links:
DecisionPoint Shared ChartList and DecisionPoint Chart Gallery
Price Momentum Oscillator (PMO)
Swenlin Trading Oscillators (STO-B and STO-V)
For more links, go to DecisionPoint.com