
I've noticed that my scans are beginning to return fewer and fewer results. This is generally not a good sign. It tells me that we need to babysit our positions and not add to our exposure. I have three stocks for you today and only three extra "stocks to review" with one of them being a repeat from yesterday, BioNTech (BNTX). I nearly added BNTX to today's "Diamonds in the Rough", but it was up over 5.4% today and is due for a pullback now.
While the three stocks I did pick as "Diamonds in the Rough" are lined up fairly well, as noted above I would think very carefully about increasing your exposure right now. It may be a good idea to firm up your stops as well.
Today's "Diamonds in the Rough": GPK, NFLX and OHI.
Stocks to Review: BNTX, SBAC and TPR.

RECORDING LINK Friday (11/12):
Topic: DecisionPoint Diamond Mine (11/12/2021) LIVE Trading Room
Start Time: Nov 12, 2021 09:00 AM
Meeting Recording Link HERE.
Access Passcode: November@12
REGISTRATION FOR FRIDAY 11/19 Diamond Mine:
When: Nov 19, 2021 09:00 AM Pacific Time (US and Canada)
Topic: DecisionPoint Diamond Mine (11/19/2021) LIVE Trading Room
Register in advance for this webinar HERE.
Save the registration confirmation email with login instructions in case Zoom doesn't notify you in time.

Free DP Trading Room (11/8) RECORDING LINK (There was no trading room on 11/15):
Topic: DecisionPoint Trading Room
Start Time: Nov 8, 2021 08:57 AM
Meeting Recording Link HERE.
Access Passcode: November%8
For best results, copy and paste the access code to avoid typos.
Welcome to DecisionPoint Daily Diamonds, wherein I highlight five "Diamonds in the Rough." These are selected from the results of my DecisionPoint scans, which search for stocks that could benefit from the trend and condition of the market. Remember, these are not recommendations to buy or sell, but are the most interesting of the stocks that surfaced in my scans. My objective is to save you the work of the initial, tedious culling process, but you need to apply your own analysis to see if these stocks pique your interest as well. There are no guaranteed winners here!
Graphic Packaging Holding Co. (GPK)
EARNINGS: 2/17/2022 (BMO)
Graphic Packaging Holding Co. provides paper-based packaging solutions for a variety of products to food, beverage and other consumer products companies. The firm produces folding cartons, kraft paperboard, coated-recycled boxboard and multi-wall bags. It operates through the following business segments: Paperboard Mills, Americas Paperboard Packaging and Europe Paperboard Packaging. The Paperboard Mills segment includes the eight North American paperboard mills which produce coated unbleached kraft paperboard and coated-recycled paperboard. The Americas Paperboard Packaging segment includes paperboard folding cartons sold to consumer packaged goods companies serving the food, beverage and consumer product markets in the Americas. The Europe Paperboard Packaging segment includes paperboard folding cartons sold to consumer packaged goods companies serving the food, beverage and consumer product markets in Europe. The company was founded on December 28, 1992 and is headquartered in Atlanta, GA.
Predefined Scans Triggered: P&F Double Top Breakout and P&F Ascending Triple Top Breakout.
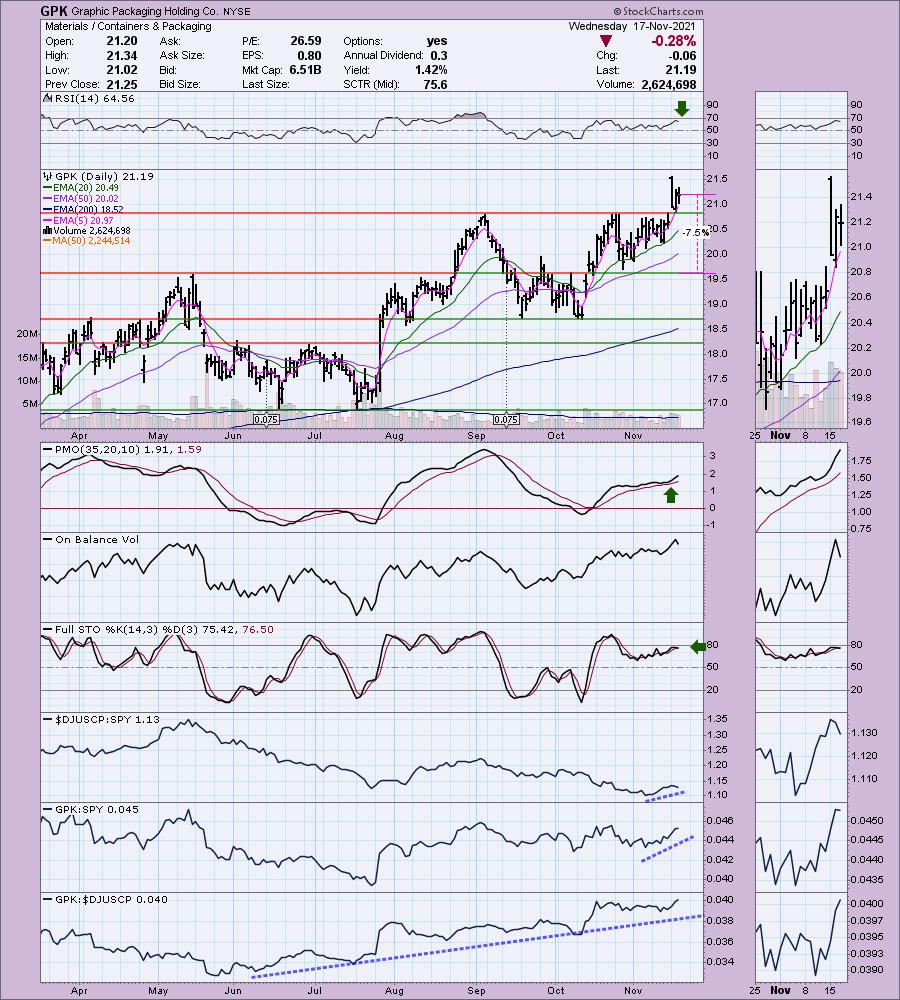
GPK is up +1.18% in after hours trading. GPK broke out on Monday, pulled back before the close and stayed above resistance. Tuesday it began to rise again. While it was down slightly today, I see yesterday and today's price action as a consolidation of the breakout. The RSI is positive and there is a PMO bottom above the signal line. The PMO is far from being overbought. Stochastics are positive and trending higher with price. The group is losing steam as far as relative performance. GPK is a strong performer within the group and it has been outperforming the SPY this month. The stop can be set at 7.5% below the May top and late October low.
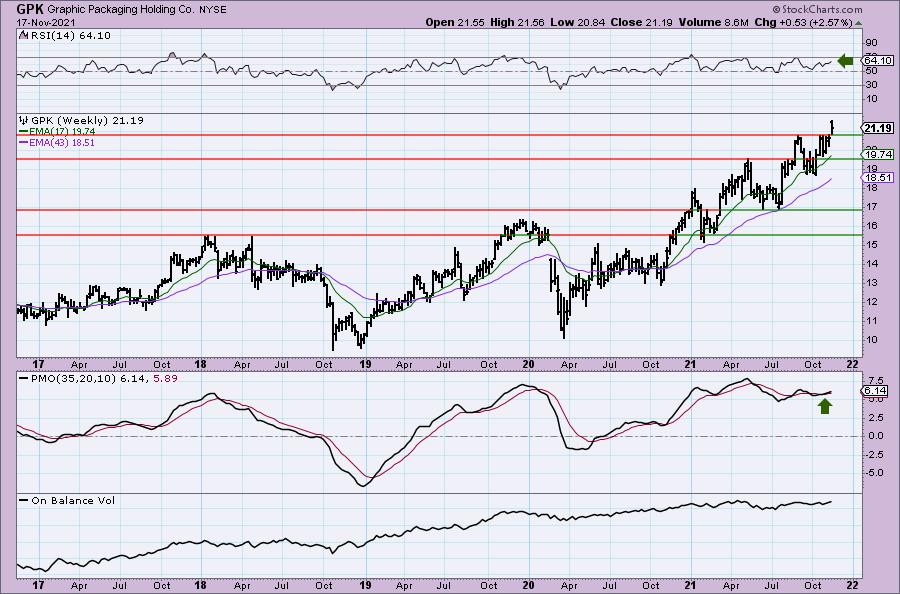
The weekly chart looks good with a positive weekly RSI and a new weekly PMO crossover BUY signal. It is making new all-time highs so I would set an upside target of 16% at about $24.70.
Netflix, Inc. (NFLX)
EARNINGS: 1/18/2022 (AMC)
Netflix, Inc. operates as a streaming entertainment service company. The firm provides subscription service streaming movies and television episodes over the Internet and sending DVDs by mail. It operates through the following segments: Domestic Streaming, International Streaming and Domestic DVD. The Domestic Streaming segment derives revenues from monthly membership fees for services consisting of streaming content to its members in the United States. The International Streaming segment includes fees from members outside the United States. The Domestic DVD segment covers revenues from services consisting of DVD-by-mail. The company was founded by Marc Randolph and Wilmot Reed Hastings Jr. on August 29, 1997 and is headquartered in Los Gatos, CA.
Predefined Scans Triggered: Moved Above the Upper Price Channel, New CCI Buy Signals, New 52-week Highs, Stocks in a New Uptrend (Aroon) and P&F Double Top Breakout.
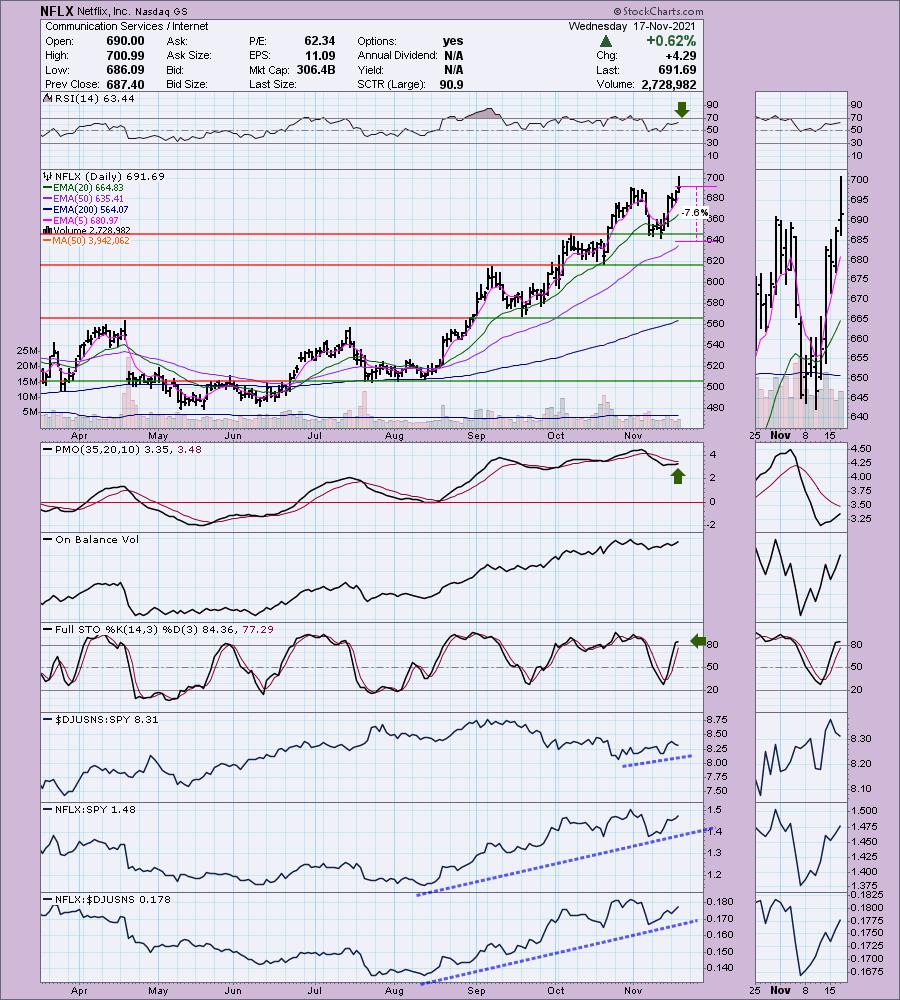
NFLX is down -0.12% in after hours trading. I've covered NFLX twice before on March 31st 2020 (position is still open as stop wasn't hit. It is up +84.2%) and November 10th 2020 (stop was never hit so this position is up +44.0%). NFLX is again poised to move higher. Today price broke to new all-time highs by breaking above resistance at the October high. The RSI is positive and the PMO is rising toward a crossover BUY signal. Stochastics have made it above 80 and seem ready to oscillate there. Relative strength for the group is beginning to trend higher this month. NFLX is a clear out-performer against the group and the SPY. I've set the stop at the November low.
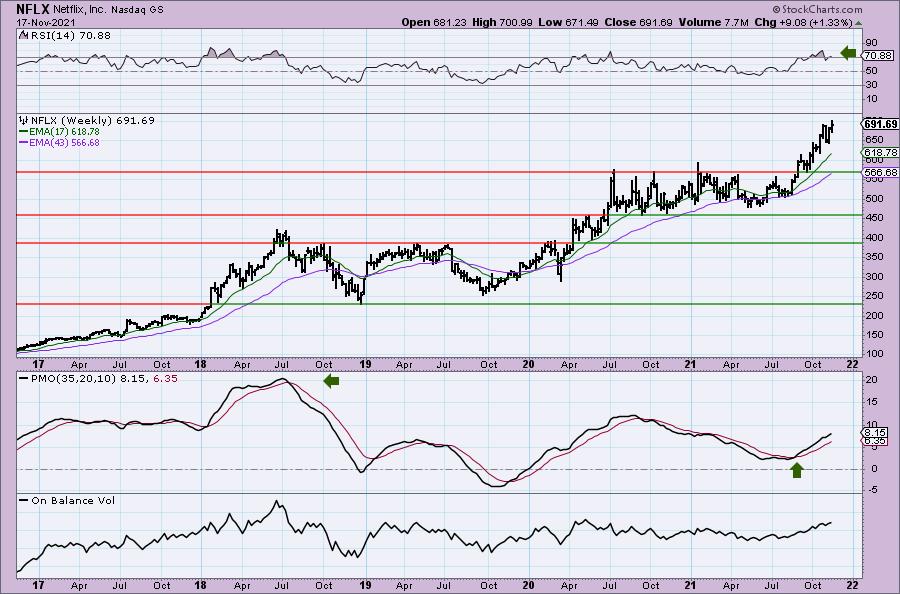
The weekly chart is very bullish. After consolidating for much of late 2020 and into 2021, this summer price broke out. It is in a confirmed uptrend. The weekly RSI is on the overbought side, but the PMO is rising nicely after a crossover BUY signal that on the breakout. Since it is at all-time highs, I would set a 16% target at around $802.36.
Omega Healthcare Invs, Inc. (OHI)
EARNINGS: 2/3/2022 (AMC)
Omega Healthcare Investors, Inc. engages in the provision of financing and capital to the long-term healthcare industry with a particular focus on skilled nursing facilities. Its portfolio consists of long-term leases and mortgage agreements. The company was founded on March 31, 1992 and is headquartered in Hunt Valley, MD.
Predefined Scans Triggered: Elder Bar Turned Green, P&F Bullish Signal Reversal and P&F Double Bottom Breakout.
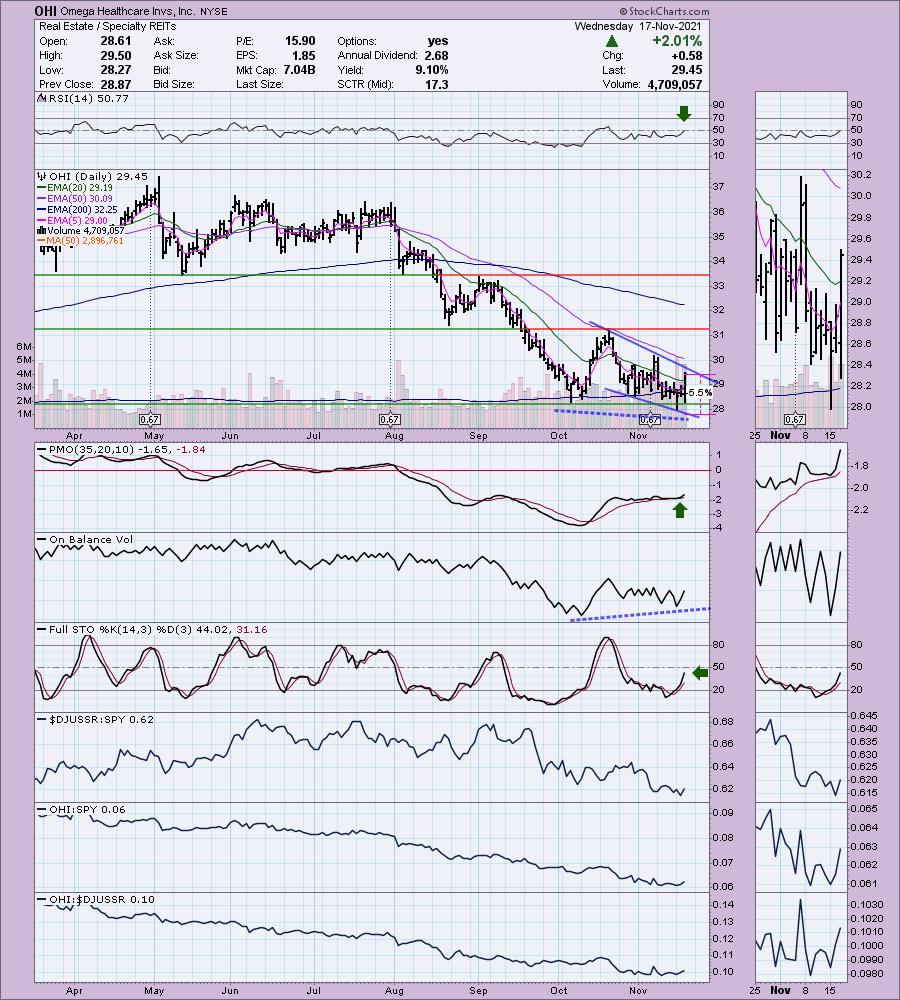
OHI is up +0.03% in after hours trading. This one is a little more risky given the very negative configuration of the EMAs. Price is traveling within a bullish falling wedge. Today price did breakout above the 20-EMA, but we've seen that before. What really interested me was the positive OBV divergence which suggests a breakout ahead with a sustained rally. The PMO has bottomed numerous times above its signal line which is very bullish. The RSI has just entered positive territory. Relative strength isn't anything to write home about as it is performing inline with the SPY. Because this is a risky play, I've set a 5.5% stop just below Monday's intraday low.
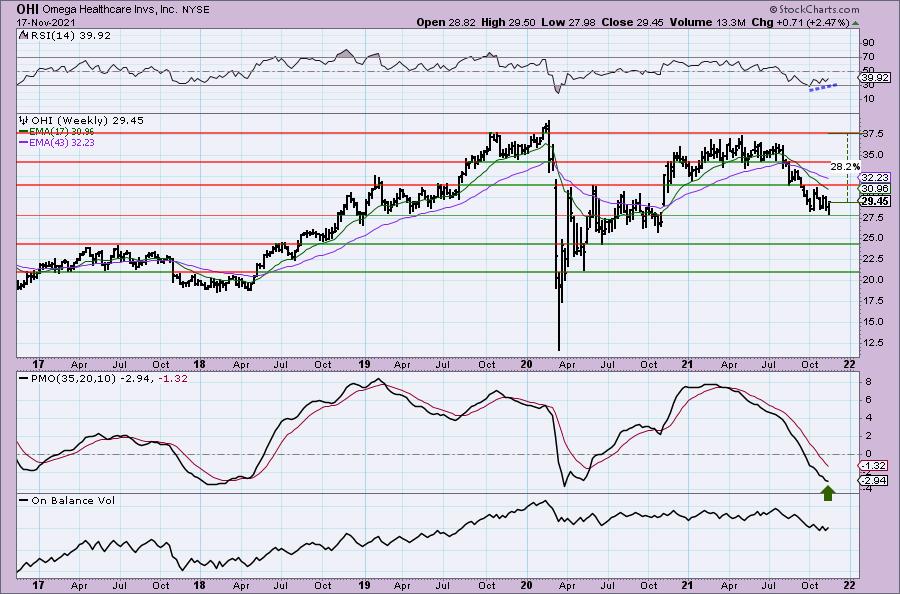
The weekly chart definitely needs some time to firm up, but the weekly RSI is trending higher and the weekly PMO appears ready to bottom in oversold territory. This isn't a strong level of support in my mind given it only lines up with the early 2019 lows. If it can rebound here and reach 2021 highs that would be a 28.2% gain.
Don't forget, on Thursdays I look at reader-requested symbols, click HERE to shoot me an email. I read every email I receive and try to answer them all!
Current Market Outlook:
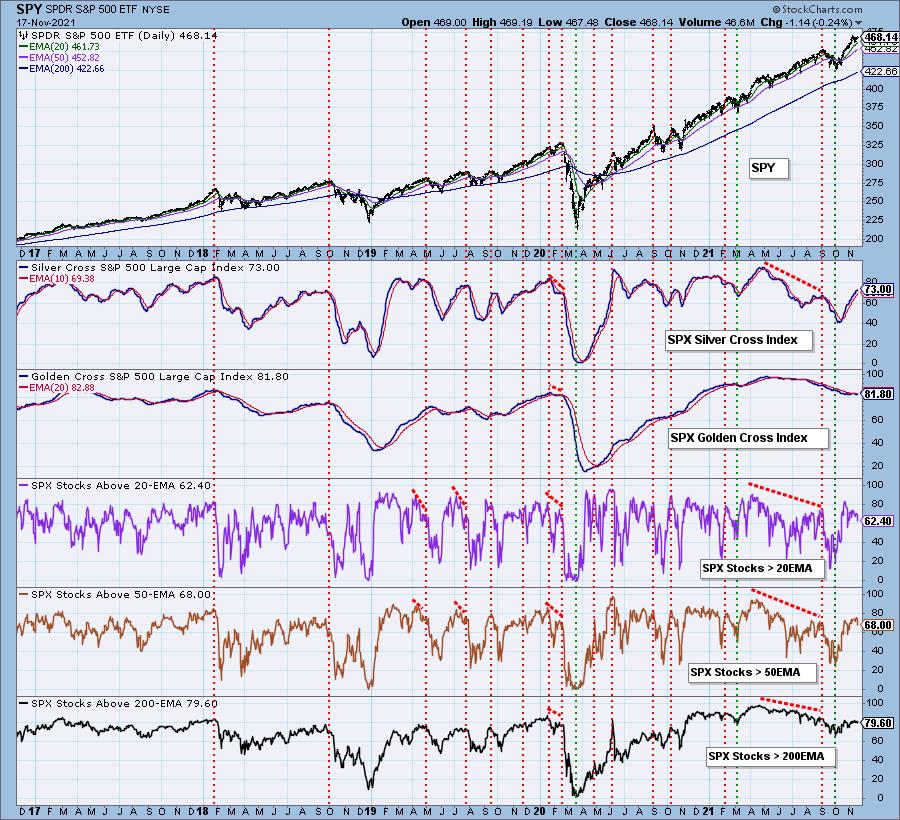
Market Environment: It is important to consider the odds for success by assessing the market tides. The following chart uses different methodologies for objectively showing the depth and trend of participation for intermediate- and long-term time frames.
- The Silver Cross Index (SCI) shows the percentage of SPX stocks on IT Trend Model BUY signals (20-EMA > 50-EMA)
- The Golden Cross Index (GCI) shows the percentage of SPX stocks on LT Trend Model BUY signals (50-EMA > 200-EMA)
- The Bullish Percent Index (BPI) shows the percentage of SPX stocks on Point & Figure BUY signals.
Don't forget that as a "Diamonds" member, you have access to our GCI/SCI curated ChartList on DecisionPoint.com. You'll find it under "Members Only" links on the left side on the Blogs and Links Page.
Here is the current chart:
Full Disclosure: I'm 75% invested and 25% is in 'cash', meaning in money markets and readily available to trade with.
I'm required to disclose if I currently own a stock and/or may buy it within the next 72 hours.
Technical Analysis is a windsock, not a crystal ball.
Happy Charting!
- Erin
erin@decisionpoint.com
Watch the latest episode of DecisionPoint with Carl & Erin Swenlin on Mondays 7:00p EST or on the DecisionPoint playlist on the StockCharts TV YouTube channel here!
NOTE: The stocks reported herein are from mechanical trading model scans that are based upon moving average relationships, momentum and volume. DecisionPoint analysis is then applied to get five selections from the scans. The selections given should prompt readers to do a chart review using their own analysis process. This letter is not a call for a specific action to buy, sell or short any of the stocks provided. There are NO sure things or guaranteed returns on the daily selection of "Diamonds in the Rough."
Helpful DecisionPoint Links:
DecisionPoint Shared ChartList and DecisionPoint Chart Gallery
Price Momentum Oscillator (PMO)
Swenlin Trading Oscillators (STO-B and STO-V)
For more links, go to DecisionPoint.com