
The scan results were quite clear today. A preponderance of Utility and Energy stocks found their way into my scan results today. I ran four of my stand-by scans and all had a clear slant toward these groups. Although I did see quite a few Banks.
Solar pulled back heavily today. I was concerned about that due to the Solar ETF (TAN) being down quite a bit in after hours trading. We'll relook at those charts on Friday and see if they reveal whether this group is going to carry on or fade away.
A subscriber wrote to me earlier letting me know that besides HACK there is another ETF, BUG that covers Cybersecurity. I thought I would let you know about it. I do own HACK now.
I decided to present three Utilities and one Energy stock given the theme in today's scan results. Don't forget that tomorrow is Reader Request Day! What stocks are on your radar? Send me an email with your symbols. Feel free to send me as many as you'd like, it makes it more fun!
Today's "Diamonds in the Rough": CLR, ED, EXC and NFG.
Stocks to Review (no order): UNH, DIV, ASIX, ESS, VIRT, FTS and AVA.

RECORDING LINK (2/25/2022):
Topic: DecisionPoint Diamond Mine (2/25/2022) LIVE Trading Room
Start Time: Feb 25, 2022 09:00 AM PT
Meeting Recording Link.
Access Passcode: Feb@25th
REGISTRATION FOR Friday 3/4 Diamond Mine:
When: Mar 4, 2022 09:00 AM Pacific Time (US and Canada)
Topic: DecisionPoint Diamond Mine (3/4/2022) LIVE Trading Room
Register in advance for this webinar HERE.
Save the registration confirmation email with login instructions in case Zoom doesn't notify you in time.

Free DP Trading Room (2/28) RECORDING LINK:
Topic: DecisionPoint Trading Room
Start Time: Feb 28, 2022 09:00 AM PT
Meeting Recording Link.
Access Passcode: Feb#28th
For best results, copy and paste the access code to avoid typos.
Welcome to DecisionPoint Daily Diamonds, wherein I highlight ten "Diamonds in the Rough" per week. These are selected from the results of my DecisionPoint Scans, which search for stocks that could benefit from the trend and condition of the market. Remember, these are not recommendations to buy or sell, but are the most interesting of the stocks that surfaced in my scans. My objective is to save you the work of the initial, tedious culling process, but you need to apply your own analysis to see if these stocks pique your interest as well. There are no guaranteed winners here!
"Predefined Scans Triggered" are taken from StockCharts.com using the "Symbol Summary" option instead of a "SharpChart" on the workbench.
Continental Resources Inc. (CLR)
EARNINGS: 5/5/2022 (AMC)
Continental Resources, Inc. is an independent oil producer engaged in the exploration, development, and production of crude oil and natural gas. The firm's operations include horizontal drilling and protecting groundwater. The company was founded by Harold G. Hamm in 1967 and is headquartered in Oklahoma City, OK.
Predefined Scans Triggered: P&F Double Top Breakout.
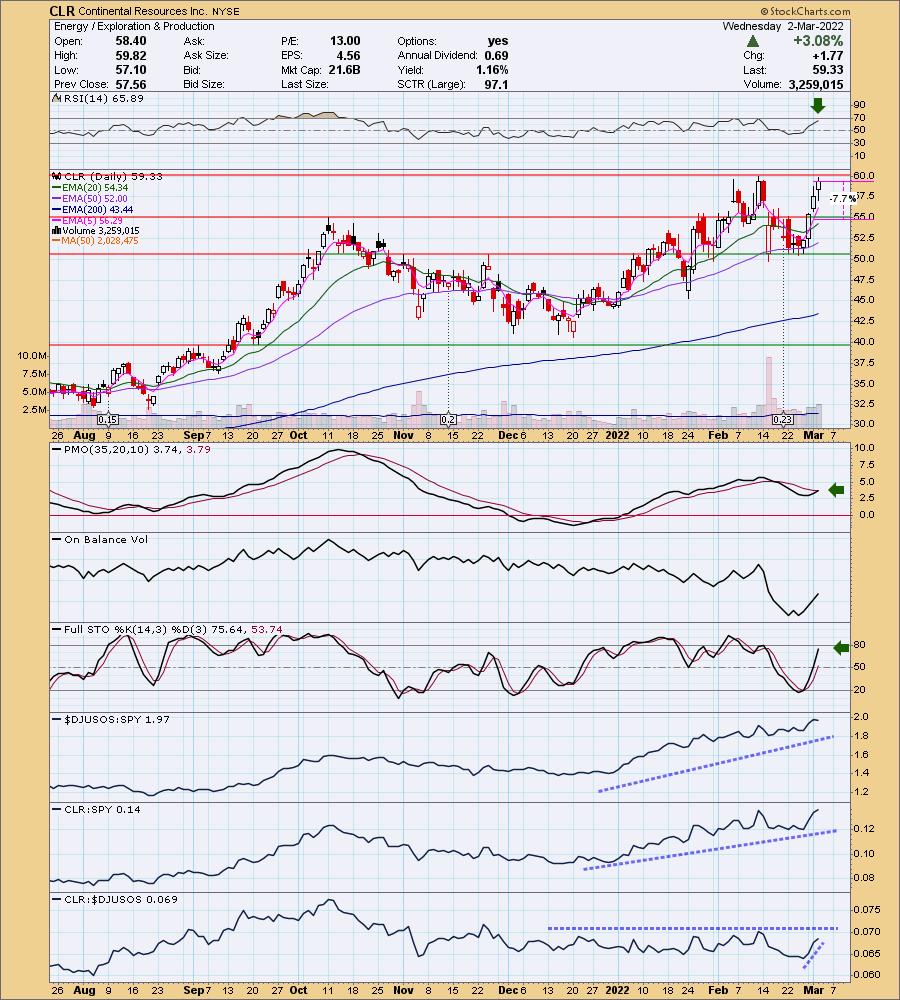
CLR is unchanged in after hours trading. We don't have a breakout yet, but the indicators suggest we will see one. The RSI is positive and the PMO is about to trigger a crossover BUY signal. Stochastics are rising strongly and should get above 80 shortly. CLR has been performing well against the SPY, as has the group. It has been hit and miss as far as performance against the group; but as I always say the most important relative strength line is the stock against the SPY. I've set the stop just below the October high.
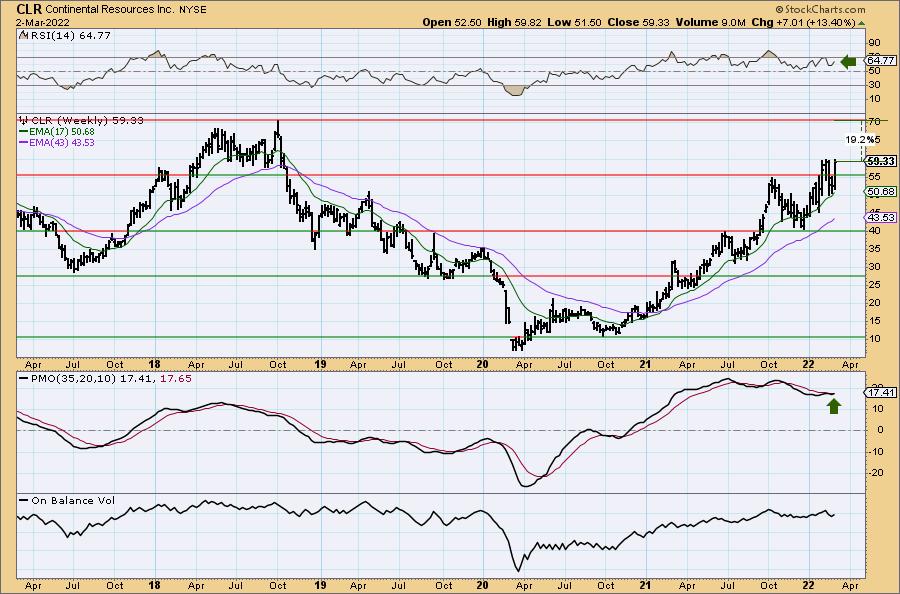
We can see that the stock is up over 13% already this week. I still see upside potential given the weekly PMO is not really overbought and is about to give us a crossover BUY signal. The weekly RSI has been in positive territory all year long. The upside potential is based on reaching the 2018 intraweek high.
Consolidated Edison, Inc. (ED)
EARNINGS: 5/5/2022 (AMC)
Consolidated Edison, Inc. operates as a holding company, which through its subsidiaries engages in the business of regulated electric, gas, and steam delivery. It operates through the following segments: Consolidated Edison Company of New York(CECONY), Orange and Rockland Utilities(O&R), Con Edison Clean Energy Businesses and Con Edison Transmission. The Consolidated Edison Co. of New York involves regulated electric, gas, and steam utility businesses. The Orange & Rockland Utilities covers regulated electric and gas utility delivery businesses. The Con Edison Clean Energy Businesses develops, owns and operates renewable and energy infrastructure projects and provides energy-related products and services to wholesale and retail customers. The Con Edison Transmission invests in electric and gas transmission projects. The company was founded in 1823 and is headquartered in New York, NY.
Predefined Scans Triggered: New CCI Buy signals, New 52-week Highs, P&F Double Top Breakout and P&F Bullish Triangle.
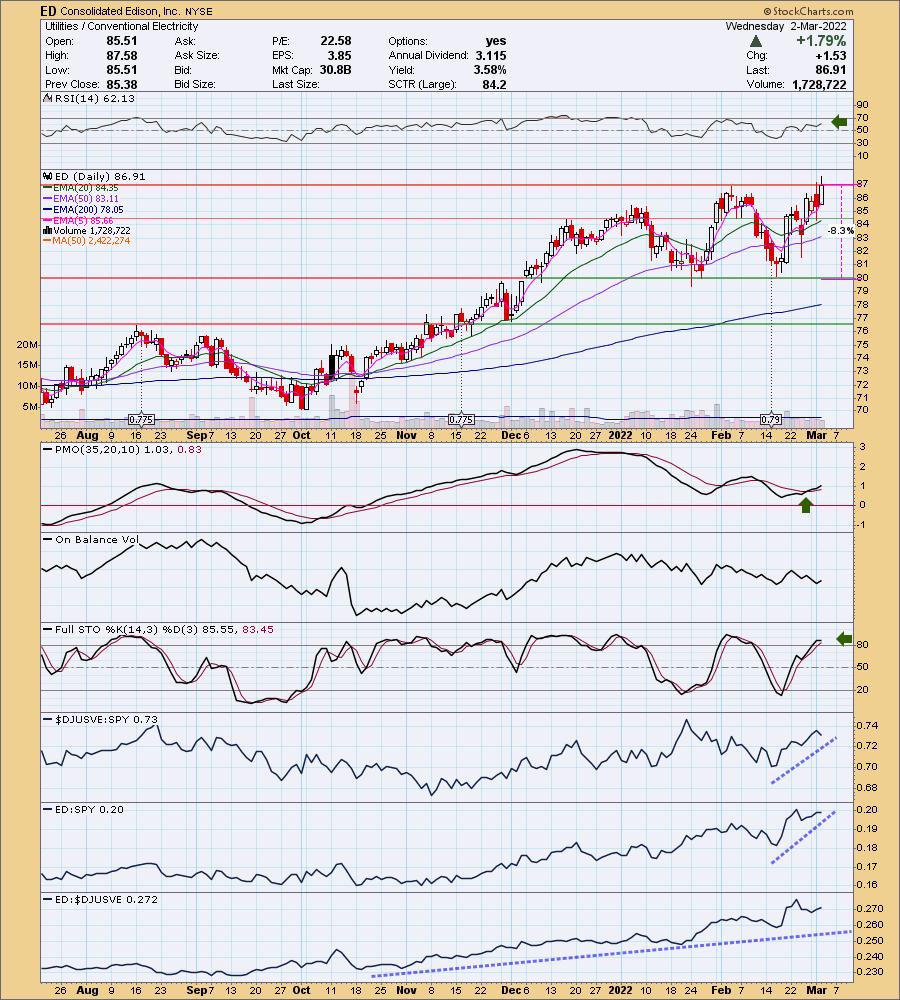
ED is unchanged in after hours trading. I covered ED in the March 10th 2020 Diamonds Report. The position was stopped out about a month later. With the war in the forefront, inflation has taken a back seat to some degree. However, it is still there and likely to get worse. Utilities tend to have high yields that can help combat inflation.
Price broke out today and while it closed beneath the intraday high from the first week of February, it closed higher than highest prior closing price. I call it a breakout. The RSI is positive and not overbought. The PMO is on an oversold crossover BUY signal. Stochastics are now above 80. Relative strength is favorable. You don't need to set the stop as deeply as I did; anywhere under the 50-day EMA would suffice if you don't want to carry 8% downside risk.
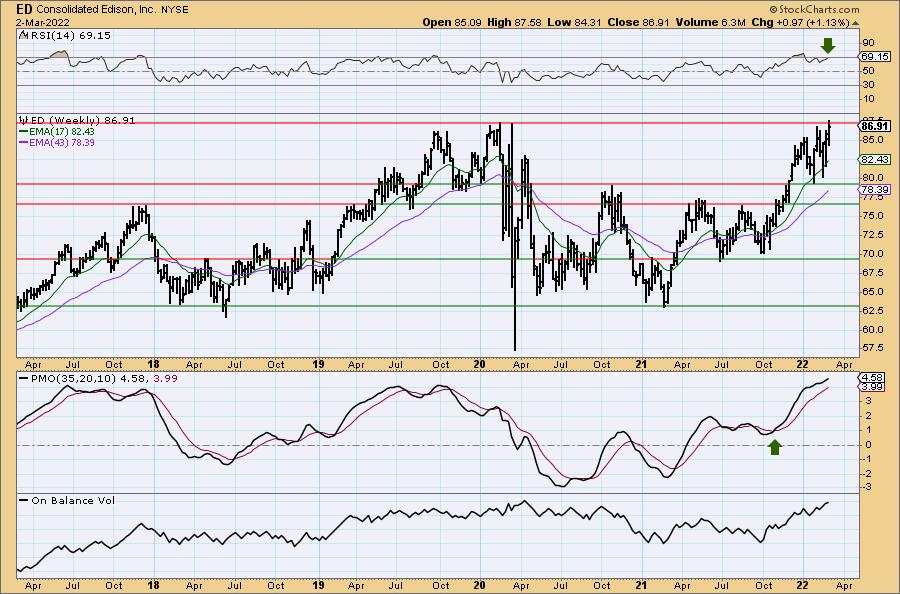
Today ED closed on an all-time high (I referenced the monthly chart to be sure). The weekly RSI is positive, though getting a bit overbought. The weekly PMO is accelerating higher, but admittedly is quite overbought. Since it is trading at all-time highs and I set my stop at 8.3%, I would consider an upside target that is twice the stop percentage around 16% or $100.85.
Exelon Corp. (EXC)
EARNINGS: 5/4/2022
Exelon Corp. operates as a utility services holding company, which engages in the energy generation, power marketing, and energy delivery business. It operates through the following segments: Mid Atlantic, Midwest, New York, Electric Reliability Council of Texas (ERCOT) and other Power Regions. The Mid-Atlantic segment represents operations in the eastern half of PJM, which includes New Jersey, Maryland, Virginia, West Virginia, Delaware, the District of Columbia and parts of Pennsylvania and North Carolina. The Midwest segment operates in the western half of PJM, which includes portions of Illinois, Pennsylvania, Indiana, Ohio, Michigan, Kentucky and Tennessee, and the United States footprint of MISO, excluding MISO's Southern Region, which covers all or most of North Dakota, South Dakota, Nebraska, Minnesota, Iowa, Wisconsin, the remaining parts of Illinois, Indiana, Michigan and Ohio not covered by PJM, and parts of Montana, Missouri and Kentucky. The New York (NY) segment provides operations within ISO–NY, which covers the state of New York in its entirety. The ERCOT segment includes operations within the Electric Reliability Council of Texas, covering most of the state of Texas. The Other Power Regions consist of the operations in New England, South, West, and Canada. The company was founded in February 1999 and is headquartered in Chicago, IL.
Predefined Scans Triggered: Parabolic SAR Buy Signals, P&F Ascending Triple Top Breakout and P&F Double Top Breakout.
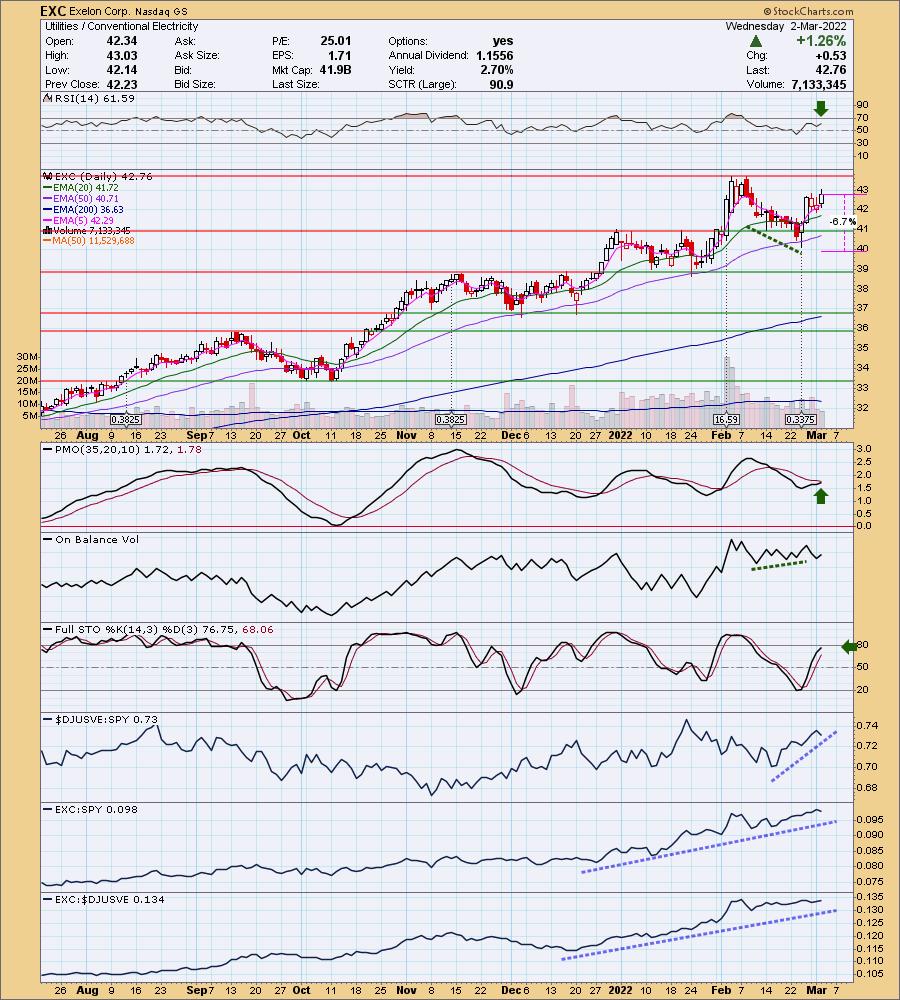
EXC is down -1.73% in after hours trading. It always a little disheartening when I pick a "Diamond in the Rough" only to find it is down considerably in after hours trading. While it might hurt the Recap spreadsheet on Friday, it could offer you an excellent entry on a pullback to the 20-day EMA. I covered EXC in the March 9th 2021 Diamonds Report. The position is still open and currently up 50%. The stock went through a split so the starting price will look different in the prior report.
Price is on its way to overhead resistance at all-time highs. The indicators suggest a breakout ahead, but given it's down in after hours trading, it might need that pullback to the 20-day EMA first. The RSI is positive and the PMO is about to trigger a crossover BUY signal. Check out the nice OBV positive divergence with price lows that led into the current rally. Stochastics are rising (although decelerating slightly) and should get above 80 shortly. This one has been a consistent outperformer and with the group kicking into high gear I am looking for a breakout. The stop is set in the middle of the January trading range.
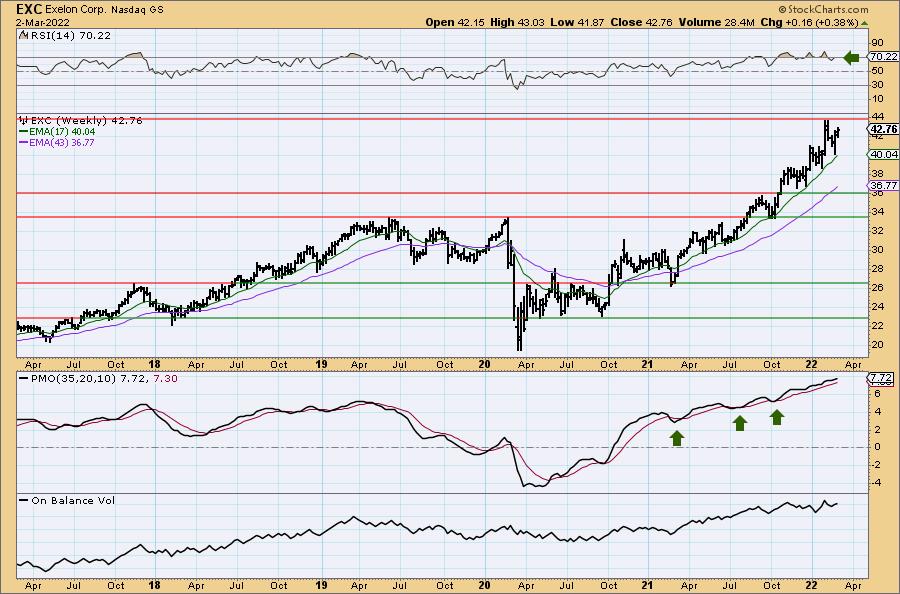
The weekly chart shows you it is in a solid bull market. The RSI is positive and not as overbought as it has been. The weekly PMO has consistently given up SELL signals and is rising nicely. It is on the overbought side. Since it is at all-time highs, I'd consider an upside target around 15% at $49.17.
National Fuel Gas Co. (NFG)
EARNINGS: 5/5/2022 (AMC)
National Fuel Gas Co. is a holding company, which engages in the production, gathering, transportation, distribution, and marketing of natural gas. It operates through the following segments: Exploration and Production, Pipeline and Storage, Gathering, and Utility. The Exploration and Production segment handles the exploration for and the development of natural gas and oil reserves in California and in the Appalachian region of the United States. The Pipeline and Storage segment transports and stores natural gas for utilities, natural gas marketers, exploration and production companies, and pipeline companies in the northeastern United States markets. The Gathering segment builds, owns, and operates natural gas processing and pipeline gathering facilities in the Appalachian region. The Utility segment sells natural gas to retail customers and provides natural gas transportation services in western New York and northwestern Pennsylvania. The company was founded in 1820 and is headquartered in Williamsville, NY.
Predefined Scans Triggered: P&F Double Top Breakout, Moved Above Upper Bollinger Band and P&F Triple Top Breakout.
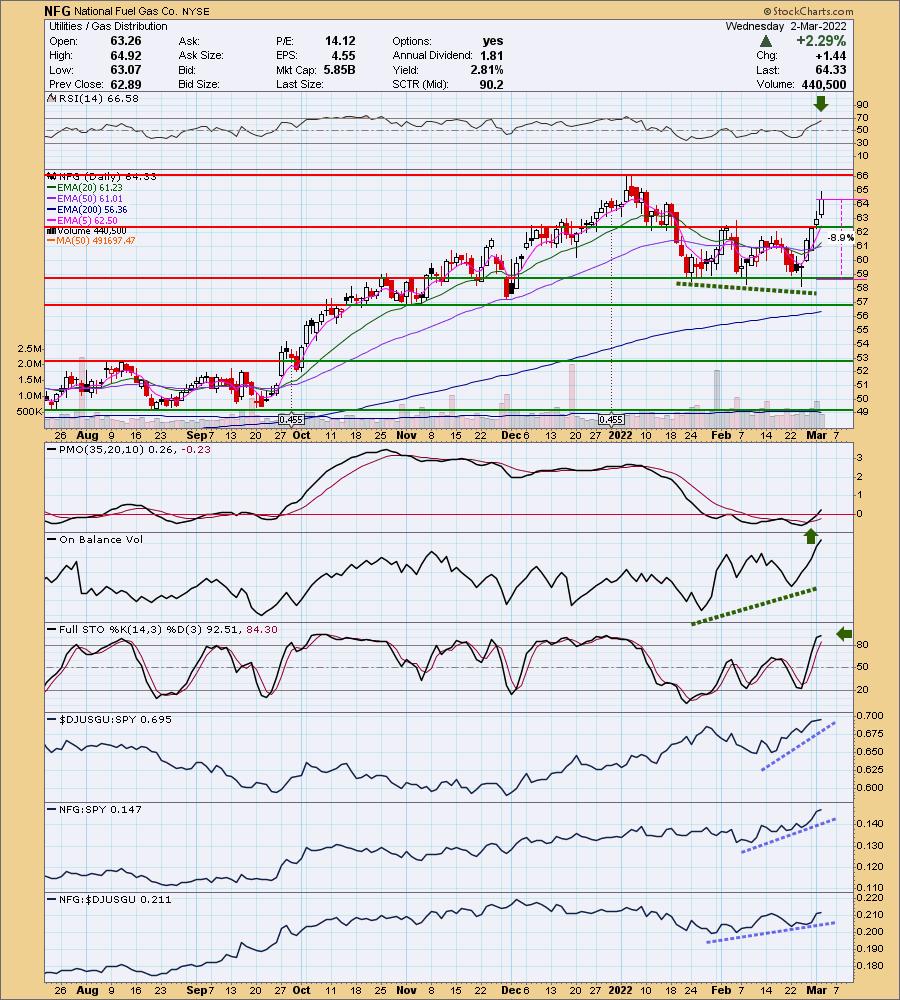
NFG is up +0.17% in after hours trading. Here we another stock with a nice OBV positive divergence. The RSI is positive and not overbought. The PMO is on a crossover BUY signal and has just moved above the zero line. Volume is certainly coming in on this rally. Stochastics are above 80 and relative performance is solid for the group and NFG. The stop is set below the prior trading range, but you can tighten it up if you prefer to the 50-day EMA or halfway into that trading range around $60.50.
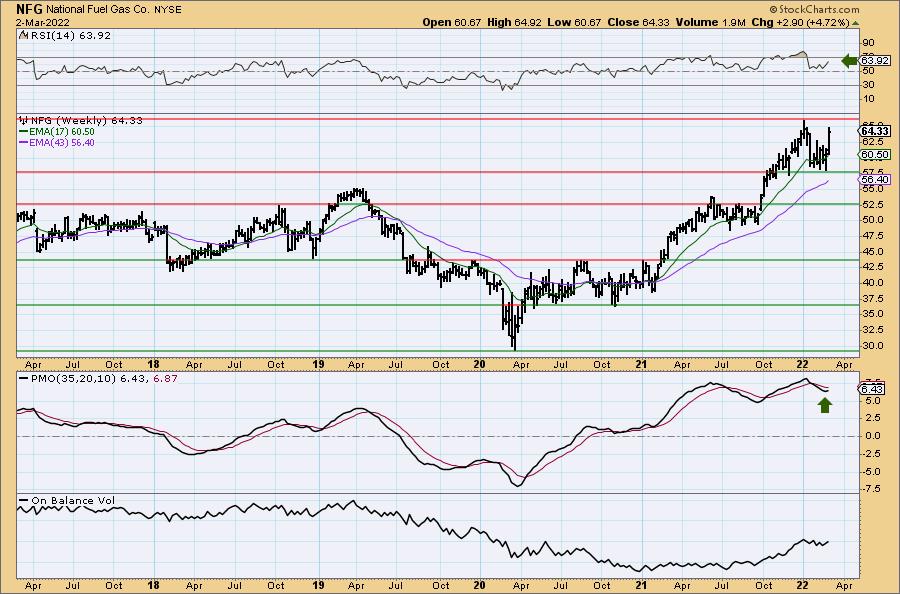
Price reversed its decline prior to testing the 43-week EMA. The weekly RSI has been positive this past year. The weekly PMO is turning up and is going in for a crossover BUY signal. It is near all-time highs and since I set a deep 9% stop, I'm setting an upside target around 18% at $75.90.
Don't forget, on Thursdays I look at reader-requested symbols, click HERE to shoot me an email. I read every email I receive and try to answer them all!
Current Market Outlook:
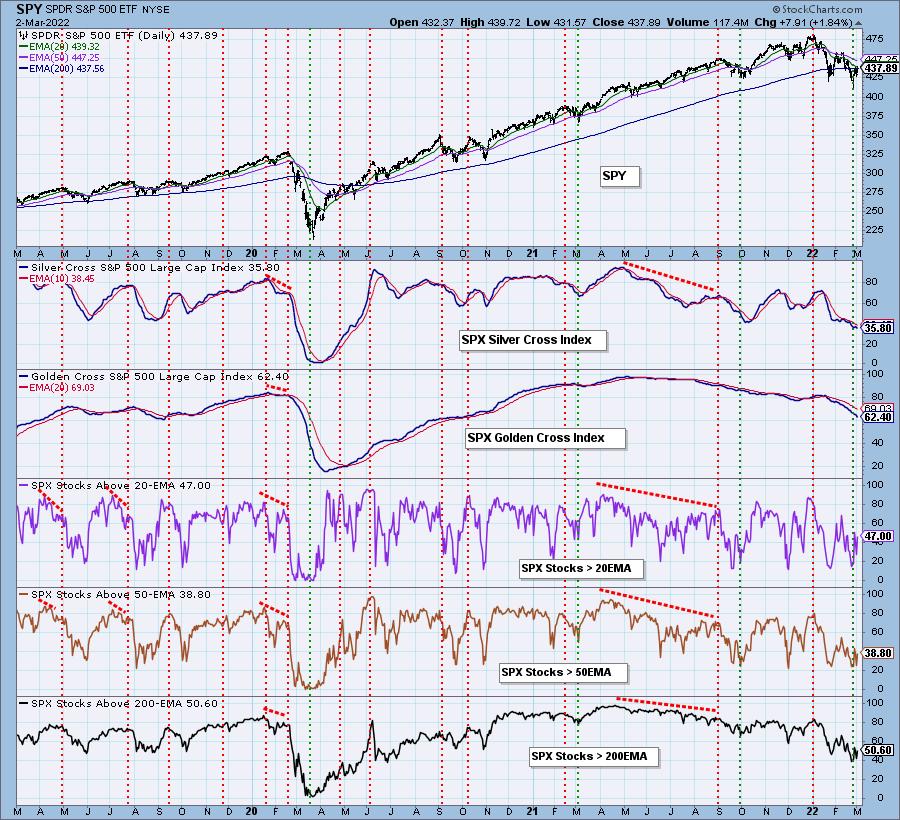
Market Environment: It is important to consider the odds for success by assessing the market tides. The following chart uses different methodologies for objectively showing the depth and trend of participation for intermediate- and long-term time frames.
- The Silver Cross Index (SCI) shows the percentage of SPX stocks on IT Trend Model BUY signals (20-EMA > 50-EMA)
- The Golden Cross Index (GCI) shows the percentage of SPX stocks on LT Trend Model BUY signals (50-EMA > 200-EMA)
Don't forget that as a "Diamonds" member, you have access to our GCI/SCI curated ChartList on DecisionPoint.com. You'll find it under "Members Only" links on the left side on the Blogs and Links Page.
Here is the current chart:
Full Disclosure: I'm 8% invested and 92% is in 'cash', meaning in money markets and readily available to trade with. I own HACK.
I'm required to disclose if I currently own a stock and/or may buy it within the next 72 hours.
Good Luck and Good Trading!
- Erin
"Technical Analysis is a windsock, not a crystal ball." - Carl Swenlin
(c) Copyright 2022 DecisionPoint.com
Watch the latest episode of DecisionPoint with Carl & Erin Swenlin on Mondays 7:00p EST or on the DecisionPoint playlist on the StockCharts TV YouTube channel here!
NOTE: The stocks reported herein are from mechanical trading model scans that are based upon moving average relationships, momentum and volume. DecisionPoint analysis is then applied to get five selections from the scans. The selections given should prompt readers to do a chart review using their own analysis process. This letter is not a call for a specific action to buy, sell or short any of the stocks provided. There are NO sure things or guaranteed returns on the daily selection of "Diamonds in the Rough."
Helpful DecisionPoint Links:
DecisionPoint Shared ChartList and DecisionPoint Chart Gallery
Price Momentum Oscillator (PMO)
Swenlin Trading Oscillators (STO-B and STO-V)
For more links, go to DecisionPoint.com