
I remember during one of my early February trading rooms, my friend, Richard asked what we should consider as good investments should Russia invade Ukraine. At the time, I felt that besides nearly all of the Energy sector, the industry groups of Aerospace and Defense and Industrials in general would likely see some love. Defense was the winner of the two since the beginning of February, but both are outperforming right now.
I'm surprised at myself that I didn't consider Cybersecurity, Biotechs and Solar. Cybersecurity is an obvious one given the Russians propensity to hack. Biotechs were overdue for a reversal but I don't know that has anything to do with the war. I'm guessing Solar is popular given it is an alternative form of energy to fossil fuels.
I've picked four stocks today that come from each of the groups I listed above. If you recall Huntington-Ingalls (HII) was a pick from the Defense group last Thursday. It's rallying nicely. No "Stock to Review" today, but both GOOGL and TSLA were in my scan results. I'm not a fan of either chart, but I like to let you know when a FAANG+ stock hits my scans.
Today's "Diamonds in the Rough": AXON, CLDX, HACK and SPWR.

RECORDING LINK (2/25/2022):
Topic: DecisionPoint Diamond Mine (2/25/2022) LIVE Trading Room
Start Time: Feb 25, 2022 09:00 AM PT
Meeting Recording Link.
Access Passcode: Feb@25th
REGISTRATION FOR Friday 3/4 Diamond Mine:
When: Mar 4, 2022 09:00 AM Pacific Time (US and Canada)
Topic: DecisionPoint Diamond Mine (3/4/2022) LIVE Trading Room
Register in advance for this webinar HERE.
Save the registration confirmation email with login instructions in case Zoom doesn't notify you in time.

Free DP Trading Room (2/28) RECORDING LINK:
Topic: DecisionPoint Trading Room
Start Time: Feb 28, 2022 09:00 AM PT
Meeting Recording Link.
Access Passcode: Feb#28th
For best results, copy and paste the access code to avoid typos.
Welcome to DecisionPoint Daily Diamonds, wherein I highlight ten "Diamonds in the Rough" per week. These are selected from the results of my DecisionPoint Scans, which search for stocks that could benefit from the trend and condition of the market. Remember, these are not recommendations to buy or sell, but are the most interesting of the stocks that surfaced in my scans. My objective is to save you the work of the initial, tedious culling process, but you need to apply your own analysis to see if these stocks pique your interest as well. There are no guaranteed winners here!
"Predefined Scans Triggered" are taken from StockCharts.com using the "Symbol Summary" option instead of a "SharpChart" on the workbench.
Axon Enterprise, Inc. (AXON)
EARNINGS: 5/5/2022 (AMC)
Axon Enterprise, Inc. engages in the development, manufacturing, and sale of conducted electrical weapons for personal defense. It operates through the TASER Weapons and Software and Sensors segments. The TASER Weapons segment sells conducted electrical weapons, accessories, and other related products and services. The Software and Sensors segment includes devices, wearables, applications, cloud, and mobile products. The company was founded by Patrick W. Smith and Thomas P. Smith on September 7, 1993 and is headquartered in Scottsdale, AZ.
Predefined Scans Triggered: Bullish MACD Crossovers and P&F Low Pole.
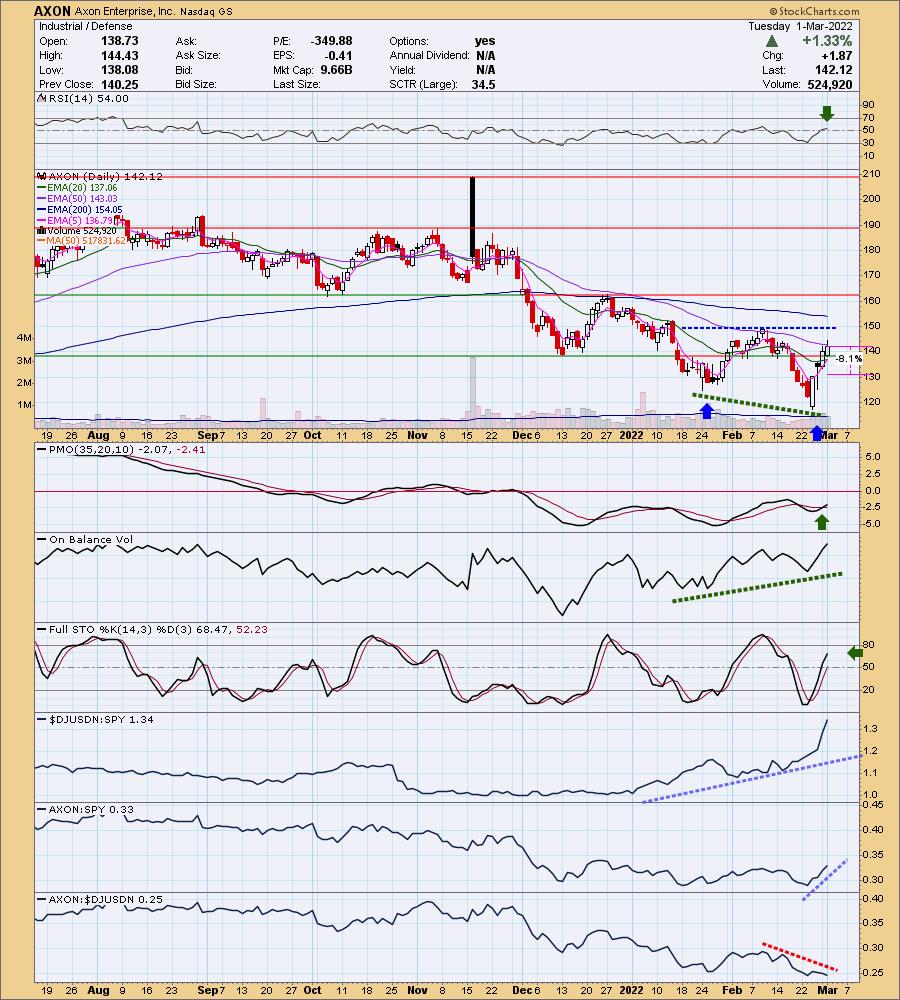
AXON is unchanged in after hours trading. I will say up front that it hasn't been performing well against the group and it is technically in a bear market like the SPY. AXON is competing with LMT, NOC, LHX, among others in the group. Those stocks are "runners" or in vertical rallies. I would look at this one as a "rising tide lifts all boats", but that said, this is a more risky play compared to the standbys I mentioned.
The chart is very positive when you remove the relative strength to the industry group. There is a bullish double-bottom forming. The minimum upside target of that pattern would bring price very close to the October high. The RSI just hit positive territory. The PMO has a new crossover BUY signal. There is a strongly positive OBV divergence (annotated in green). Stochastics are positive and rising. While it hasn't been a stellar performer against the group, it started outperforming the SPY last week. The stop is somewhat arbitrary given support levels don't offer reasonable percentages. I opted to use my typical 8% stop level.
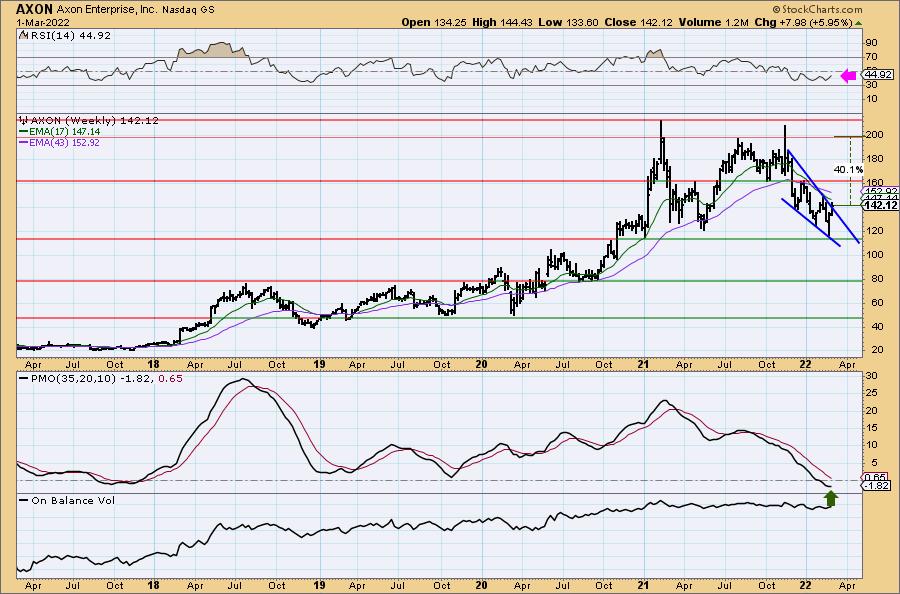
The is a large bullish falling wedge on the weekly chart. Price is attempting to breakout of the pattern. The weekly RSI is negative which isn't good, but the weekly PMO is turning up. The upside target is aligned with the 2021 3rd quarter high.
Celldex Therapeutics Inc. (CLDX)
EARNINGS: 2/28/2022 (AMC) ** Reported Yesterday **
Celldex Therapeutics, Inc. engages in the business of development, manufacturing and commercialization of novel therapeutics for human health care. Its drug candidates have the ability to engage the human immune system and directly inhibit tumors to treat specific types of cancer and other diseases. Its pipeline includes Varlilumab, CDX-1140, and CDX-301, and CDX-3379. The company was founded by Anthony S. Marucci and Tibor Keler in 1983 and is headquartered in Hampton, NJ.
Predefined Scans Triggered: Elder Bar Turned Green and Parabolic SAR Buy Signals.
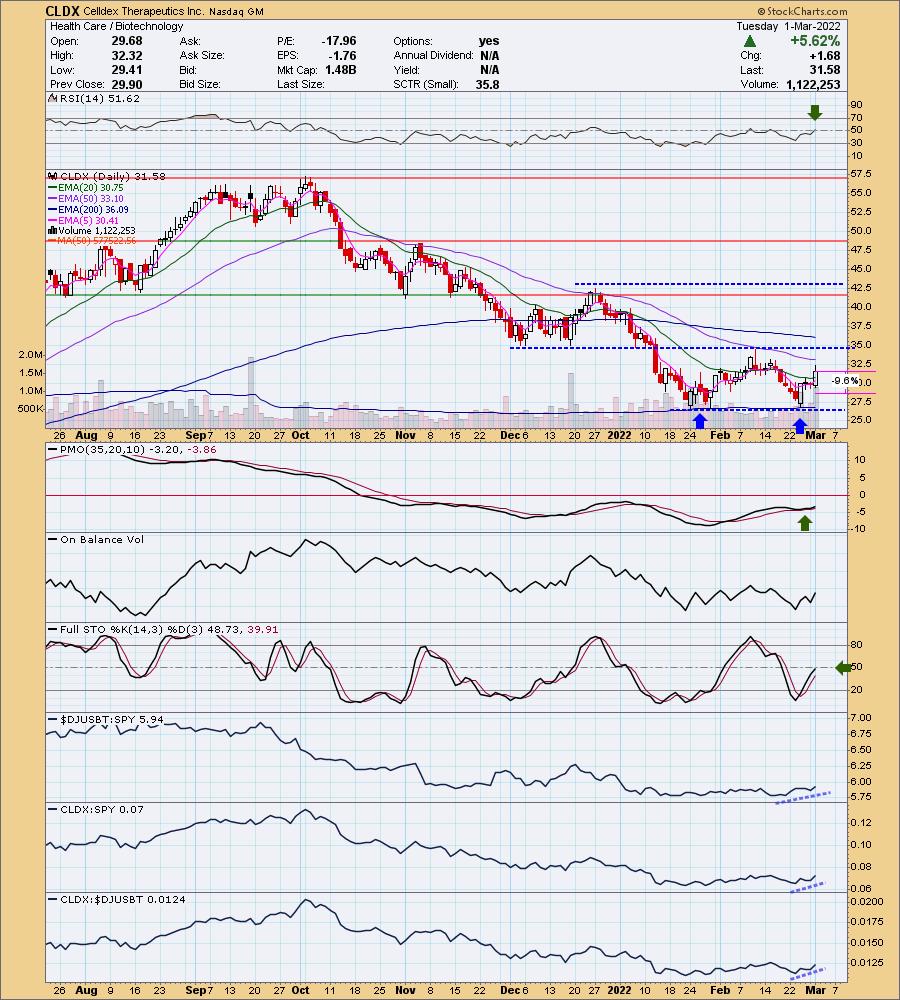
CLDX is unchanged in after hours trading. They reported earnings yesterday and the price action following was favorable. There is a double-bottom pattern forming. Price has overcome resistance at the 20-day EMA, but now it has two more areas of resistance to break through, the 50-day EMA and the confirmation line of the pattern. Of course if it overcomes both of those, it still has the 200-day EMA to contend with. The indicators are bullish with the RSI just hitting positive territory above net neutral (50), a PMO bottom above the signal line and rising Stochastics. Relative strength is starting to improve for the group and CLDX. It's a Biotech and they can be volatile so I felt forced to set a deeper stop.
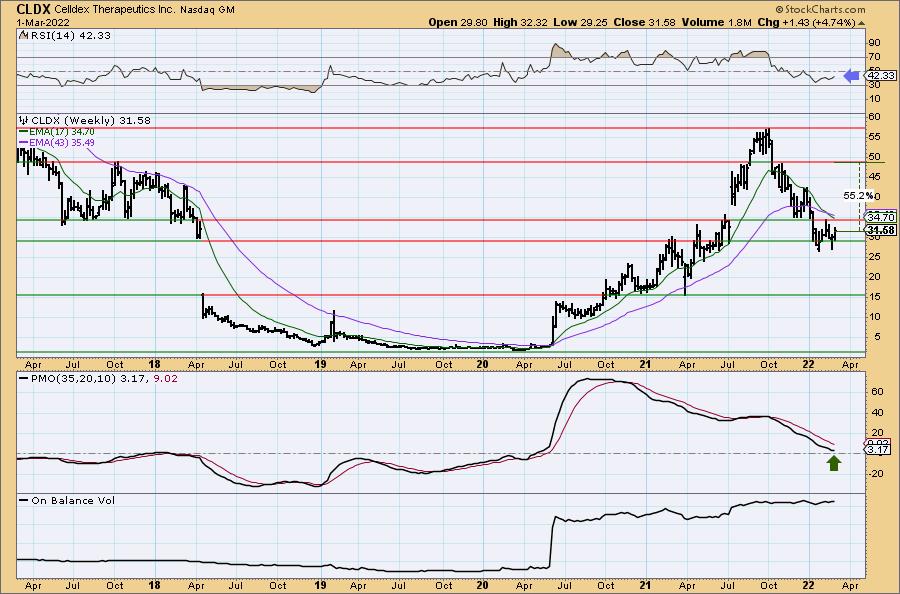
The weekly chart is trying to get bullish. The RSI is rising but still negative. The PMO is decelerating but still falling. If the weekly PMO turns up here, that would be particularly bullish as it would mean a PMO bottom just above the zero line. Upside potential is excellent, but you don't have to wait around. If it goes south, be ready.
PureFunds ISE Cyber Security ETF (HACK)
EARNINGS: N/A
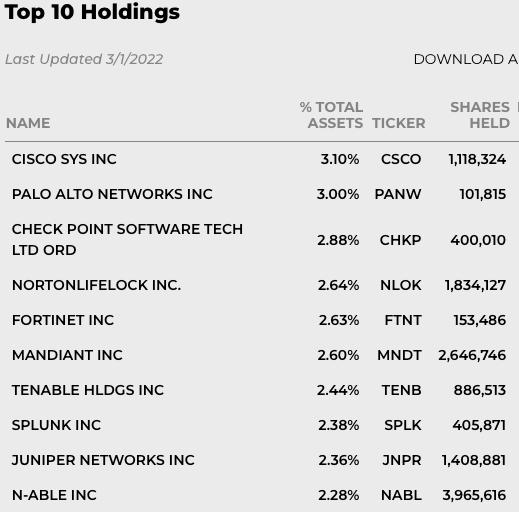
HACK tracks a tiered, equal-weighted index that targets companies actively involved in providing cybersecurity technology and services.
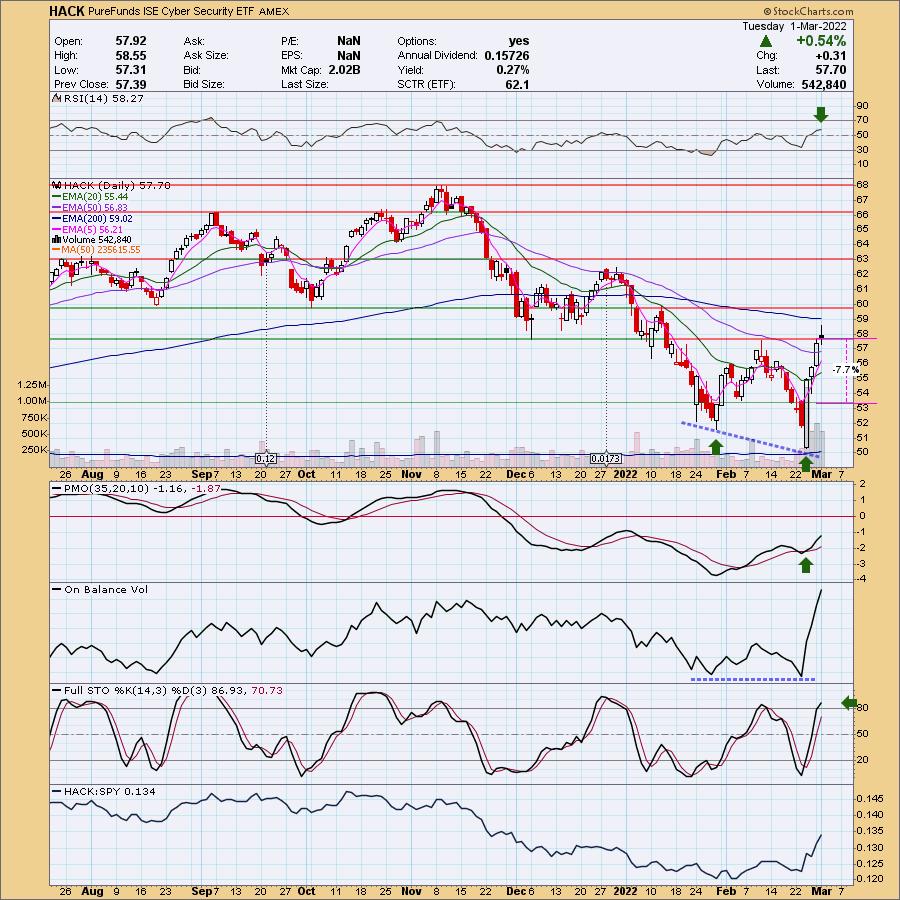
Predefined Scans Triggered: Filled Black Candles, Moved Above Upper Price Channel, P&F Double Top Breakout and P&F Bearish Signal Reversal.
HACK is up +1.11% in after hours trading. I would say nearly all of the Top Ten holdings for this fund look bullish; this ETF is a way to spread your exposure. The chart is very favorable with a giant double-bottom pattern that was "kind of" confirmed with the breakout above the confirmation line. I say "kind of" because price closed on the line forming a bearish filled black candlestick. I still like it. There is a mild OBV positive divergence given OBV bottoms are flat and price bottoms are declining. The RSI is positive and the PMO is on a whipsaw BUY signal. Volume is going through the roof and I expect that to continue with wartime hacking going on. Stochastics are above 80 and still rising. Relative strength for the fund is picking up big time. The stop is still manageable at 7.7%. It is aligned with the early February price low.
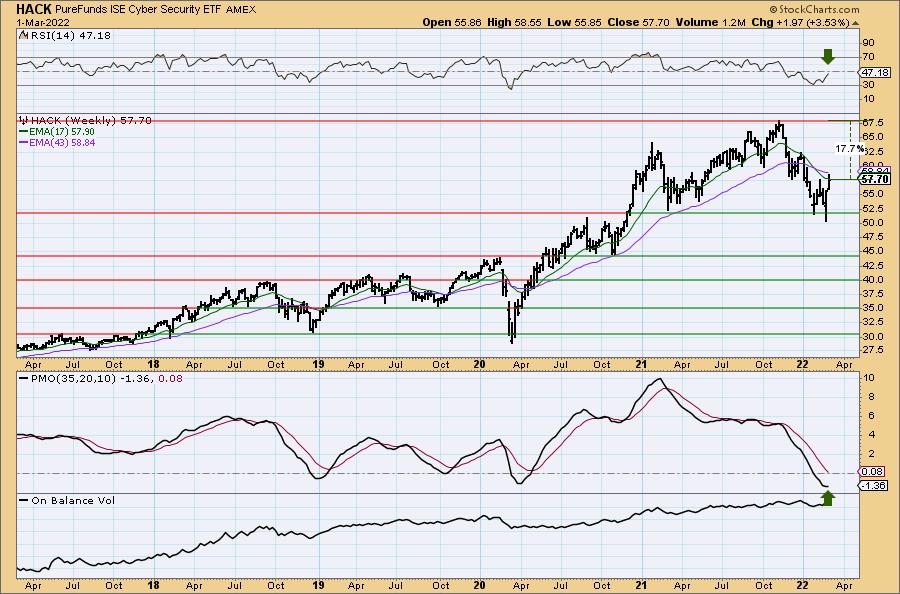
You can see the double-bottom on the daily chart on the weekly chart. Notice that it is bottoming right on strong multi-year support. The weekly RSI is rising and should hit positive territory shortly. The weekly PMO is about to bottom in oversold territory. Upside potential will likely be much higher than this. I expect all-time highs to begin being set soon.
SunPower Corp. (SPWR)
EARNINGS: 5/4/2022 (AMC)
SunPower Corp. engages in the design, manufacture, and delivery of solar panels and systems. It operates through the following business segments: Residential, Light Commercial, Commercial & Industrial Solutions, and Other. The Residential, Light Commercial segment refers to the sale of solar energy solutions, including sales to its third-party dealer network and resellers, storage solutions, cash and loan sales, and long-term leases directly to end customers. The Commercial and Industrial Solutions segment includes direct sales of turn-key engineering, procurement, and construction services and sales of energy under power purchase agreements. The Other Segment consists of worldwide power plant project development, project sales, and U.S. manufacturing. The company was founded by Thomas L. Dinwoodie, Robert Lorenzini and Richard M. Swanson in April 1985 and is headquartered in San Jose, CA.
Predefined Scans Triggered: P&F Double Top Breakout.
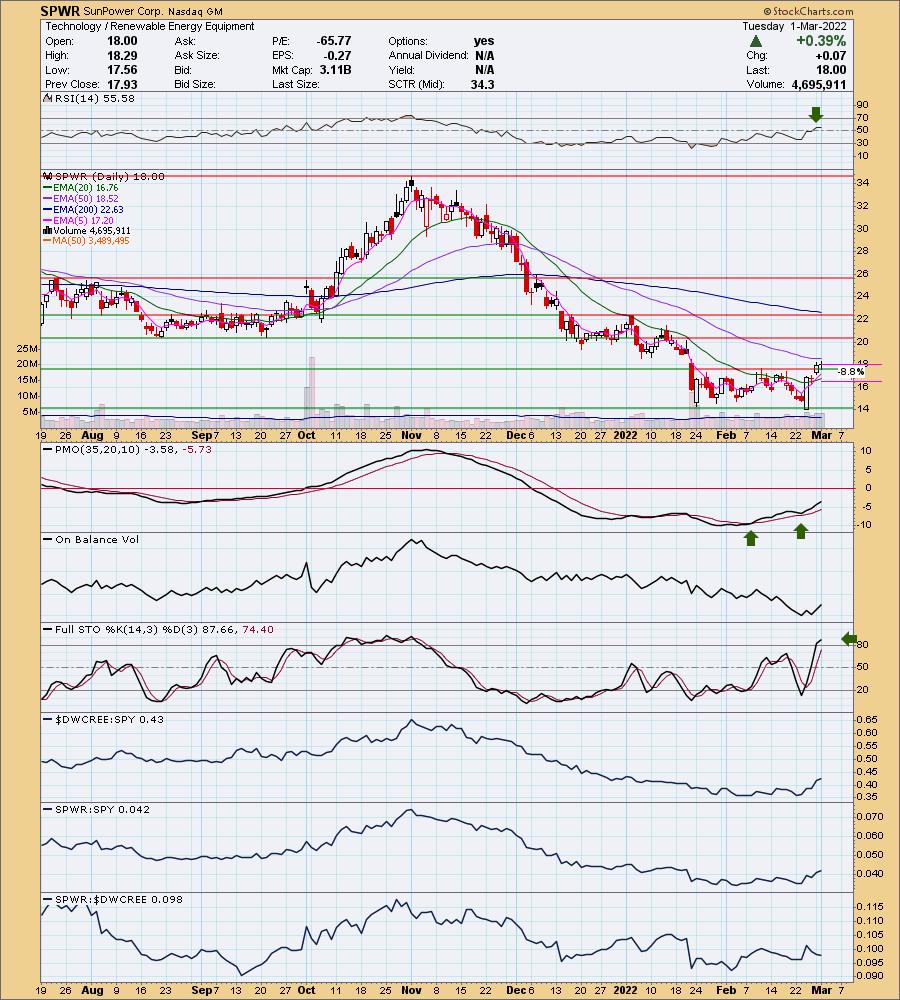
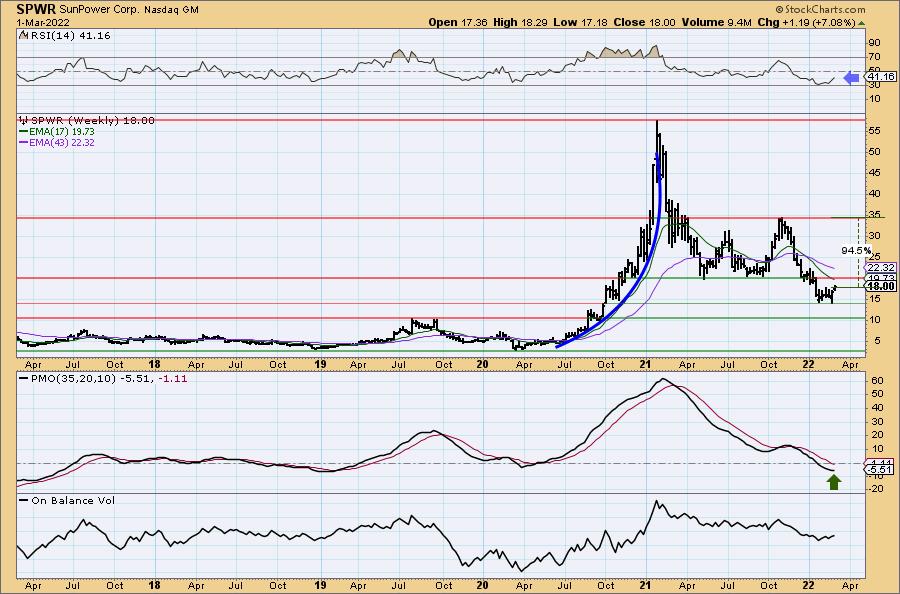
SPWR is up +0.83% in after hours trading. I covered SPWR in the September 30th 2020 report. The position is still open and up +43.9%. At its parabolic top, the position was actually up over 322%! So while 43.9% is good, that is a big ouch if you held onto it this long.
We have a trading range and a breakout this week. There are layers of overhead resistance for SPWR to power through (no pun intended). First up is the 50-day EMA and then the resistance from the August/September lows. The indicators are certainly in line with a continued rally. The RSI is positive and the PMO is rising after a crossover BUY signal from earlier in the month and a PMO bottom above the signal line. I'm not really impressed with volume, but Stochastics look strong. Relative strength against the group is erratic, but it is currently starting to outperform the SPY. The stop is set below the 20-day EMA.
Notice the HUGE parabolic price move in 2020. As we always say, these patterns will breakdown quickly and painfully. Usually they will finally find a resting spot at the last basing pattern. It didn't quite go down that far in 2021, but was on its way before this recent reversal. The weekly RSI is negative, but it is rising. The weekly PMO is still in decline, but is decelerating. Upside potential could be killer on SPWR if the rally in Solar sticks around.
Don't forget, on Thursdays I look at reader-requested symbols, click HERE to shoot me an email. I read every email I receive and try to answer them all!
Current Market Outlook:
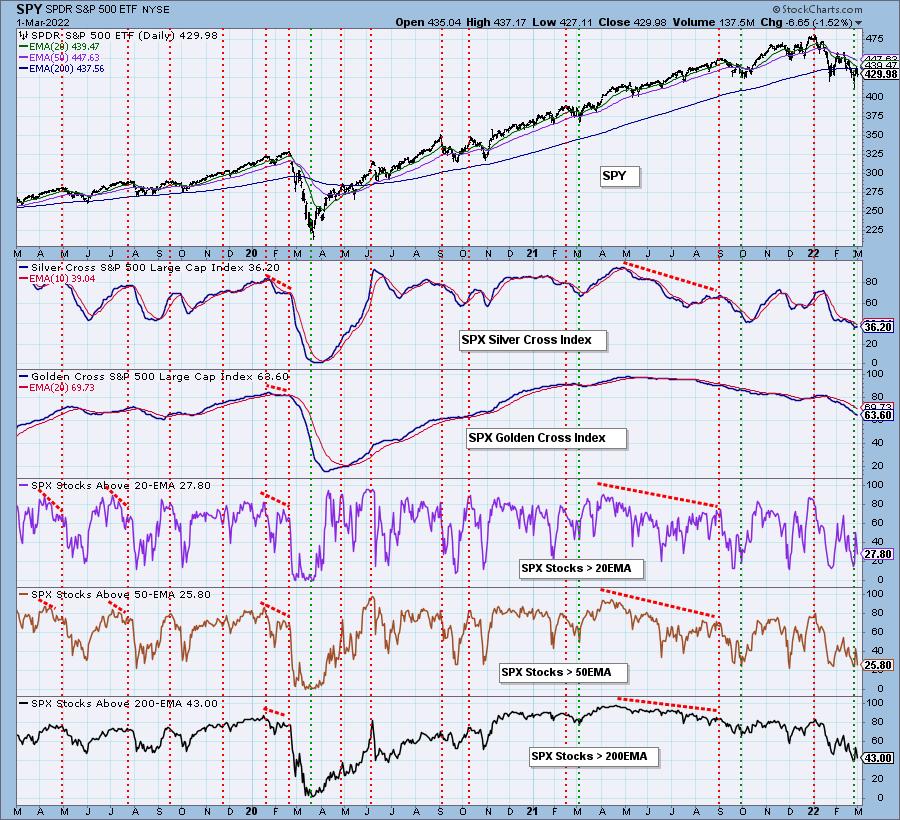
Market Environment: It is important to consider the odds for success by assessing the market tides. The following chart uses different methodologies for objectively showing the depth and trend of participation for intermediate- and long-term time frames.
- The Silver Cross Index (SCI) shows the percentage of SPX stocks on IT Trend Model BUY signals (20-EMA > 50-EMA)
- The Golden Cross Index (GCI) shows the percentage of SPX stocks on LT Trend Model BUY signals (50-EMA > 200-EMA)
Don't forget that as a "Diamonds" member, you have access to our GCI/SCI curated ChartList on DecisionPoint.com. You'll find it under "Members Only" links on the left side on the Blogs and Links Page.
Here is the current chart:
Full Disclosure: I'm 8% invested and 92% is in 'cash', meaning in money markets and readily available to trade with. Probable purchases are ENPH and HACK.
I'm required to disclose if I currently own a stock and/or may buy it within the next 72 hours.
Good Luck and Good Trading!
- Erin
"Technical Analysis is a windsock, not a crystal ball." - Carl Swenlin
(c) Copyright 2022 DecisionPoint.com
Watch the latest episode of DecisionPoint with Carl & Erin Swenlin on Mondays 7:00p EST or on the DecisionPoint playlist on the StockCharts TV YouTube channel here!
NOTE: The stocks reported herein are from mechanical trading model scans that are based upon moving average relationships, momentum and volume. DecisionPoint analysis is then applied to get five selections from the scans. The selections given should prompt readers to do a chart review using their own analysis process. This letter is not a call for a specific action to buy, sell or short any of the stocks provided. There are NO sure things or guaranteed returns on the daily selection of "Diamonds in the Rough."
Helpful DecisionPoint Links:
DecisionPoint Shared ChartList and DecisionPoint Chart Gallery
Price Momentum Oscillator (PMO)
Swenlin Trading Oscillators (STO-B and STO-V)
For more links, go to DecisionPoint.com