
The market finally rebounded. It was a remarkable recovery led primarily by beat down Communication Services (XLC) and Technology (XLK) stocks. The flag bearer was Meta (FB) which was up over 17% today after reporting earnings. FB is currently down -1.19% in after hours trading so a pullback tomorrow wouldn't be surprising.
Readers brought shorts and inverse funds to the table today. It may seem strange given today's rally, but I suspect any upside we see will be short-lived. I'll be reviewing the indicators more closely in a bit as I prepare to write the DP Alert.
Don't forget to register for tomorrow's Diamond Mine trading room! The link is HERE or below. Looking forward to seeing what kind of follow-through we get given today's big rally.
Good Luck & Good Trading,
Erin
What I look for in a short position:
Since two of the positions today are shorts, understand that on the daily chart I'm giving you a "stop" level that is higher than today's current price. We are shorting, so we need to determine how far we will let it rally before covering the short.
On the weekly chart the "targets" are downside targets, not upside targets as I normally do.
I consider a stock a shorting opportunity if strong support has been broken and/or price is far away from the next support level. I want bearish chart patterns if possible. I want to see volume flying out of the stock/ETF.
Today's "Diamonds in the Rough": CAR (Short), CBRL (Short), LABD, and LOB (Short).

Diamond Mine RECORDING LINK (4/22/2022):
Topic: DecisionPoint Diamond Mine (4/22/2022) LIVE Trading Room
Start Time: Apr 22, 2022 09:00 AM
Meeting Recording Link.
Access Passcode: April%22
REGISTRATION FOR 4/29 Diamond Mine:
When: Apr 29, 2022 09:00 AM Pacific Time (US and Canada)
Topic: DecisionPoint Diamond Mine (4/29/2022) LIVE Trading Room
Register in advance for this webinar HERE.
** Save the registration confirmation email with login instructions in case Zoom doesn't notify you in time.**

Free DP Trading Room (4/25) RECORDING LINK:
Topic: DecisionPoint Trading Room
Start Time: Apr 25, 2022 09:00 AM
Meeting Recording Link.
Access Passcode: April@25
For best results, copy and paste the access code to avoid typos.
Welcome to DecisionPoint Daily Diamonds, wherein I highlight ten "Diamonds in the Rough" per week. These are selected from the results of my DecisionPoint Scans, which search for stocks that could benefit from the trend and condition of the market. Remember, these are not recommendations to buy or sell, but are the most interesting of the stocks that surfaced in my scans. My objective is to save you the work of the initial, tedious culling process, but you need to apply your own analysis to see if these stocks pique your interest as well. There are no guaranteed winners here!
"Predefined Scans Triggered" are taken from StockCharts.com using the "Symbol Summary" option instead of a "SharpChart" on the workbench.
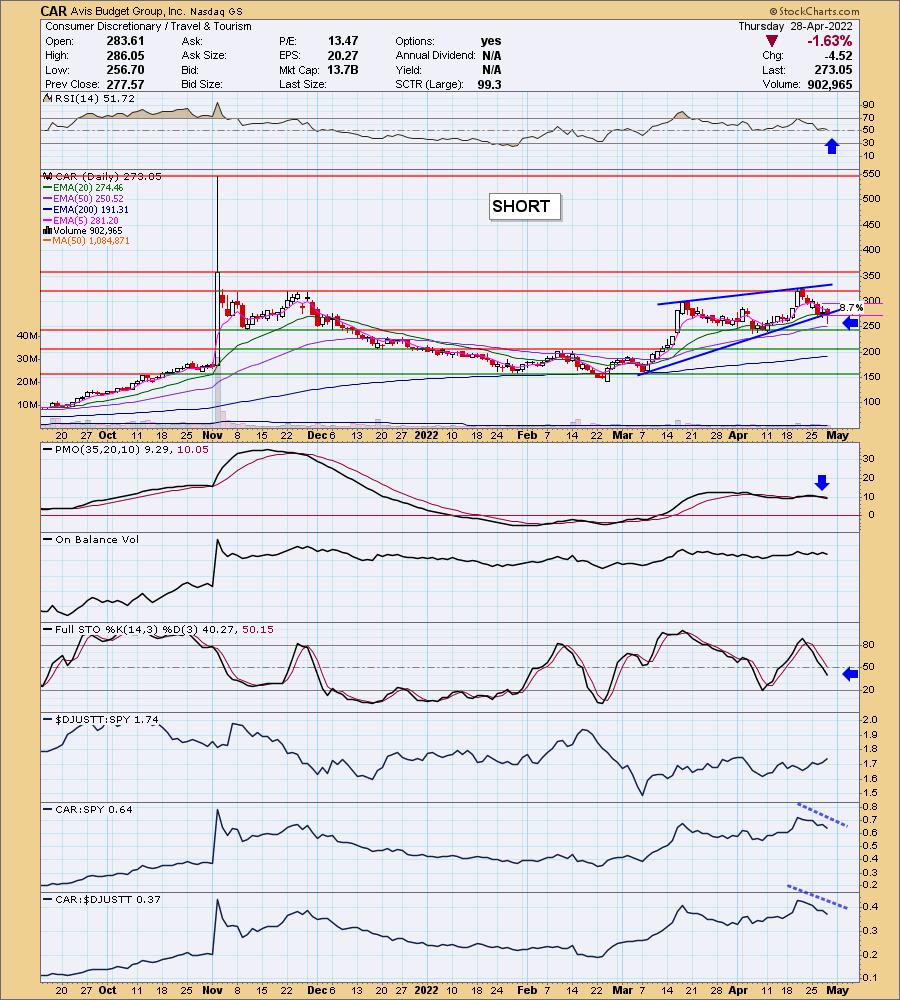
Avis Budget Group, Inc. (CAR) - SHORT
EARNINGS: 5/2/2022 (AMC)
Avis Budget Group, Inc. engages in the provision of vehicle sharing and rental services. It operates through the Americas and International segments. The Americas segment licenses the company's brands to third parties for vehicle rentals and ancillary products and services in North America, South America, Central America, and the Caribbean. The International segment leases out vehicles in Europe, the Middle East, Africa, Asia, and Australasia. The company was founded by Warren E. Avis in 1946 and is headquartered in Parsippany, NJ.
Predefined Scans Triggered: Parabolic SAR Sell Signals and P&F High Pole.
CAR is down -0.66% in after hours trading. I covered CAR on January 21st 2021. The position is still open and is up <drum roll> 553%. I think that is the best one I've had the opportunity to reflect on in DP Diamonds Reports. Remember, while I keep an archive of what was selected, I don't watch them over time.
I believe this time it is a good short opportunity. The RSI is about to enter negative territory. Price is breaking down from a bearish rising wedge formation. It closed beneath the 20-day EMA. The PMO is on a SELL signal and falling. Stochastics are falling and are in negative territory below net neutral (50). The group is starting to show some outperformance. However, CAR is beginning to underperform the SPY and the group. They do report earnings on Monday so be careful, it could go either way. The stop is set above the early April top.
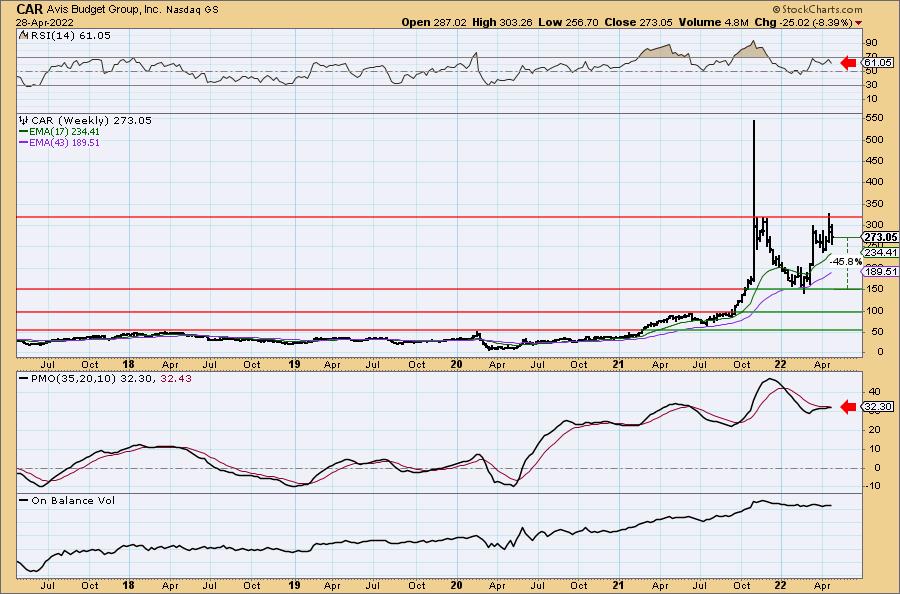
The weekly chart doesn't look that bad given the weekly RSI is positive and the weekly PMO is attempting a crossover BUY signal. What I do like on this chart is the clear failure to overcome resistance. It's way too early to talk about it, but I will anyway; if price does continue to decline, it will have set up a massive bearish double-top. Knowing that this stock is up over 500% since January 2021...I have to believe it is too overbought to continue higher, but we've seen it before. If it tests prior support, the gain on a short would be over 45%.
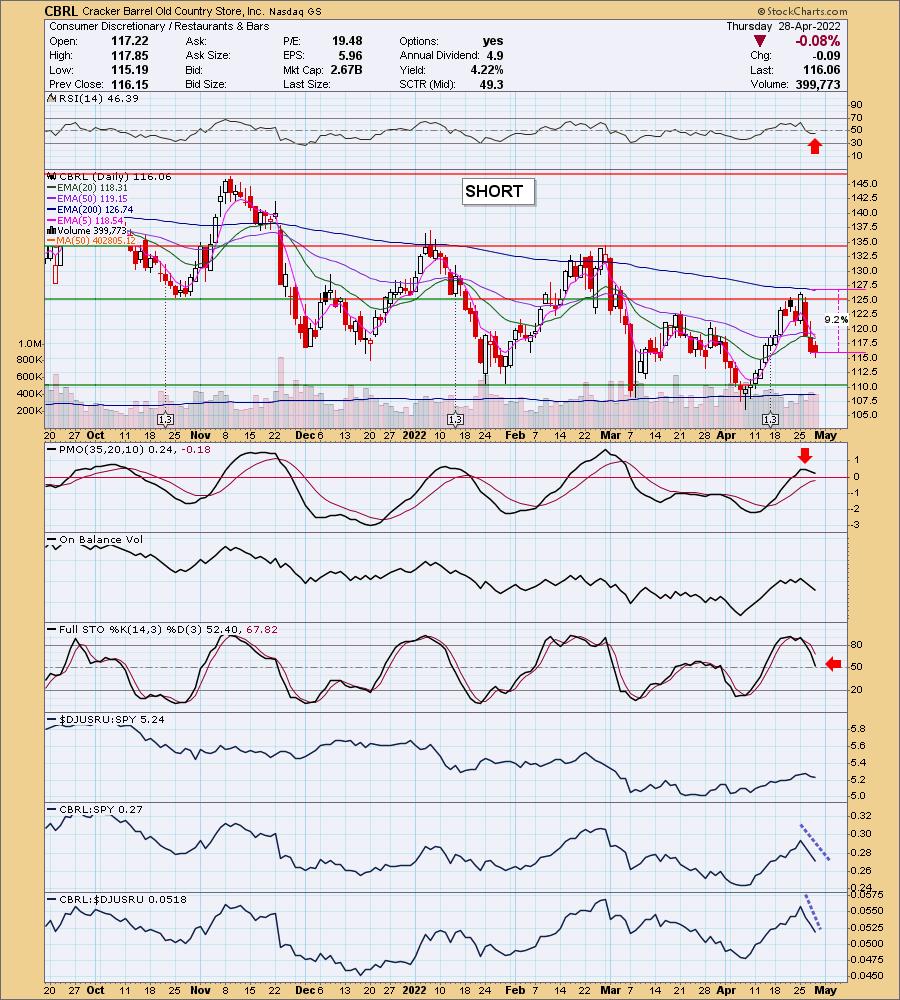
Cracker Barrel Old Country Store, Inc. (CBRL)
EARNINGS: 5/24/2022 (BMO)
Cracker Barrel Old Country Store, Inc. engages in the operation and development of restaurant and retail outlets. The format of its stores consists of a trademarked rustic old country-store design that offers restaurant menu featuring home-style country food. The company was founded by Dan W. Evins on September 19, 1969 and is headquartered in Lebanon, TN.
Predefined Scans Triggered: P&F High Pole.
CBRL is unchanged in after hours trading. Price hit overhead resistance at the 200-day EMA and October low and was turned away. The RSI is negative and the PMO has topped just above the zero line. Volume is flying in on the selling. Stochastics are falling. The group is performing so-so, but CBRL is underperforming both the SPY and the group. The stop is deep but is set at the 200-day EMA which makes the most sense.
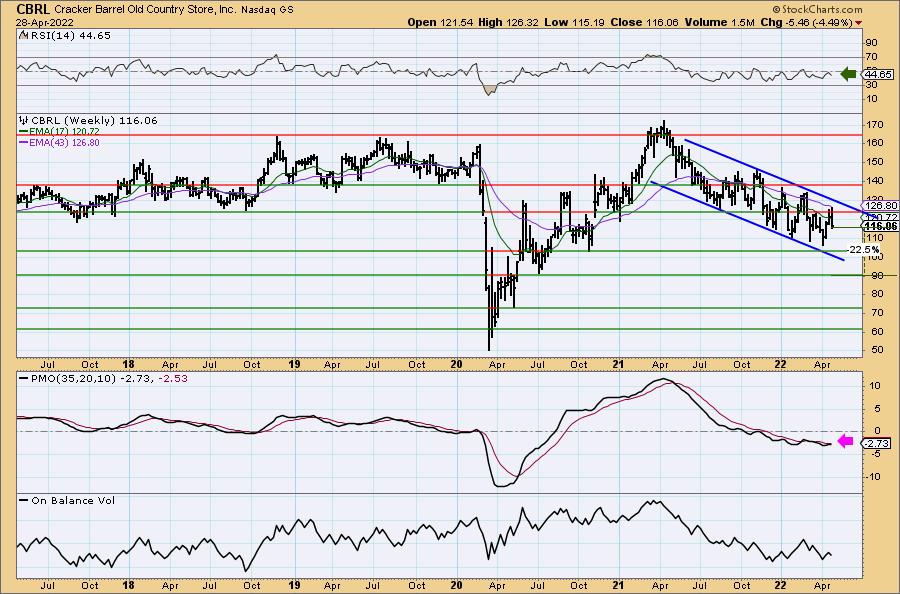
CBRL is in a long-term declining trend channel. The weekly RSI is negative and has been since mid-2021. The strongest level of support was at $130, but that was taken out earlier this year. Next up are the various 2020 lows. You can't see it, but the weekly PMO has turned down beneath its signal line. I decided to set the downside target at $90 support level.
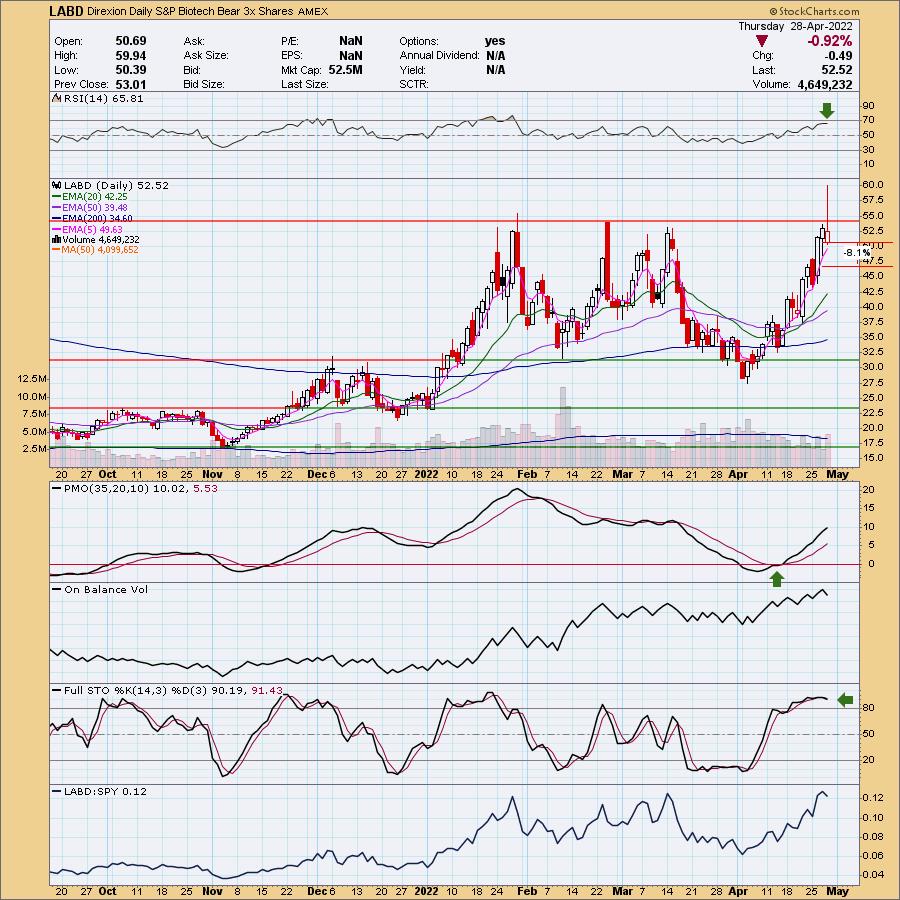
Direxion Daily S&P Biotech Bear 3x Shares (LABD)
EARNINGS: N/A
LABD provides daily 3 times inverse exposure to the S&P Biotechnology Select Industry Index. For more Fund information click HERE.
Predefined Scans Triggered: Elder Bar Turned Blue, New 52-week Highs, Hollow Red candles, P&F Ascending Triple Top Breakout, P&F Double Top Breakout and Shooting Star.
LABD is up +2.99% in after hours trading. I definitely like this chart. It did fail to breakout, but if indicators are correct, we will see that breakout. The RSI is positive and not overbought. The PMO is rising strongly after a crossover BUY signal on the zero line. Volume is coming in as the OBV is confirming the rising trend. Stochastics are above 80 and this fund has performed very well against the SPY.
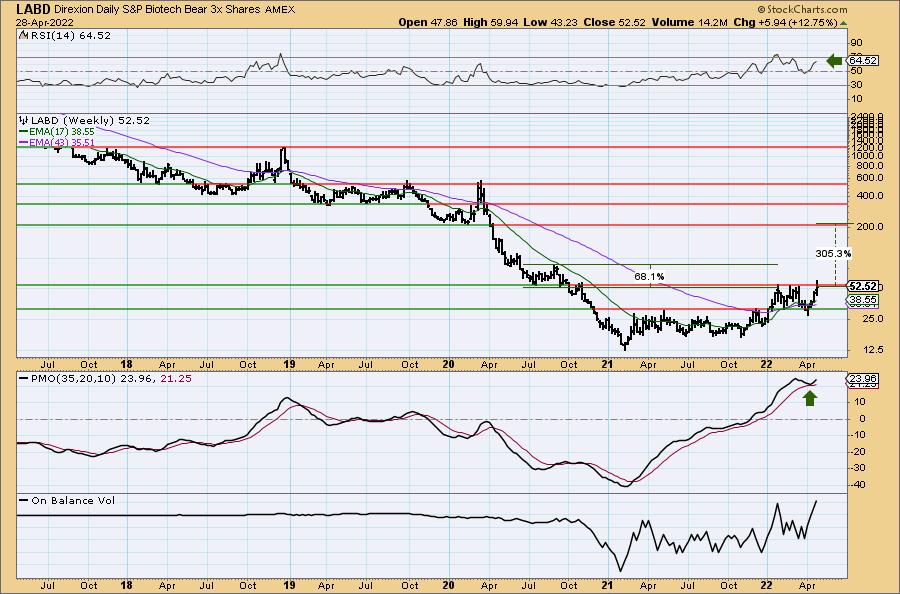
The weekly RSI and the weekly PMO has bottomed above the signal line which is especially bullish. A breakout here would be significant given the long-term strength of this resistance level. If it can reach $200 again that would be an incredible return, I would be satisfied with 68% gain on a test of the mid-2020 top.
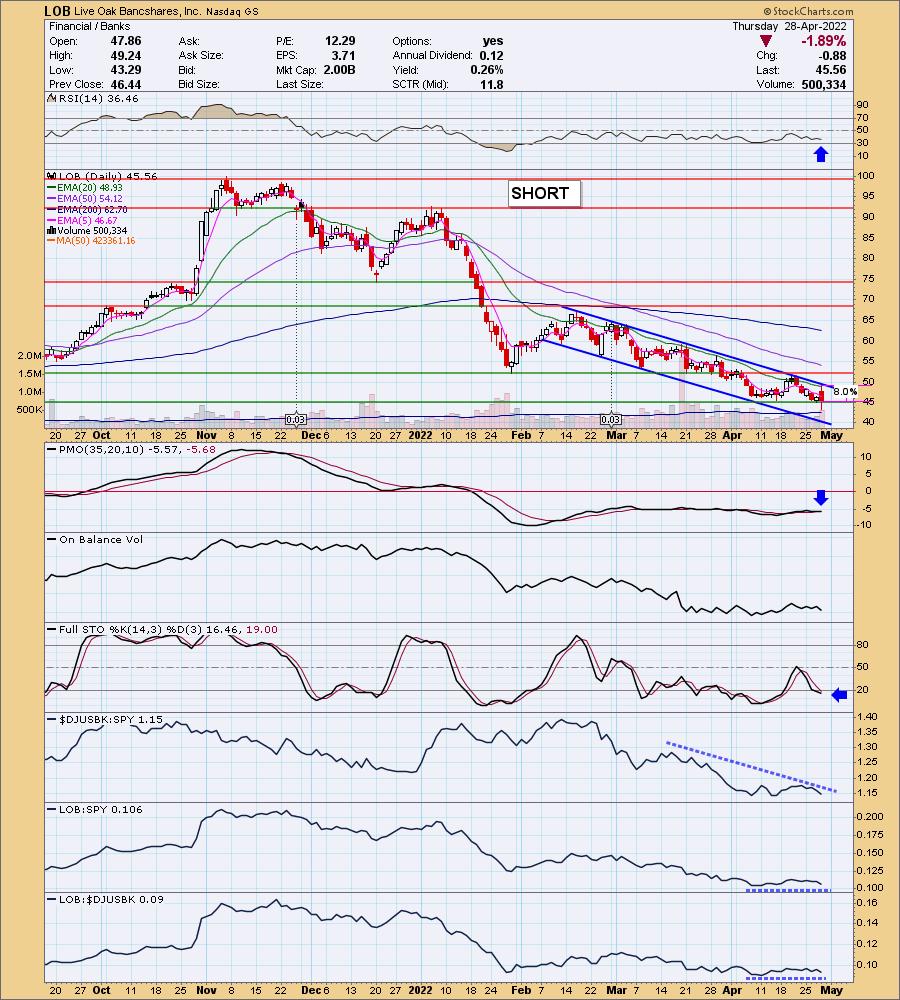
Live Oak Bancshares, Inc. (LOB) - SHORT
EARNINGS: 7/20/2022 (AMC)
Live Oak Bancshares, Inc. is a bank holding company for Live Oak Banking Company, which operates as a national online platform for small business lending. It operates through the following segments: Banking, Fintech, and Other. The Banking segment provides financing services to small businesses nationwide in targeted industries and deposit-related services to small businesses, consumers, and other customers nationwide. The Fintech segment focuses on making strategic investments into emerging financial technology companies. The company was founded by James S. Mahan III on December 18, 2018 and is headquartered in Wilmington, NC.
Predefined Scans Triggered: P&F Descending Triple Bottom Breakdown, New 52-week Lows and P&F Double Bottom Breakout.
LOB is down -1.23% in after hours trading. I covered it on February 11th 2021. The position is open, but the stop is coming close to triggering so it is up a measly +0.04% currently. The position was actually up well over 100% before it began its move back down.
Currently price is in an intermediate-term declining trend channel. The 20-day EMA has also held firm as resistance. The RSI is negative and the PMO is moving down toward a crossover SELL signal. It's been flat because the trend has been so steady, showing no negative or positive momentum. Stochastics just dropped below 20. Performance against the SPY and the group have been in line which we know isn't saying much in a bear market. The group is really struggling against the SPY.
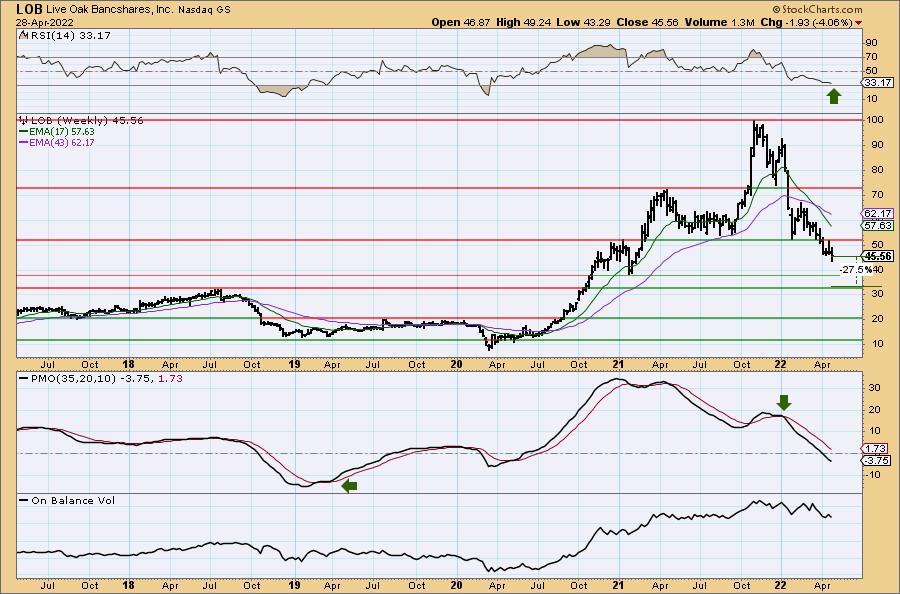
The weekly chart confirms this as a good short. The weekly RSI is negative and falling. The weekly PMO is on an overbought SELL signal and just reached negative territory below the zero line. Downside potential is over 27%.
Don't forget, on Thursdays I look at reader-requested symbols, click HERE to shoot me an email. I read every email I receive and try to answer them all!
Current Market Outlook:
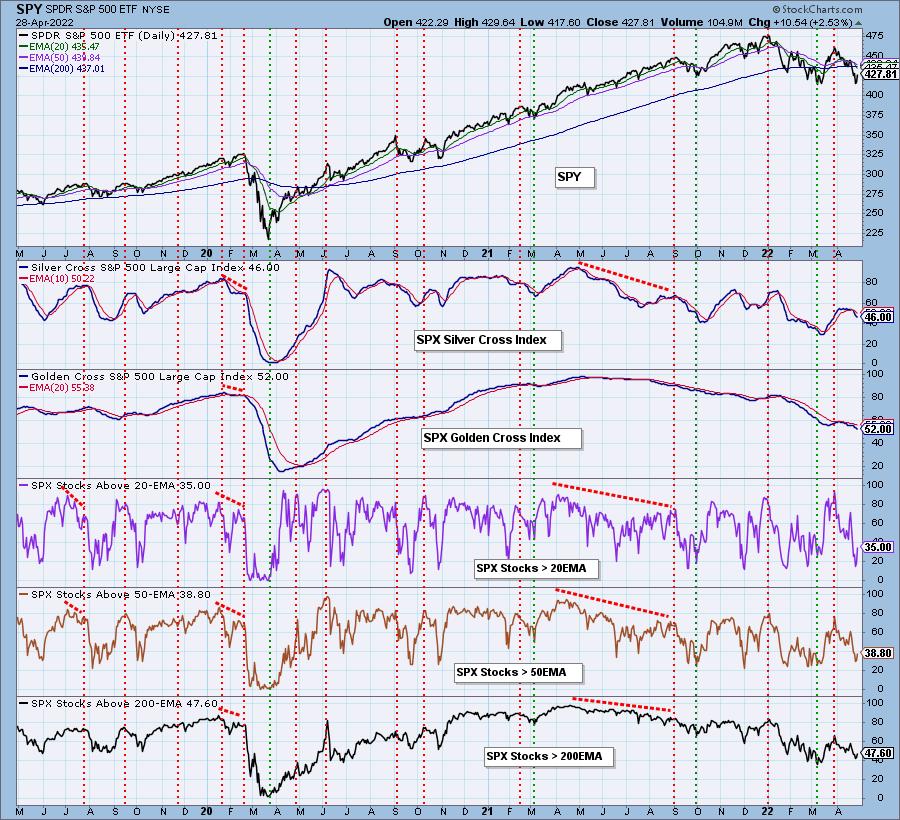
Market Environment: It is important to consider the odds for success by assessing the market tides. The following chart uses different methodologies for objectively showing the depth and trend of participation for intermediate- and long-term time frames.
- The Silver Cross Index (SCI) shows the percentage of SPX stocks on IT Trend Model BUY signals (20-EMA > 50-EMA)
- The Golden Cross Index (GCI) shows the percentage of SPX stocks on LT Trend Model BUY signals (50-EMA > 200-EMA)
Don't forget that as a "Diamonds" member, you have access to our GCI/SCI curated ChartList on DecisionPoint.com. You'll find it under "Members Only" links on the left side on the Blogs and Links Page.
Here is the current chart:
Full Disclosure: I'm 15% invested and 85% is in 'cash', meaning in money markets and readily available to trade with.
I'm required to disclose if I currently own a stock and/or may buy it within the next 72 hours.
"Technical Analysis is a windsock, not a crystal ball." - Carl Swenlin
(c) Copyright 2022 DecisionPoint.com
Watch the latest episode of DecisionPoint with Carl & Erin Swenlin on Mondays 7:00p EST or on the DecisionPoint playlist on the StockCharts TV YouTube channel here!
NOTE: The stocks reported herein are from mechanical trading model scans that are based upon moving average relationships, momentum and volume. DecisionPoint analysis is then applied to get five selections from the scans. The selections given should prompt readers to do a chart review using their own analysis process. This letter is not a call for a specific action to buy, sell or short any of the stocks provided. There are NO sure things or guaranteed returns on the daily selection of "Diamonds in the Rough."
Helpful DecisionPoint Links:
DecisionPoint Shared ChartList and DecisionPoint Chart Gallery
Price Momentum Oscillator (PMO)
Swenlin Trading Oscillators (STO-B and STO-V)
For more links, go to DecisionPoint.com