
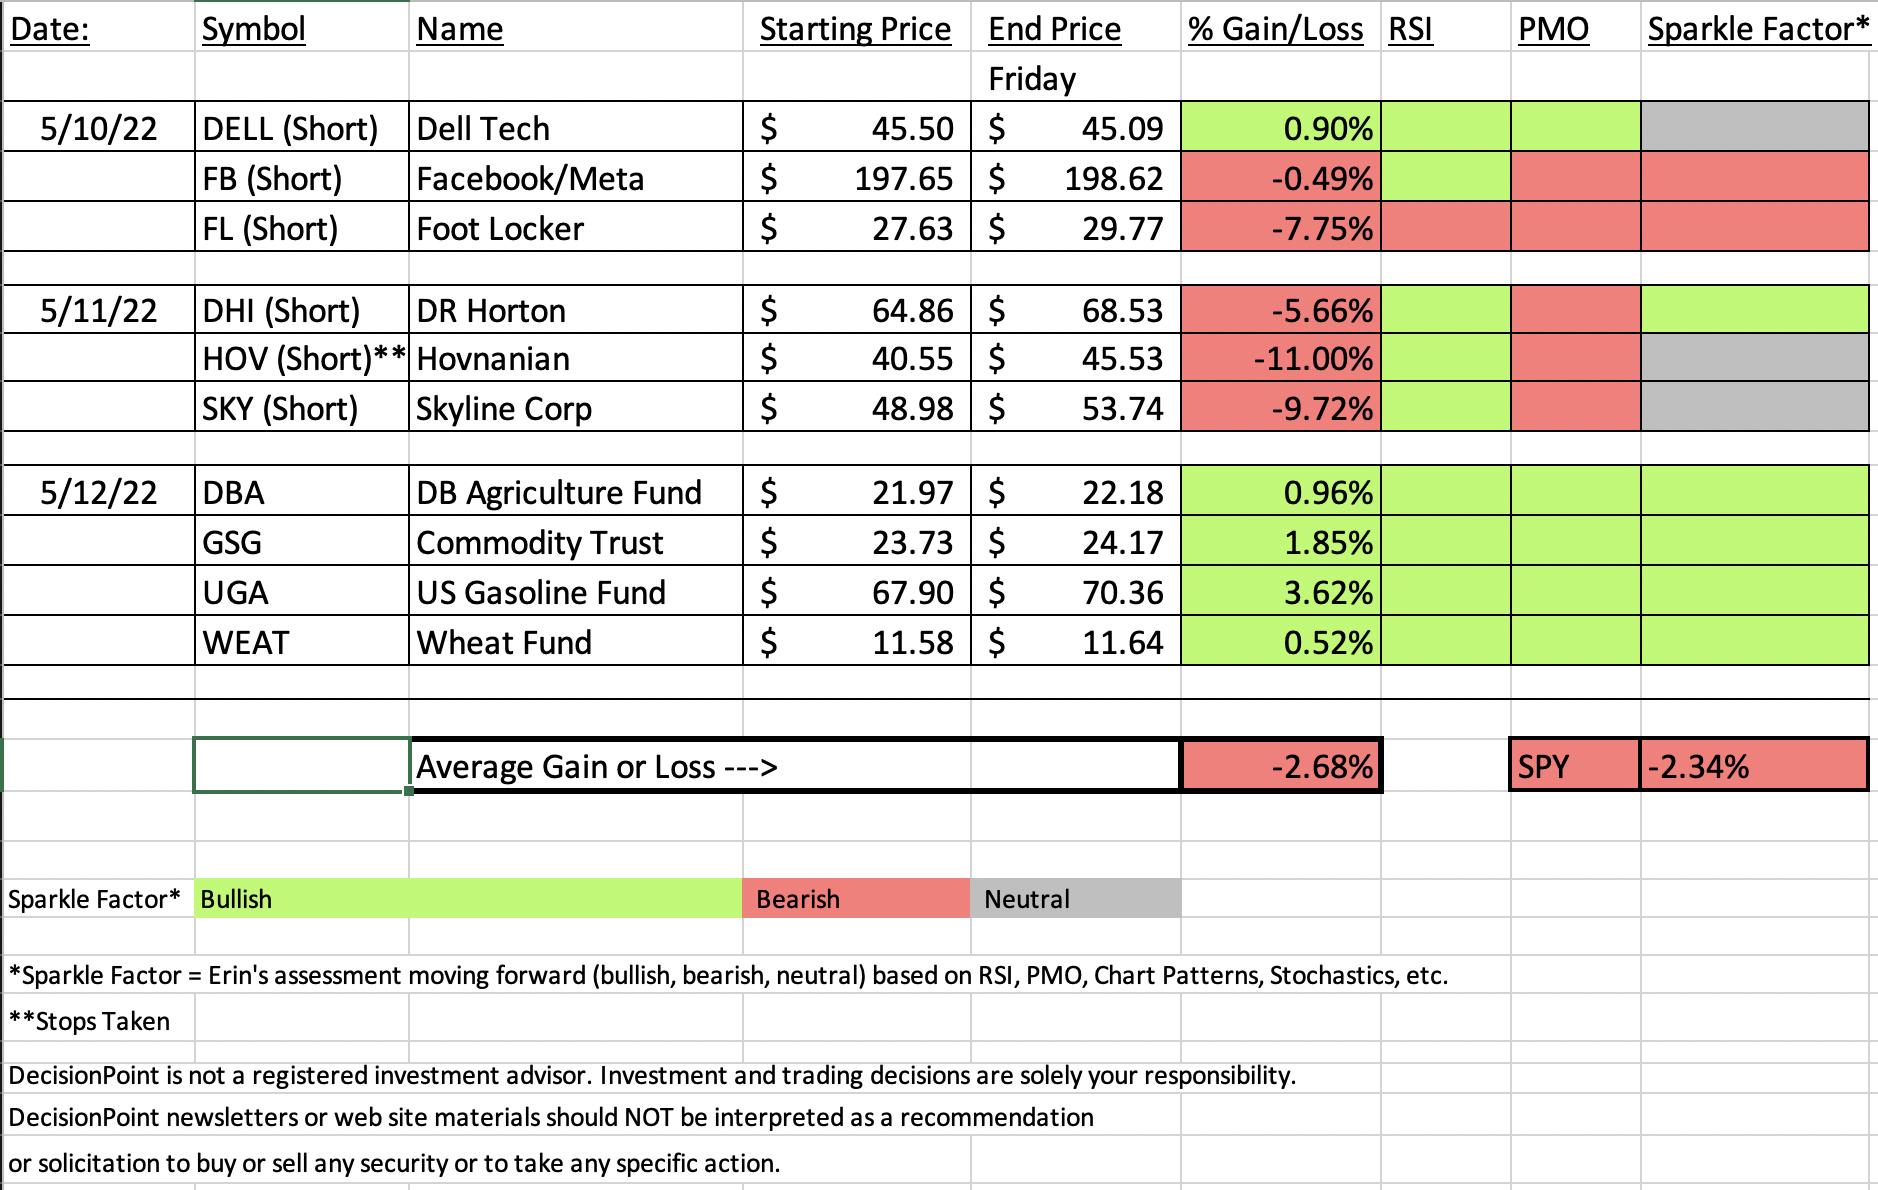
"Diamonds in the Rough" were mixed this week as some of the softer areas of the market rallied today. In particular, Home Builders which had broken below long-term support decided to rally strongly. Having presented them on the short side, it killed the spreadsheet. I suppose it is a great illustration of why we should diversify. By concentrating too heavily on one industry group, it's either a superb return or a loss.
I still am not liking that industry group so those stocks are great watch list material. They are already beginning to reach resistance levels that could prove too difficult to overcome.
Concentrating on commodities did help us out and after their consolidation, pullbacks or pauses, I think the time is ripe. So Home Builders were a fail, but commodities were not. Full disclosure: I added WEAT and am awaiting an entry on UGA (this week's "Darling").
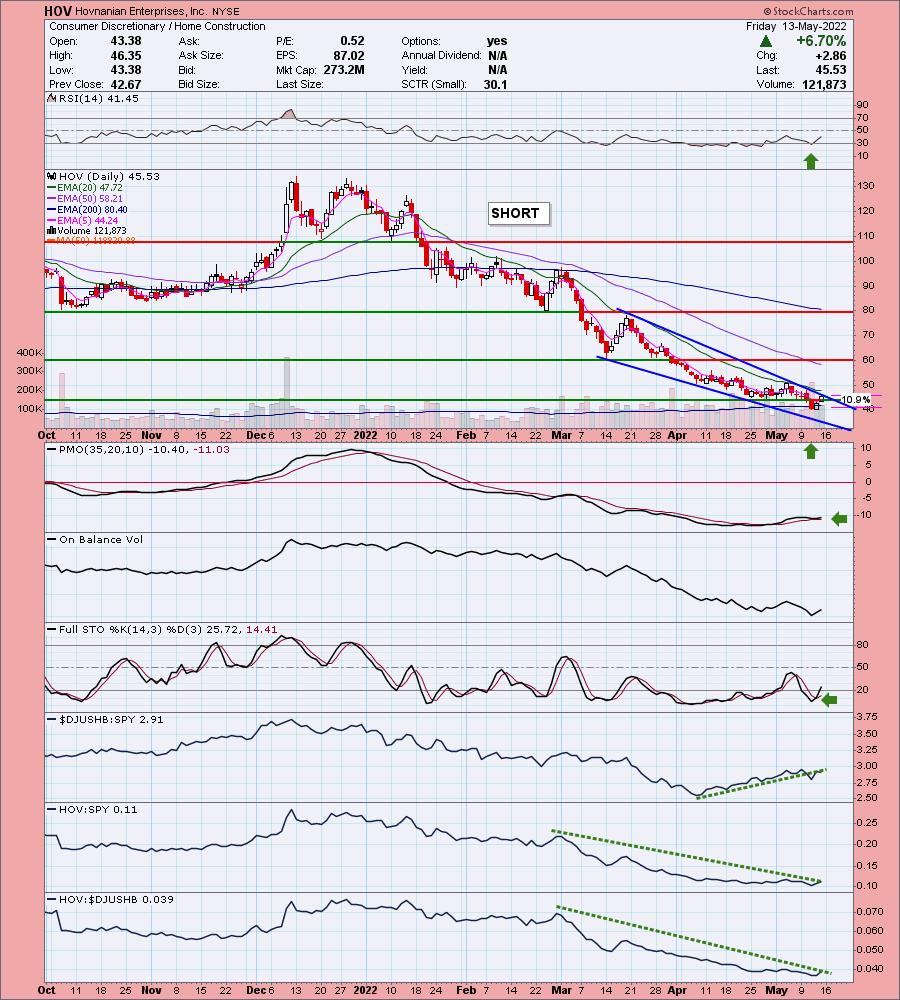
This week's dud was the short position on Hovnanian (HOV). The upside stop was hit at 11%. Looking at the 5-minute candlestick chart, I do see how you could've gotten caught on the wrong side of this one, but today's opening gap up would have probably gotten you out quickly with a far better finish than on our spreadsheet.
Have a great weekend! See you in Monday's free trading room! Next Diamonds report will be on Tuesday, 5/17.
Erin

RECORDING LINK (5/13/2022):
Topic: DecisionPoint Diamond Mine (5/13/2022) LIVE Trading Room
Start Time: May 13, 2022 09:00 AM
Meeting Recording Link.
Access Passcode: May@0513
REGISTRATION FOR Friday 5/20 Diamond Mine:
When: May 20, 2022 09:00 AM Pacific Time (US and Canada)
Topic: DecisionPoint Diamond Mine (5/20/2022) LIVE Trading Room
Register in advance for this webinar HERE.
Save the registration confirmation email with login instructions in case Zoom doesn't notify you in time.

Free DP Trading Room (5/9/2022) RECORDING LINK:
Topic: DecisionPoint Trading Room
Start Time: May 9, 2022 08:59 AM
Meeting Recording Link.
Access Passcode: May#on9th
For best results, copy and paste the access code to avoid typos.
A few items about the spreadsheet: I've put on the spreadsheet whether the RSI is positive (green) or negative (red). The PMO column tells you if it is rising (green) or falling (red). Finally I've added my own "Sparkle Factor" that gives you my assessment going forward, bullish (green), bearish (red) or neutral (gray). The Sparkle Factor is basically my thoughts on whether I expect it to rise or fall. A neutral means it could really go either way so it could be added to a watch list. If you're in a stock I consider "neutral" going forward, the ball is in your court.
Darling:
United States Gasoline Fund, LP (UGA)
EARNINGS: N/A
UGA holds near-month NYMEX futures contracts on reformulated gasoline blendstock for oxygen blending (RBOB) gasoline. For more information click HERE.
Predefined Scans Triggered: New CCI Buy Signals, Elder Bar Turned Green, New CCI Buy Signals, New 52-week Highs and Moved Above Upper Price Channel.
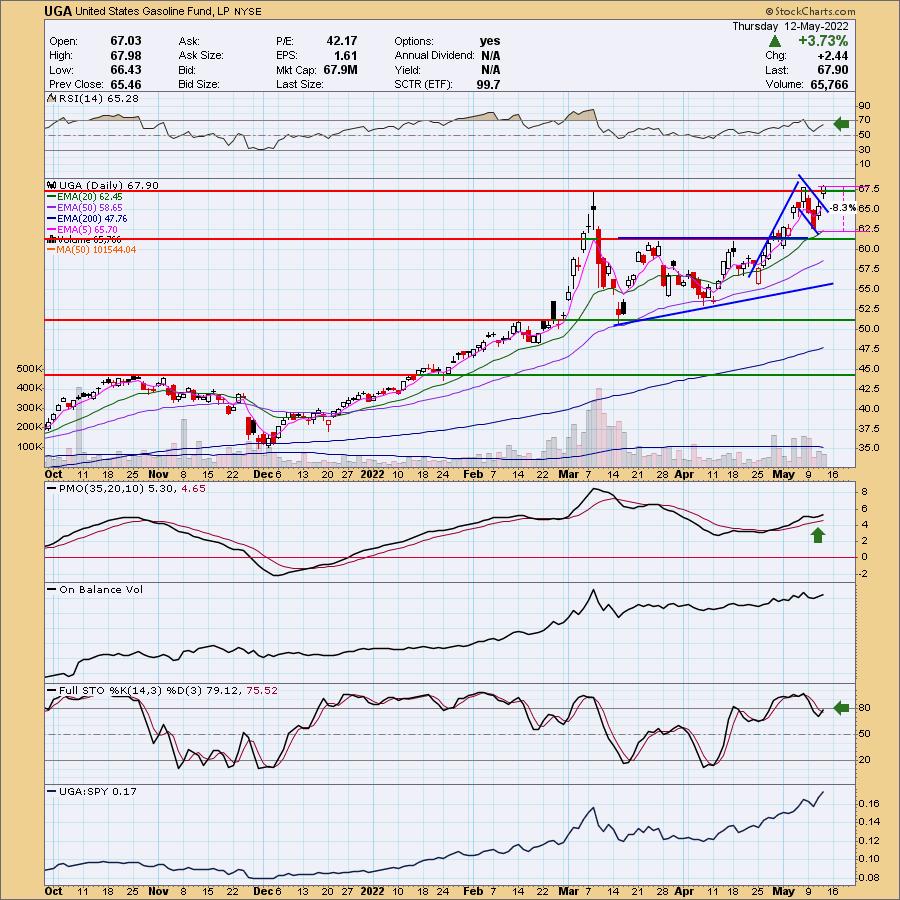
Below are the commentary and chart from yesterday (5/12):
"UGA is down -0.03% in after hours trading. Price is breaking out again and today closed at a new 52-week high. The RSI is positive and the PMO has bottomed above the signal line. Stochastics have turned back up. After pulling back in March, price has been consolidating sideways. A bullish ascending triangle had formed and we got the expected breakout. Now we have a bull flag leading into today's gap up. I will say that it barely makes my average daily volume requirement of 100,000 or more, but volume has been flying in since the war in Ukraine took off. The stop is set below the 20-day EMA and bottom of the flag."
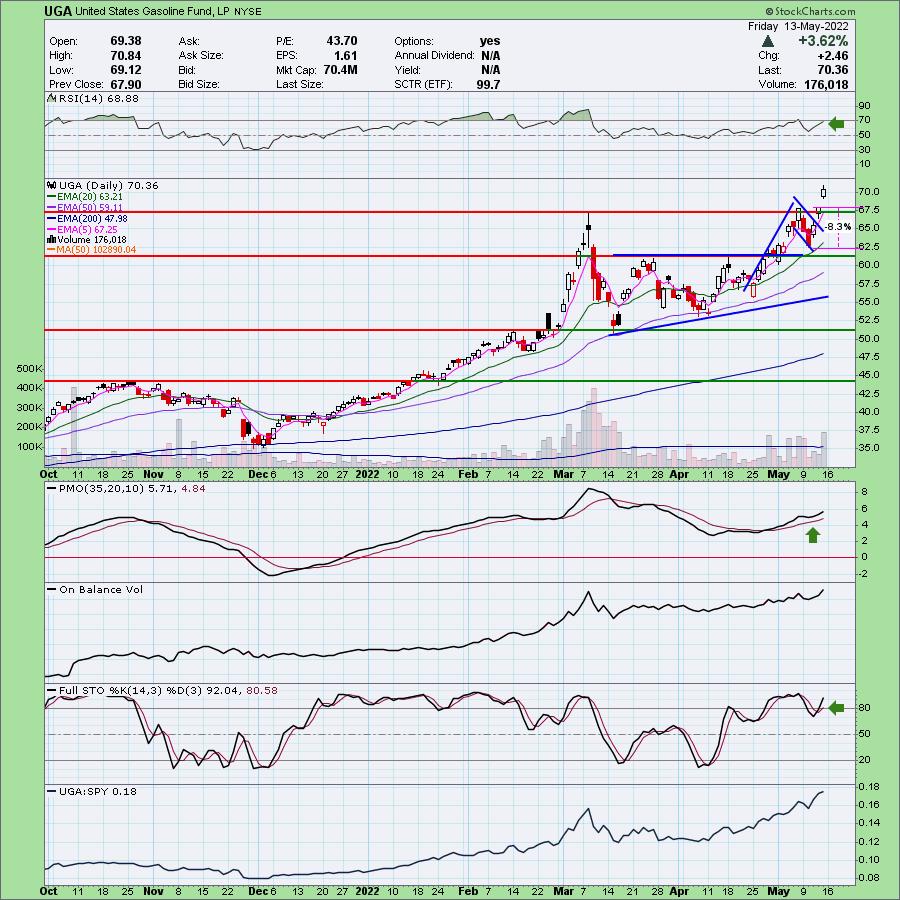
Here is today's chart:
The upside expectation of the bull flag is $80.00. The chart is looking better and better. This is the Energy sector obviously and spoiler alert, that is the "Sector to Watch" this week. We do have a gap up so there is the risk this is a possible island reversal pattern that suggests price could gap down and leave today's candle (or a few subsequent candles) alone like an "island". I'm looking for an entry. By the time I could get to it, the 5-minute PMO was in decline and it never quite turned up today. I have it on my radar.
Don't forget, on Thursdays I look at reader-requested symbols, so shoot me an email at erin@decisionpoint.com. I read every email I receive and try to answer them all!
Dud:
Hovnanian Enterprises, Inc. (HOV) - Short
EARNINGS: 6/2/2022 (BMO)
Hovnanian Enterprises, Inc. is a homebuilding company, which engages in the design, construction, and marketing of single-family attached town homes and condominiums, urban infill, and planned residential developments. It operates through the following segments: Homebuilding, Financial Services, and Corporate. The Homebuilding segment consists of the following geographical segments: Northeast, Mid-Atlantic, Midwest, Southeast, Southwest, and West. The Financial Services segment offers mortgage loans and title services to the customers of homebuilding operations. The Corporate segment refers to the executive offices, information services, human resources, corporate accounting, training, treasury, process redesign, internal audit, construction services, and administration of insurance. The company was founded by Kevork S. Hovnanian in 1959 and is headquartered in Matawan, NJ.
Predefined Scans Triggered: Moved Below Lower Bollinger Band, P&F Triple Bottom Breakdown, New 52-week Lows, P&F Double Bottom Breakout and Moved Below Lower Keltner Channel.
Below are the commentary and chart from Wednesday (5/11):
"HOV is unchanged in after hours trading. I've covered HOV twice. January 19th 2021 (Position about to hit stop, was up over 290% at the top!) and December 1st 2021 (stop has been triggered, but was up 34% at the top). Major support was lost today on the daily chart. The RSI is now in oversold territory, but notice in April it spent most of its time there. The PMO has topped well below the zero line and should trigger a crossover SELL signal soon. Stochastics are in the basement and still dropping. Volume has been flying out of this one. This is another with terrible relative strength against the group and SPY. This was another stock that was hard to set a stop on. You'll want it to be above the support level that was broken today."
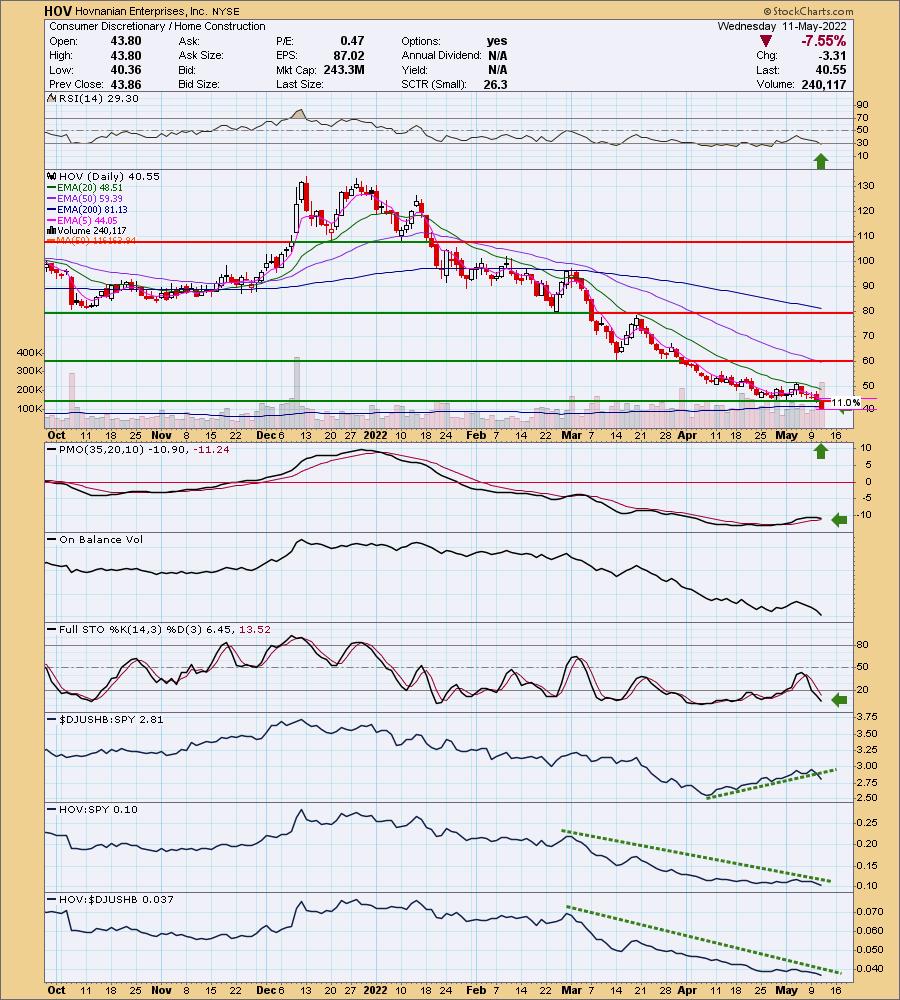
Here is today's chart:
HOV was up a whopping 12%+ after it was picked on Wednesday. Consequently I had to take the 11% stop. I've given it a "neutral" Sparkle Factor because it hasn't broken above the 20-day EMA or the declining tops trendline. However, I do also note a bullish falling wedge pattern. It's a toss up, but I think I'd stay away from this on the short side. It isn't bullish enough for the long side either. The PMO has turned up above its signal line and Stochastics are rising. The RSI is still negative. Probably don't need this one in your watch list.
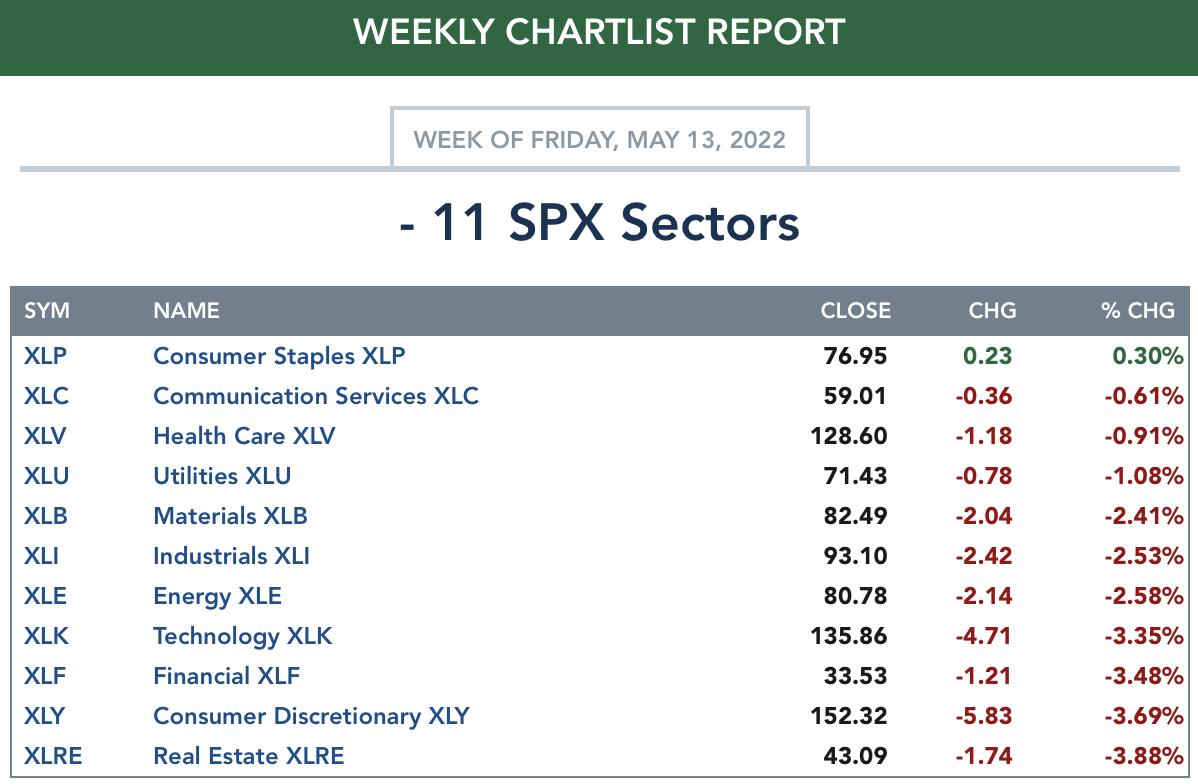
TODAY'S Sector Performance:
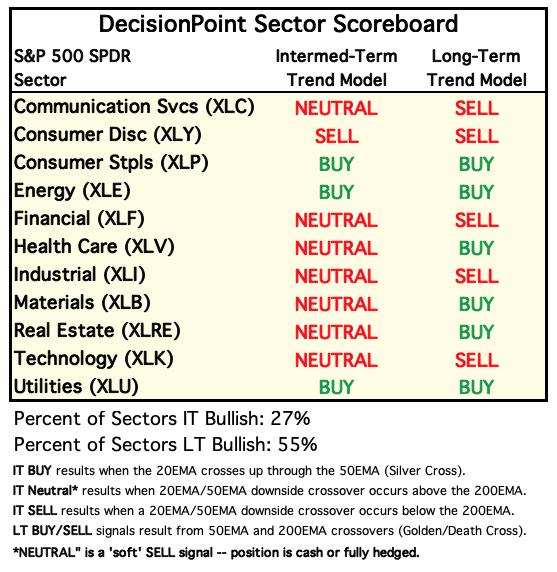
DecisionPoint Sector Scoreboard (Mechanical Trend Model Signals):
Click Here to view Carl's annotated Sector ChartList!
$ONE is the current benchmark on the RRGs:
It occurred to Carl and I that using the SPY as a benchmark is useless right now. The SPY is in a bear market so sectors could be moving lower, but still outperform the SPY. One way to get around this problem is to use $ONE was the benchmark. By using $ONE, you get to see ACTUAL performance in relation to other sectors. The picture is completely different, but far more accurate. We have decided to only use the $ONE Weekly version of the RRG. I believe it is more accurate as to the market environment.
Intermediate-Term (Weekly) $ONE RRG:
The weekly RRG hasn't been changing much, which I actually appreciate. Readers had mentioned that the daily RRGs were very jumpy and I believe, somewhat misleading.
There are three sectors in the Leading quadrant. XLB, XLV and XLU. All of them have bearish southwest headings so they are getting relatively weak. The closer they are to the center point, the closer they get to "no change" in performance. Of the three, XLU is the best given its distance from the center point, despite its bearish southwest heading. Still, not a sector we would want to join as its performance is deteriorating, not getting stronger.
XLRE is in the Improving quadrant but has a bearish southwest heading. It is also near the center of the graph. Performance is waning.
XLE (the Sector to Watch) as well as XLP (the runner up) are in the Weakening quadrant. XLP is headed for the center of the graph, but also toward Leading. XLE doesn't look as appetizing given its southward descent into the Weakening quadrant, but it is far from the center point, which is good. However, a look at the sector chart suggests it is gaining participation again.
All other sectors are in the Lagging quadrant with bearish southwest headings with the exception of XLF which has a northwest heading. XLF looks slightly better than the rest as it is pointed toward the Improving quadrant; however, it has a LONG way to go before it gets there and its underperformance has been damaging given its bearish location in the Lagging quadrant.
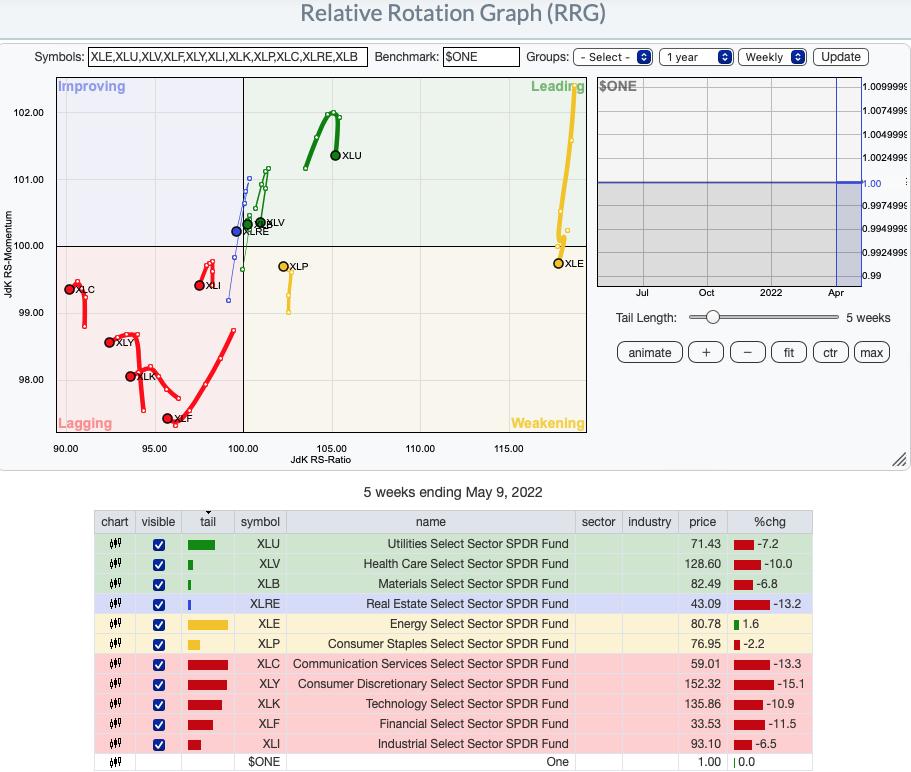
RRG® charts show you the relative strength and momentum for a group of stocks. Stocks with strong relative strength and momentum appear in the green Leading quadrant. As relative momentum fades, they typically move into the yellow Weakening quadrant. If relative strength then fades, they move into the red Lagging quadrant. Finally, when momentum starts to pick up again, they shift into the blue Improving quadrant.
CLICK HERE for an animated version of the RRG charts.
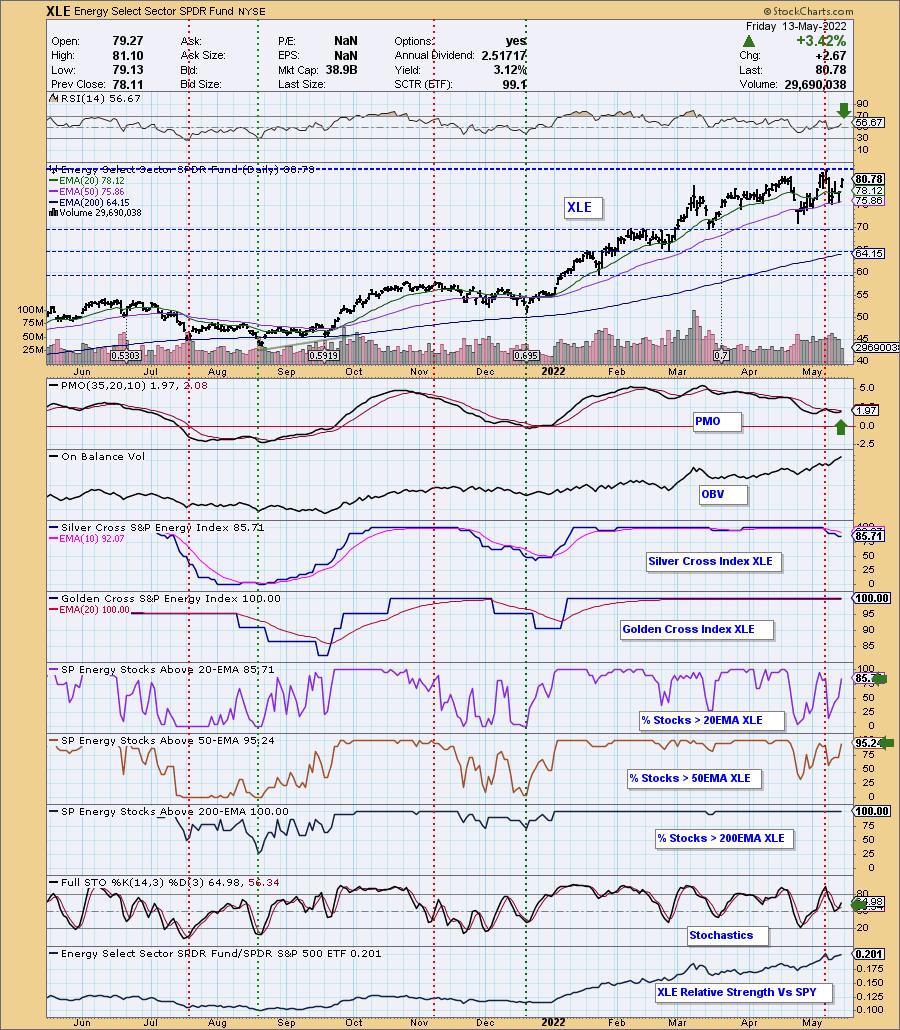
Sector to Watch: Energy (XLE)
You'll be shocked to hear that I was considering Technology (XLK), very briefly. However, I just don't buy that this sector is ready for a solid recovery. We could see a continuation of today's rally on Monday and I bet it will come out of the tech sector. It's too risky for my taste and way too short-term.
XLP was a possibility, but ultimately I decided to go with Energy. My main reason was that XLP hadn't broken above the 20-day EMA. Participation was stronger within Energy too. The PMO is rising and nearing a crossover BUY signal in near-term oversold territory. Participation is solid. The SCI is well above the 70% bullish threshold and appears to be flattening in anticipation of a bottom. 100% of Energy stocks have price above their 200-day EMA. Most of these stocks are in strong bull market configurations. Participation of stocks above their 20/50-day EMAs is improving.
Industry Group to Watch: US Oil Equipment & Services ($DJUSOI)
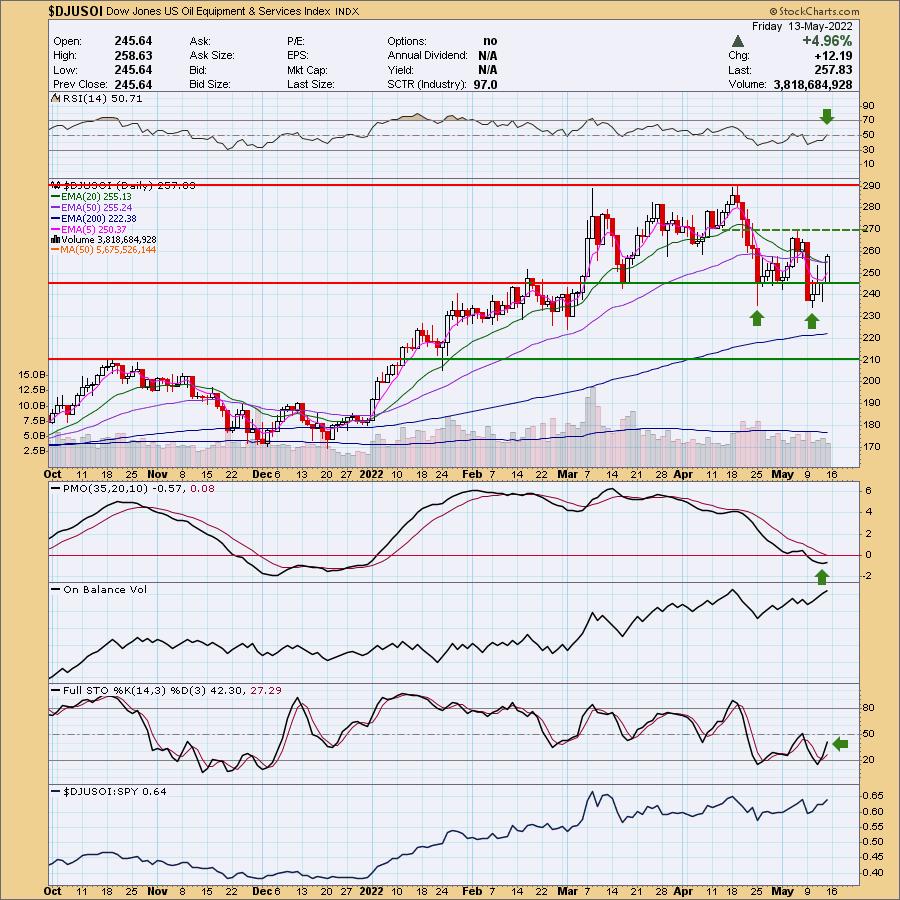
Honestly, I like all of the industry groups with the exception of Pipelines and Coal. Gas and Oil related stocks should do well next week. The RSI just entered positive territory. The 20-day EMA avoided a "Dark Cross" of the 50-day EMA. There is a bullish double-bottom pattern that implies a breakout above the confirmation line at $270. The upside target of the pattern would be around $305 which is well-above overhead resistance.
Go to our Sector ChartList on DecisionPoint.com to get an in-depth view of all the sectors.
Good Luck & Good Trading!
- Erin
erin@decisionpoint.com
Full Disclosure: I'm 25% exposed to the market with 15% on the short side.
Watch the latest episode of DecisionPoint with Carl & Erin Swenlin on Mondays 7:00p EST or on the DecisionPoint playlist on the StockCharts TV YouTube channel here!
Technical Analysis is a windsock, not a crystal ball. --Carl Swenlin
NOTE: The stocks reported herein are from mechanical trading model scans that are based upon moving average relationships, momentum and volume. DecisionPoint analysis is then applied to get five selections from the scans. The selections given should prompt readers to do a chart review using their own analysis process. This letter is not a call for a specific action to buy, sell or short any of the stocks provided. There are NO sure things or guaranteed returns on the daily selection of "diamonds in the rough."
Helpful DecisionPoint Links:
DecisionPoint Shared ChartList and DecisionPoint Chart Gallery
Price Momentum Oscillator (PMO)
Swenlin Trading Oscillators (STO-B and STO-V)
(c) Copyright 2022 DecisionPoint.com