
Today's scan theme was clearly Biotechs. I had a healthy (no pun intended) selection of stocks to review. After reviewing the results, I actually narrowed it down to three with no trouble. Given this group is so volatile, I decided that I should present large-cap stocks and the Biotech ETF to limit that volatility. We'll see if that strategy works. Two stocks I will not be covering, but look interesting are: BMRN and GMAB. Currently I'm seeing lower prices on Biotechs are down after hours so we should make sure that the bullish characteristics of the "Diamonds in the Rough" stick around.
I apologize for the confusion over today's DP Free Trading Room. I didn't change the date in Zoom to Tuesday so notice went out yesterday instead of today. Remember that the DP Free Trading Room is recurring so the "Join" link will always be the same. You can keep an old email or add it to your calendar. If you're not sure if I'm running it, join anyway.
There was no DecisionPoint Show yesterday so there were no symbols from the show to send.
Good Luck & Good Trading!
Erin
Today's "Diamonds in the Rough": BIIB, IONS and XBI.

RECORDING LINK (6/17/2022):
Topic: DecisionPoint Diamond Mine (6/17/2022) LIVE Trading Room
Start Time: Jun 17, 2022 09:00 AM
Meeting Recording Link
Access Passcode: June#17th
REGISTRATION FOR Friday 6/24 Diamond Mine:
When: Jun 24, 2022 09:00 AM Pacific Time (US and Canada)
Topic: DecisionPoint Diamond Mine (6/24/2022) LIVE Trading Room
Register in advance for this webinar HERE.
Save the registration confirmation email with login instructions in case Zoom doesn't notify you in time.

Free DP Trading Room (6/21/2022) RECORDING LINK:
Topic: DecisionPoint Trading Room
Start Time: Jun 21, 2022 09:00 AM
Meeting Recording Link
Access Passcode: June@21st
For best results, copy and paste the access code to avoid typos.
Welcome to DecisionPoint Daily Diamonds, wherein I highlight ten "Diamonds in the Rough" per week. These are selected from the results of my DecisionPoint Scans, which search for stocks that could benefit from the trend and condition of the market. Remember, these are not recommendations to buy or sell, but are the most interesting of the stocks that surfaced in my scans. My objective is to save you the work of the initial, tedious culling process, but you need to apply your own analysis to see if these stocks pique your interest as well. There are no guaranteed winners here!
"Predefined Scans Triggered" are taken from StockCharts.com using the "Symbol Summary" option instead of a "SharpChart" on the workbench.
Biogen Inc. (BIIB)
EARNINGS: 7/26/2022 (BMO)
Biogen, Inc. is a biopharmaceutical company, which engages in discovering, developing, and delivering therapies for neurological and neurodegenerative diseases. It offers TECFIDERA, VUMERITY, AVONEX, PLEGRIDY, TYSABRI, and FAMPYRA for the treatment of multiple sclerosis, SPINRAZA for the treatment of spinal muscular atrophy, and FUMADERM for the treatment of severe plaque psoriasis. The company was founded by Charles Weissmann, Heinz Schaller, Kenneth Murray, Walter Gilbert, and Phillip Allen Sharp in 1978 and is headquartered in Cambridge, MA.
Predefined Scans Triggered: New CCI Buy Signals, Bullish MACD Crossovers, Moved Above Ichimoku Cloud, Parabolic SAR Buy Signals and P&F Double Top Breakout.
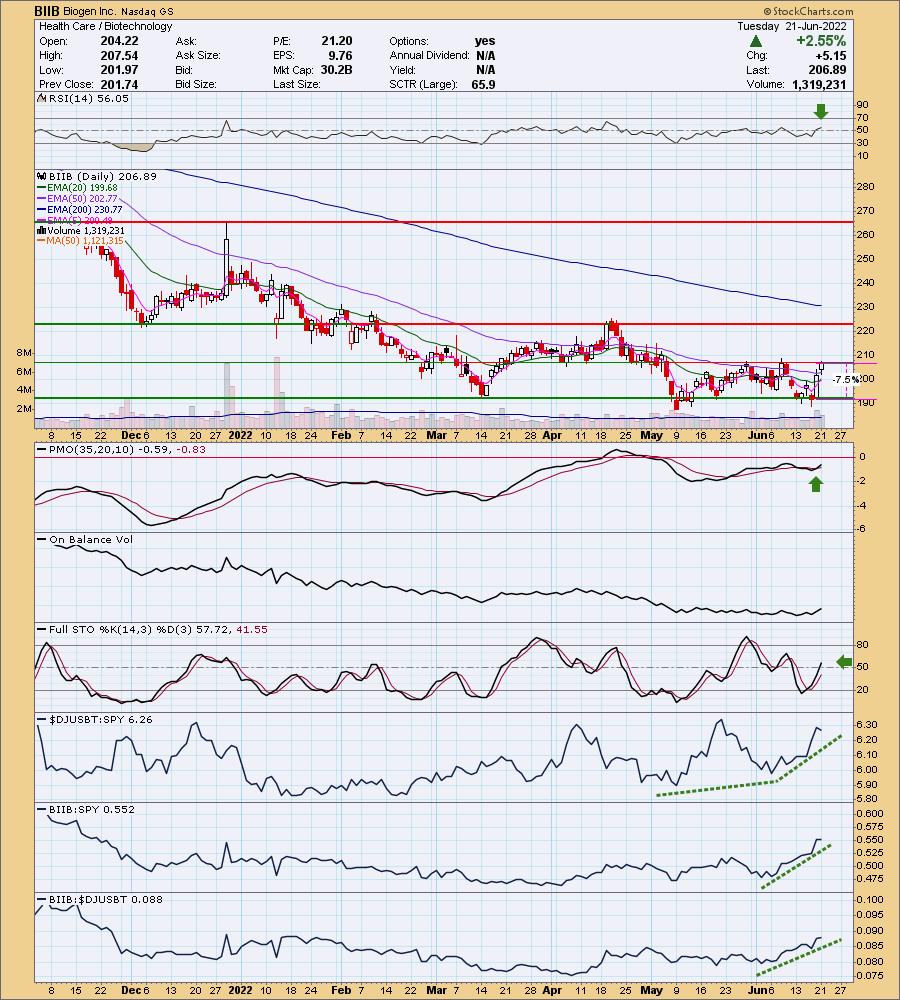
BIIB is down -0.19%. I've covered BIIB three times prior in 2020. All of those positions were stopped out. Here is the link to each of the reports: March 3rd 2020, April 14th 2020, and May 11th 2020. Currently BIIB is in a short-term trading channel and has hit the top. This does make it somewhat risky as it could decide to stay in the range and test the bottom from here on out. However, the indicators suggest and upcoming breakout. The RSI is now in positive territory. The PMO had a crossover BUY signal and Stochastics are now rising in positive territory. Relative performance of the group has greatly improved and BIIB is one of the leadership stocks based on its outperformance of the group and the SPY. Today the 5-day EMA crossed above the 20-day EMA for a ST Trend Model BUY signal. The stop is set at the bottom of the trading range.
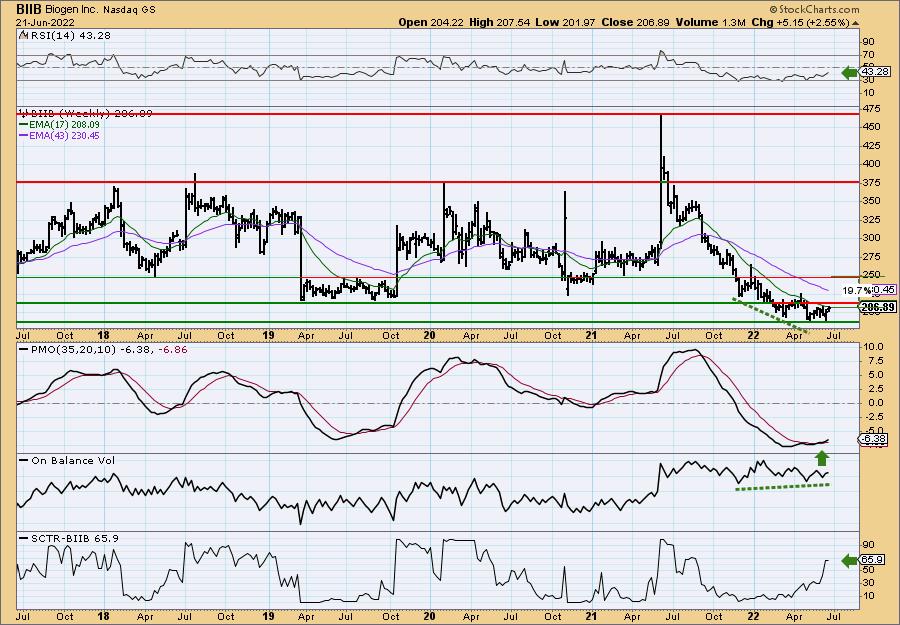
The weekly chart looks very good. The weekly RSI is rising, but still negative. The weekly PMO has been bottoming even as price has consolidated or trended lower. There is a strong positive OBV divergence. The SCTR isn't great, but it isn't terrible either. One of my scans requires a SCTR between 60 and 80 because they offer room for improvement. Price is on current short-term lows. If we do see the bottom here, my upside target would be around the early 2021 low.
Ionis Pharmaceuticals, Inc. (IONS)
EARNINGS: 8/3/2022 (BMO)
Ionis Pharmaceuticals, Inc. engages in the development and commercialization of human therapeutic drugs using antisense technology. It operates through the Ionis Core and Akcea Therapeutics segments. The Ionis Core segment exploits a novel drug discovery platform to generate a pipeline of drugs. The Akcea Therapeutics segment develops and commercializes drugs for cardiometabolic diseases. The company was founded by Stanley T. Crooke, David J. Ecker, Christopher K. Mirabelli, and Brett P. Monia in 1989 and is headquartered in Carlsbad, CA.
Predefined Scans Triggered: Stocks in a New Downtrend (Aroon), Bullish MACD Crossovers and Entered Ichimoku Cloud.
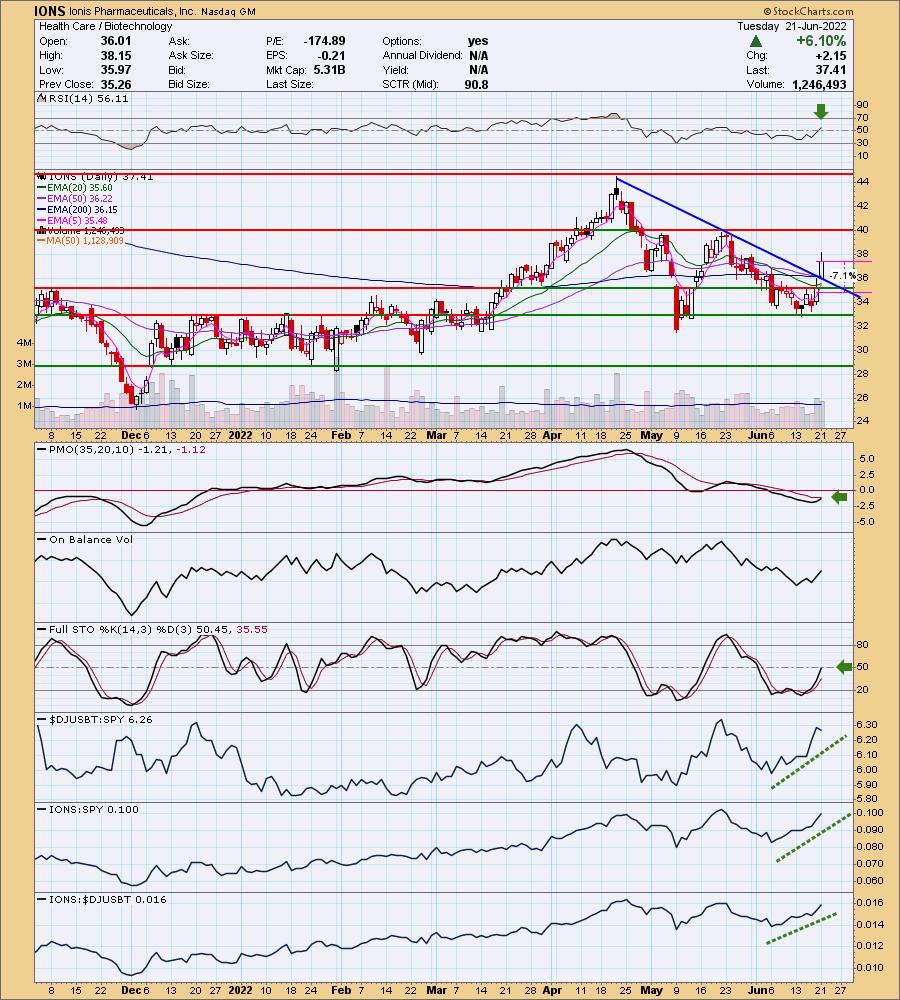
IONS is down -3.50% in after hours trading as it digests today's an over 6% move. If this one reenters its declining trend, I would leave it alone. However, the indicators suggest we will see follow-through on the breakout. The RSI is positive and rising. The PMO is about to trigger a crossover BUY signal. The 5-day EMA is nearing a positive crossover the 20-day EMA. Stochastics are rising and volume is coming in. Relative strength is improving. The stop is set below the November high.
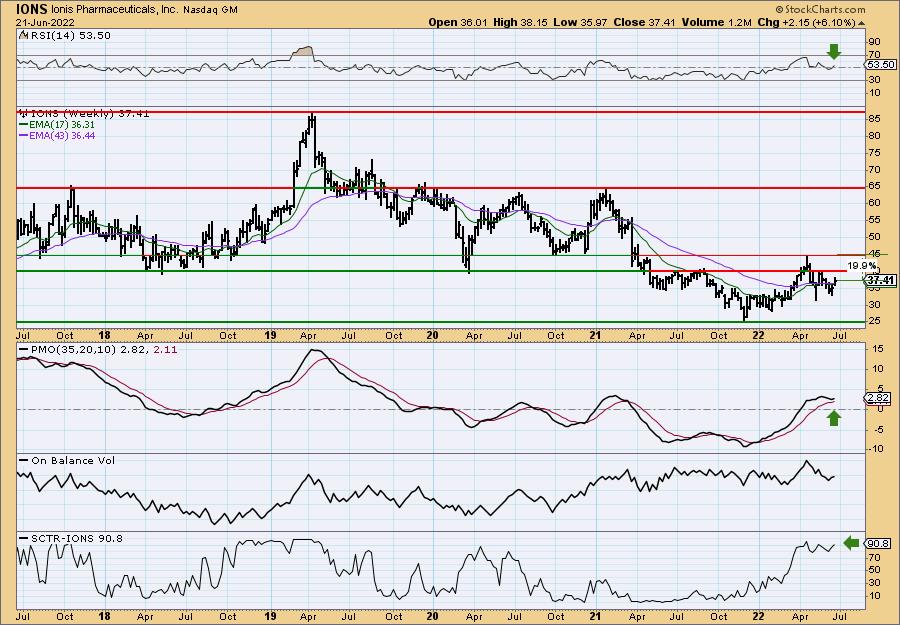
The weekly chart is definitely improving and we see that the SCTR is much higher than BIIB. The weekly RSI has reversed back into positive territory. The PMO is bottoming above the signal line which is especially bullish if it can hold onto it. Overhead resistance is tough. If it can get past the 2020 low, it shouldn't have a problem reaching the upside target of $45.
SPDR S&P Biotech ETF (XBI)
EARNINGS: N/A
XBI tracks an equal-weighted index of US biotechnology stocks.
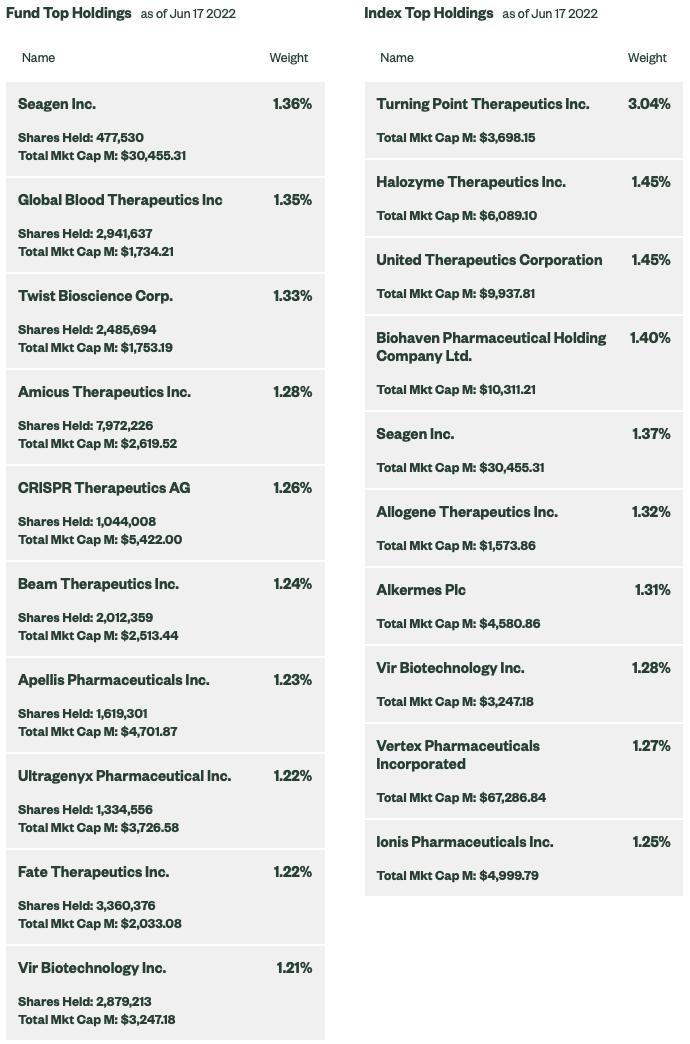
Predefined Scans Triggered: P&F High Pole.
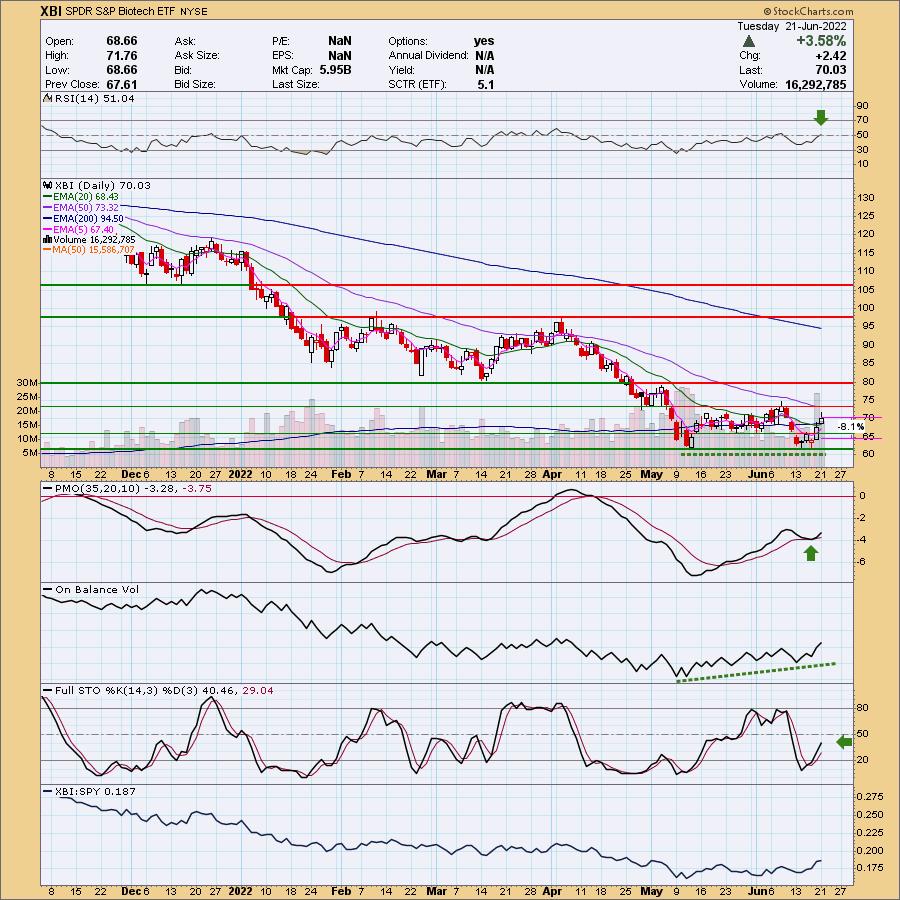
XBI is down -0.04% in after hours trading. Like BIIB, XBI is in a trading range and is coming up against resistance. I am looking for a breakout. The RSI just moved into positive territory. The PMO has bottomed above the signal line. There is a positive OBV divergence leading into the current rally. Stochastics reversed sharply and are rising quickly. XBI is beginning to show some outperformance against the SPY. I set the stop beneath the end of May lows.
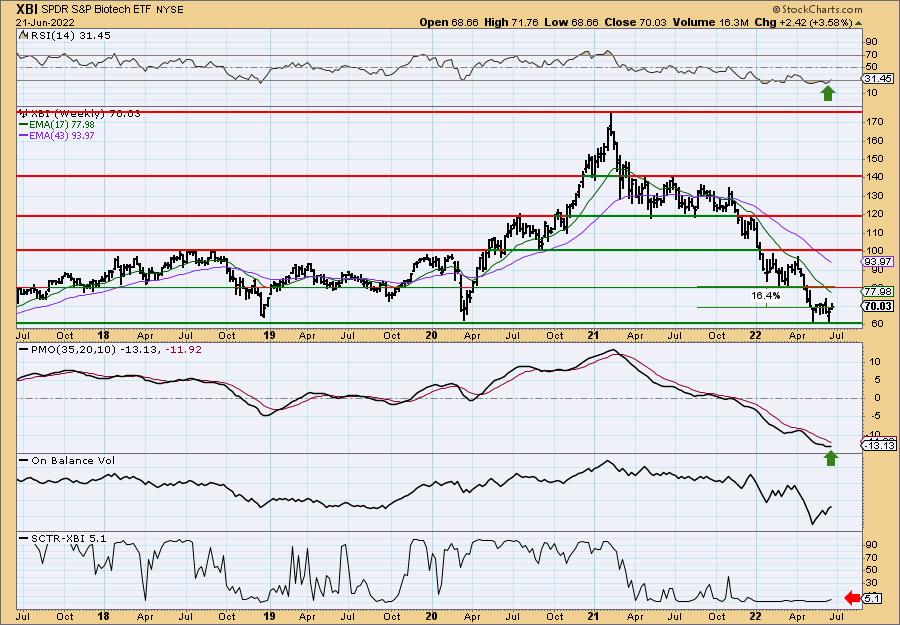
XBI is sitting on multi-year support. The weekly RSI is beginning to move higher out of oversold territory. The weekly PMO is beginning to turn back up. One thing I really don't like is the low 5.1 SCTR. This is a beat down ETF and while it is on support, we did see a prior failed rally. I am being cautious on upside potential. The upside target is at overhead resistance at early 2022 lows with other "touches" at that level in the past. It could certainly move past that level, but let's be cautious for now.
Don't forget, on Thursdays I look at reader-requested symbols, click HERE to send me an email. I read every email I receive and try to answer them all!
Current Market Outlook:
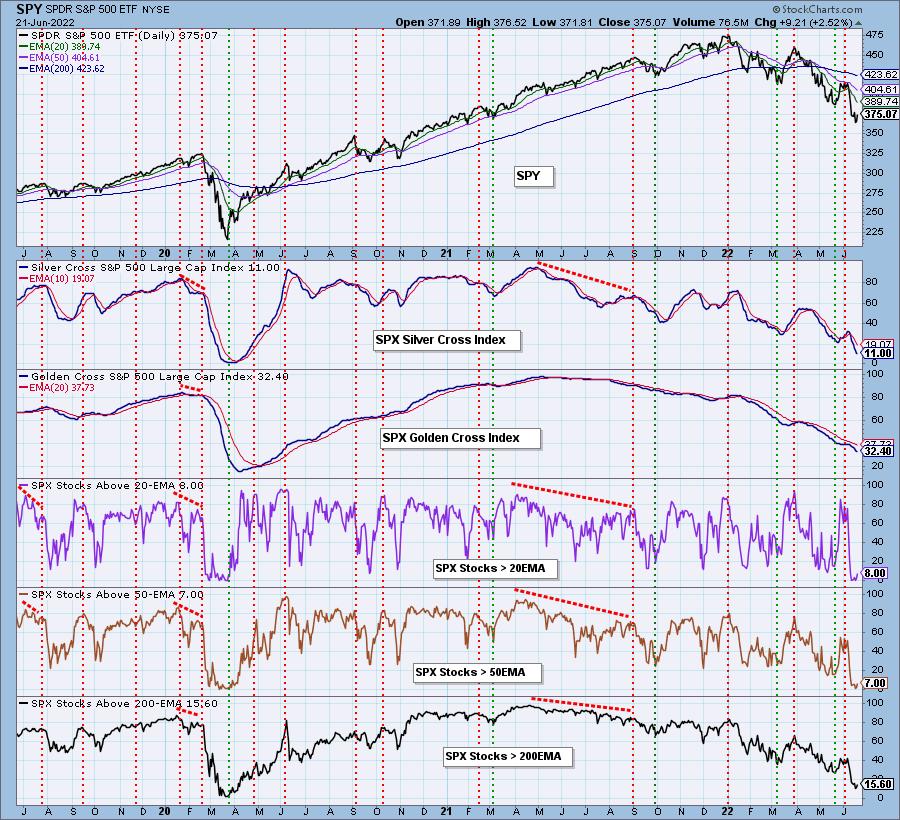
Market Environment: It is important to consider the odds for success by assessing the market tides. The following chart uses different methodologies for objectively showing the depth and trend of participation for intermediate- and long-term time frames.
- The Silver Cross Index (SCI) shows the percentage of SPX stocks on IT Trend Model BUY signals (20-EMA > 50-EMA)
- The Golden Cross Index (GCI) shows the percentage of SPX stocks on LT Trend Model BUY signals (50-EMA > 200-EMA)
Don't forget that as a "Diamonds" member, you have access to our GCI/SCI curated ChartList on DecisionPoint.com. You'll find it under "Members Only" links on the left side on the Blogs and Links Page.
Here is the current chart:
Full Disclosure: I'm 20% exposed with 10% hedge. With trading turning around today I am not adding inverse positions. I am not planning on increasing exposure at this time.
I'm required to disclose if I currently own a stock I mention and/or may buy/short it within the next 72 hours.
"Technical Analysis is a windsock, not a crystal ball." - Carl Swenlin
(c) Copyright 2022 DecisionPoint.com
Watch the latest episode of DecisionPoint with Carl & Erin Swenlin on Mondays 7:00p EST or on the DecisionPoint playlist on the StockCharts TV YouTube channel here!
NOTE: The stocks reported herein are from mechanical trading model scans that are based upon moving average relationships, momentum and volume. DecisionPoint analysis is then applied to get five selections from the scans. The selections given should prompt readers to do a chart review using their own analysis process. This letter is not a call for a specific action to buy, sell or short any of the stocks provided. There are NO sure things or guaranteed returns on the daily selection of "Diamonds in the Rough."
Helpful DecisionPoint Links:
DecisionPoint Shared ChartList and DecisionPoint Chart Gallery
Price Momentum Oscillator (PMO)
Swenlin Trading Oscillators (STO-B and STO-V)
For more links, go to DecisionPoint.com