
There weren't any particular themes today. The scans were rather 'dry'. I did pull out a scan I call "Carl's Scan". A couple of years ago when I started Diamonds, I wanted to have a scan that took into account what Dad thought was most important. His scan is all about the PMO and EMAs while I have added other indicators to my scans and thresholds, etc. I pulled one of today's symbols from that scan, Avnet (AVT).
Two of the symbols today come from the Health Care Providers industry group which was our "industry group to watch" on Friday.
I made two slight adjustments to the weekly charts. I've added "Events" which will show us when and how much dividends were paid, as well as any splits. I've also added a horizontal red line on the SCTR window. I consider SCTR ranks above 70 to be bullish so it makes it easier to see.
Mom is recovering from surgery yesterday. It was a tough afternoon and night for her, but I visited her today and her pain level was much better. She even ate and walked a bit. There are still some issues that need to be cleared up, but it appears everything is going in the right direction.
Good Luck & Good Trading!
Erin
Today's "Diamonds in the Rough": AMED, AVT, ESI and MOH.
Runners-Up: CXW, ASTE, BHE and ABC.

RECORDING LINK (7/8/2022):
Topic: DecisionPoint Diamond Mine (7/8/2022) LIVE Trading Room
Start Time: Jul 8, 2022 08:57 AM
Meeting Recording Link
Access Passcode: July#8th
REGISTRATION FOR Friday 7/15 Diamond Mine:
When: Jul 15, 2022 09:00 AM Pacific Time (US and Canada)
Topic: DecisionPoint Diamond Mine (7/15/2022) LIVE Trading Room
Register in advance for this webinar HERE
Save the registration confirmation email with login instructions in case Zoom doesn't notify you in time.

StockChartsTV is now producing the recording for the free DP Trading Room! It airs at 3p ET, much sooner than I was able to get out the recording links. Carl has joined so you can "ask the master" all those questions you've always wanted his opinion on! If you haven't registered to attend live at Noon ET, you can do so HERE.
Welcome to DecisionPoint Daily Diamonds, wherein I highlight ten "Diamonds in the Rough" per week. These are selected from the results of my DecisionPoint Scans, which search for stocks that could benefit from the trend and condition of the market. Remember, these are not recommendations to buy or sell, but are the most interesting of the stocks that surfaced in my scans. My objective is to save you the work of the initial, tedious culling process, but you need to apply your own analysis to see if these stocks pique your interest as well. There are no guaranteed winners here!
"Predefined Scans Triggered" are taken from StockCharts.com using the "Symbol Summary" option instead of a "SharpChart" on the workbench.
Amedisys (AMED)
EARNINGS: 7/27/2022 (AMC)
Amedisys, Inc. engages in the provision of healthcare services. It operates through the following business segments: Home Health, Hospice, and Personal Care. The Home Health segment delivers services in the homes of individuals who may be recovering from an illness, injury, or surgery. The Hospice segment provides care that is designed to provide comfort and support for those who are facing a terminal illness. The Personal Care segment gives patients assistance with the essential activities of daily living. The company was founded by William F. Borne in 1982 and is headquartered in Baton Rouge, LA.
Predefined Scans Triggered: Stocks in a New Uptrend (Aroon) and P&F Double Top Breakout.
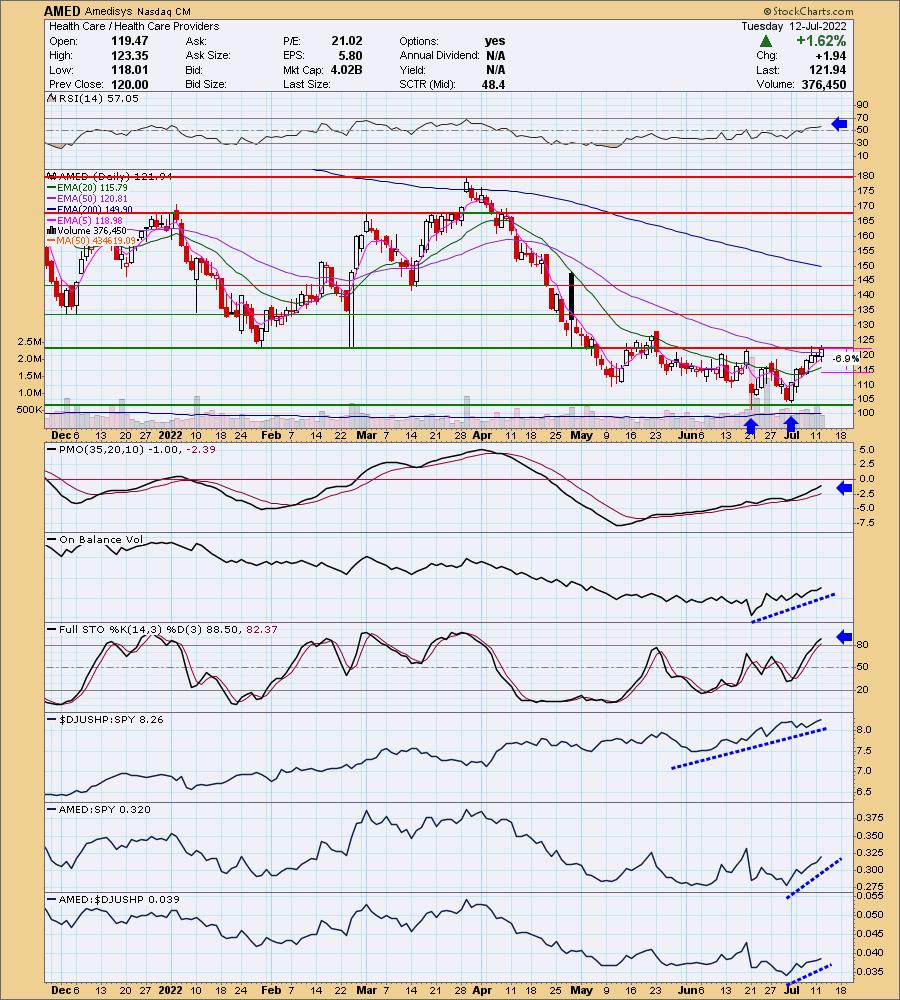
AMED is unchanged in after hours trading. I've covered it twice before on April 14th 2020 and December 9th 2021. Both positions are closed. My only issue with this chart is that overhead resistance (and the confirmation line of the double-bottom pattern) is holding. Still, today it closed above the 50-day EMA for the first time since April. Personally, I'd like to wait for the breakout, but the chart is very favorable if you wanted to enter earlier. The RSI is positive, the PMO is rising and Stochastics are still rising above 80. Volume is coming in based on the OBV. Relative strength is excellent across the board for the stock and the group. I set the stop below the 20-day EMA.
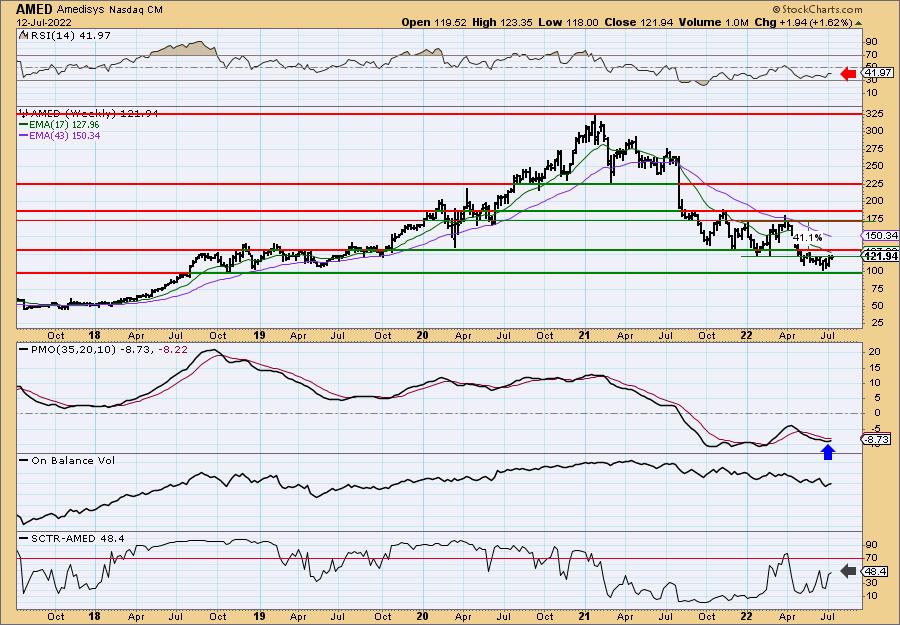
Price is bouncing off long-term support at $100. While the weekly RSI is still negative and floundering, the weekly PMO has turned up in oversold territory. The SCTR is only so-so given it is below 50%.
Avnet, Inc. (AVT)
EARNINGS: 8/10/2022 (AMC)
Avnet, Inc. engages in the distribution and sale of electronic components. It operates through the Electronic Components and Farnell segments. The Electronic Components segment markets and sells semiconductors, interconnect, passive and electromechanical devices, and integrated components. The Farnell segment is involved in the distribution of electronic components and related products to the electronic system design community utilizing multi-channel sales and marketing resources. The company was founded by Charles Avnet in 1921 and is headquartered in Phoenix, AZ.
Predefined Scans Triggered: Parabolic SAR Buy Signals.
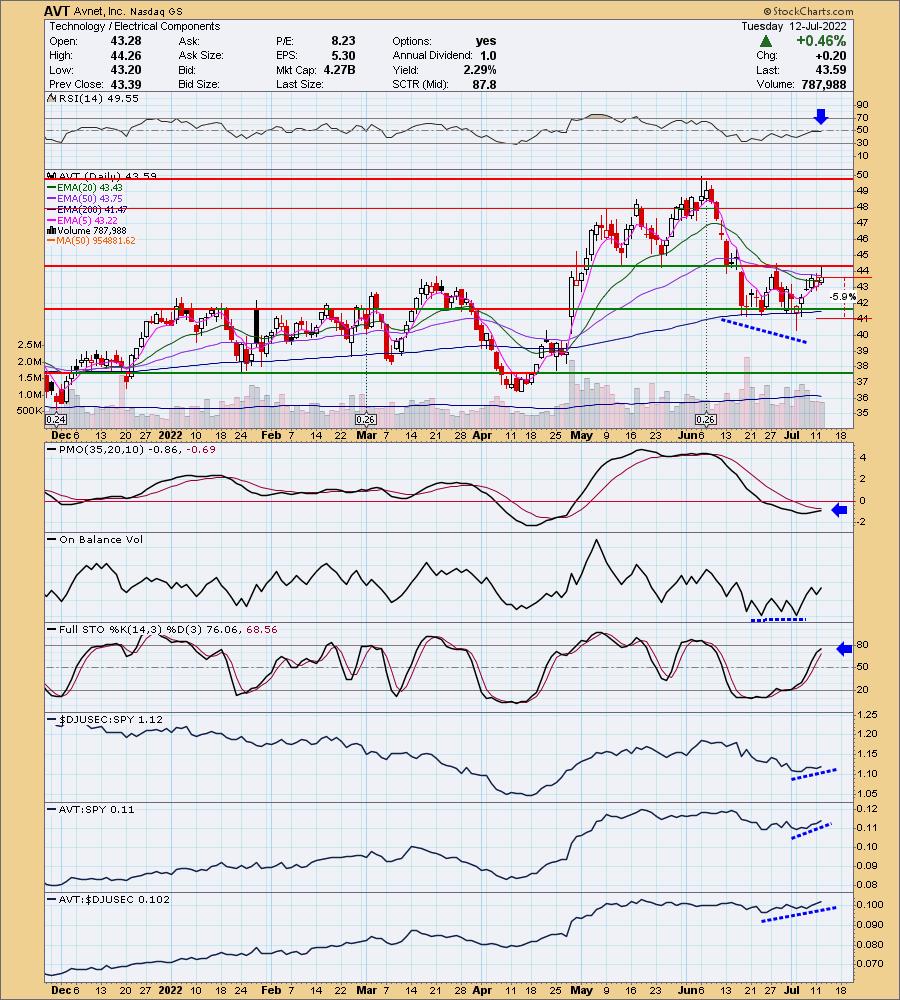
AVT is unchanged in after hours trading. This came from "Carl's Scan". This is another that hasn't actually broken above overhead resistance, but the chart is really telling us it will. A double-bottom has formed, albeit messy. The RSI is just about to reach above 50. The PMO is rising toward a crossover BUY signal. There is an OBV positive divergence. Stochastics are rising and should get above 80 soon. Relative strength is improving across the board. The stop can be set tightly at 6% below the 200-day EMA.
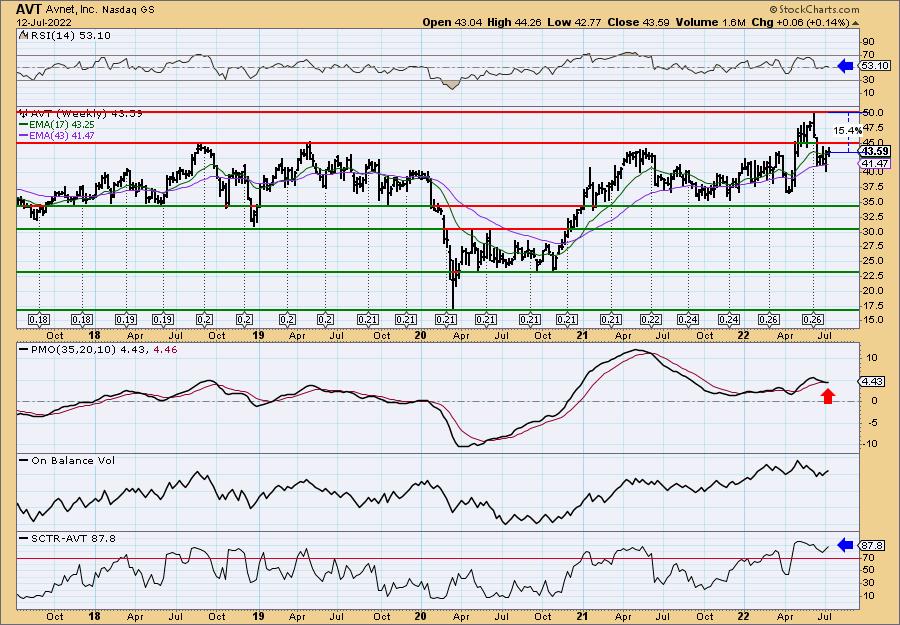
The weekly chart is mixed. The weekly PMO is setting up a negative crossover. It won't "go final" until after the close on Friday, so it can still pull it out. The weekly RSI is positive and the SCTR is healthy.
Element Solutions Inc. (ESI)
EARNINGS: 7/27/2022 (AMC)
Element Solutions, Inc. engages in the formulation of chemical solutions that enhance the performance of products people use every day. It operates through the following segments: Electronics and Industrial & Specialty. The Electronics segment focuses on the research and formulation of specialty chemicals and materials for all types of electronics hardware, from complex printed circuit board designs to new interconnection materials. The Industrial & Specialty segment comprises industrial solutions, graphic solutions, and energy solutions. The company was founded by Sir Martin E. Franklin on April 23, 2013, and is headquartered in Fort Lauderdale, FL.
Predefined Scans Triggered: Bullish MACD Crossovers, P&F Triple Bottom Breakdown and P&F Double Bottom Breakout.
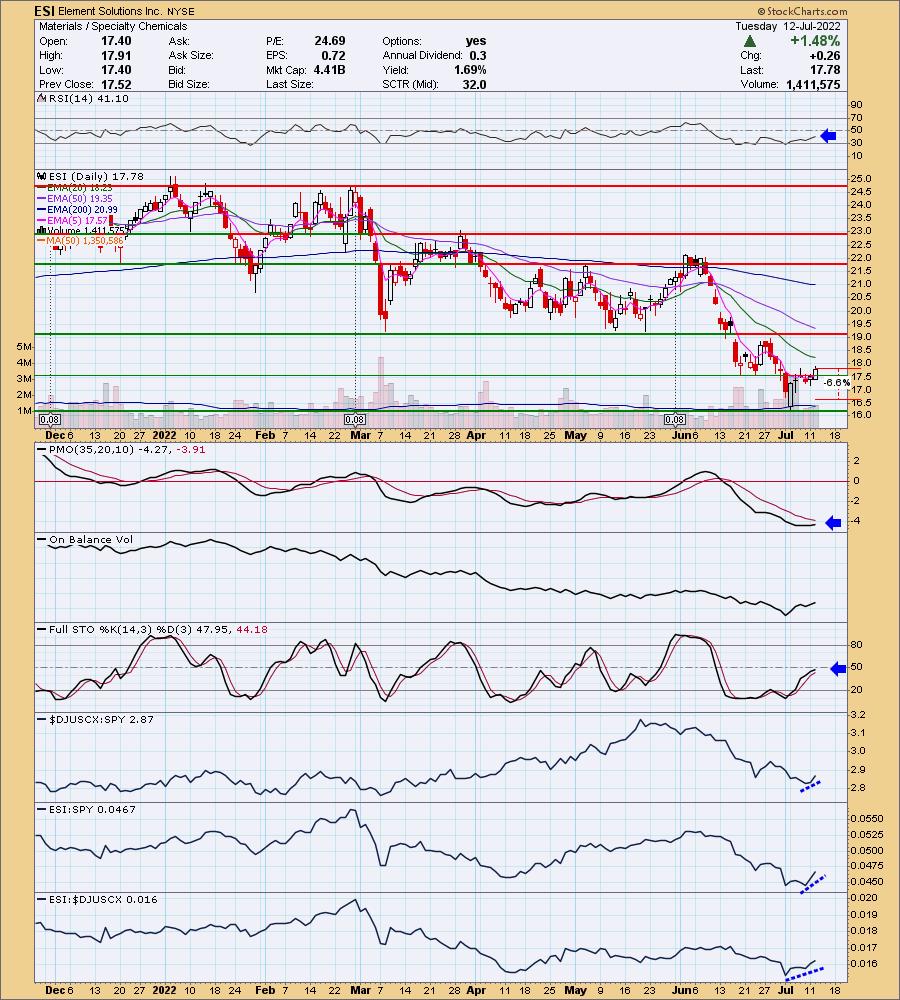
ESI is up +0.39% in after hours trading. I hesitated to include this one as it is a "reversal" play on a beat down stock. I decided to include it due to today's breakout above very short-term overhead resistance at the mid-June low. The RSI is negative, but rising. The PMO has begun to rise. The OBV is rising with price. Stochastics are negative and decelerating somewhat, but they are still rising overall.
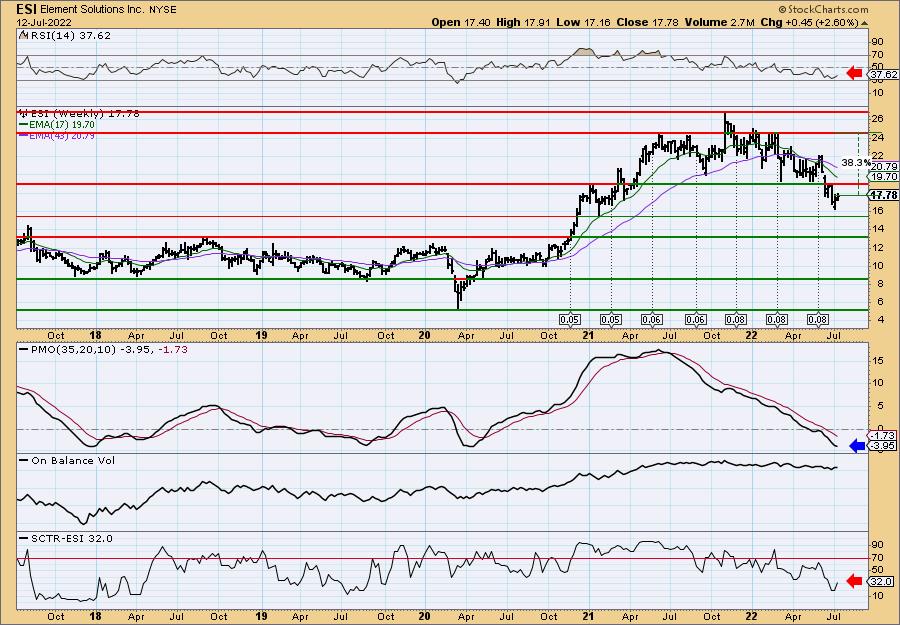
The weekly chart is nothing to look at. Consider this a short-term investment. There is a large rounded top. On the plus side, price did begin rising off support at $16. However, the weekly RSI is negative and the weekly PMO is on a SELL signal. The weekly PMO does appear to be flattening already, but we can see plenty of times over the past year where the weekly PMO paused or began to turn up and price failed. If it can get above overhead resistance, upside potential is about 38%. I'd be happy with a gain to $22 though.
Molina Healthcare, Inc. (MOH)
EARNINGS: 7/27/2022 (AMC)
Molina Healthcare, Inc. engages in the provision of health care services. It operates through the Health Plans and Other segments. The Health Plans segment consists of health plans in 11 states and the Commonwealth of Puerto Rico and includes direct delivery business. The Other segment includes the historical results of the MMIS and behavioral health subsidiaries. The company was founded by C. David Molina in 1980 and is headquartered in Long Beach, CA.
Predefined Scans Triggered: Stocks in a New Uptrend (Aroon) and P&F Double Top Breakout.
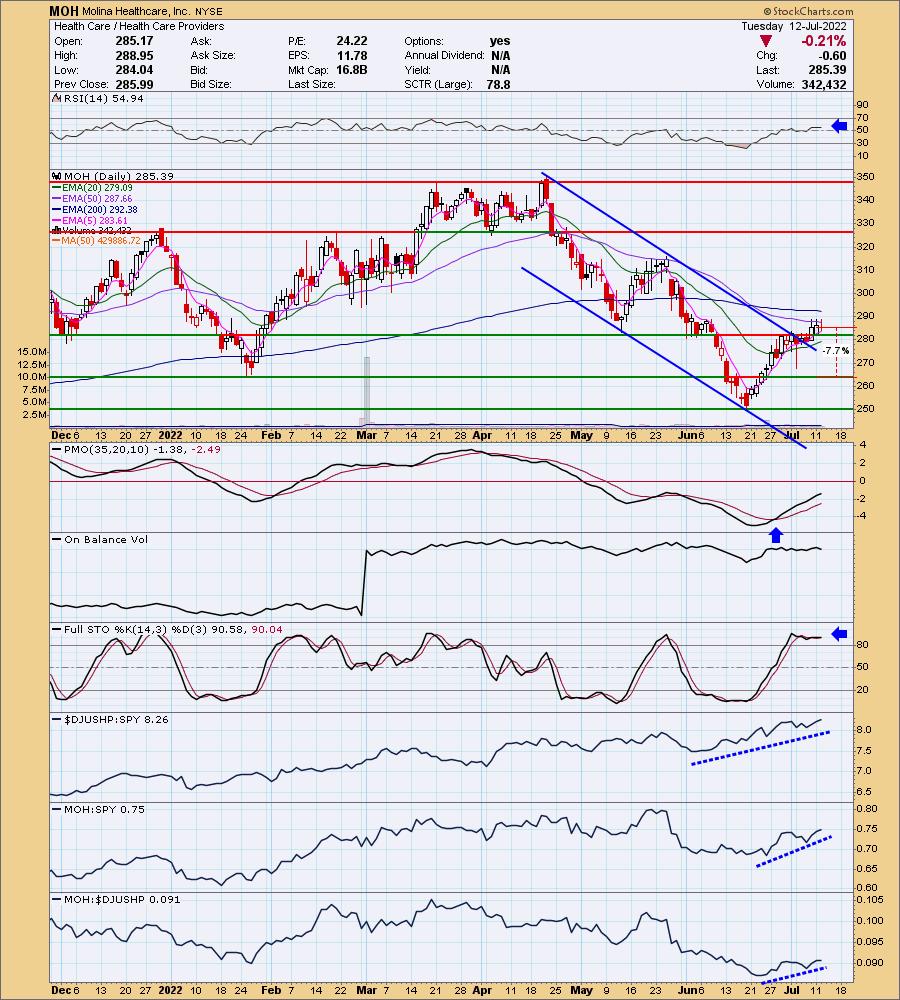
MOH is up +0.14% in after hours trading. I covered it on December 14th 2021. The position is closed as the January decline took out the stop level. I like this week's breakout. MOH has broken out of a declining trend channel. Price is struggling at the 50-day EMA, but the indicators look very healthy (no pun intended). The RSI is positive and the PMO is rising on a crossover BUY signal. The OBV is a little suspect given its flat tops, but with Stochastics firmly above 80 and relative strength building, I expect this one to do well. The stop is set at the January low.
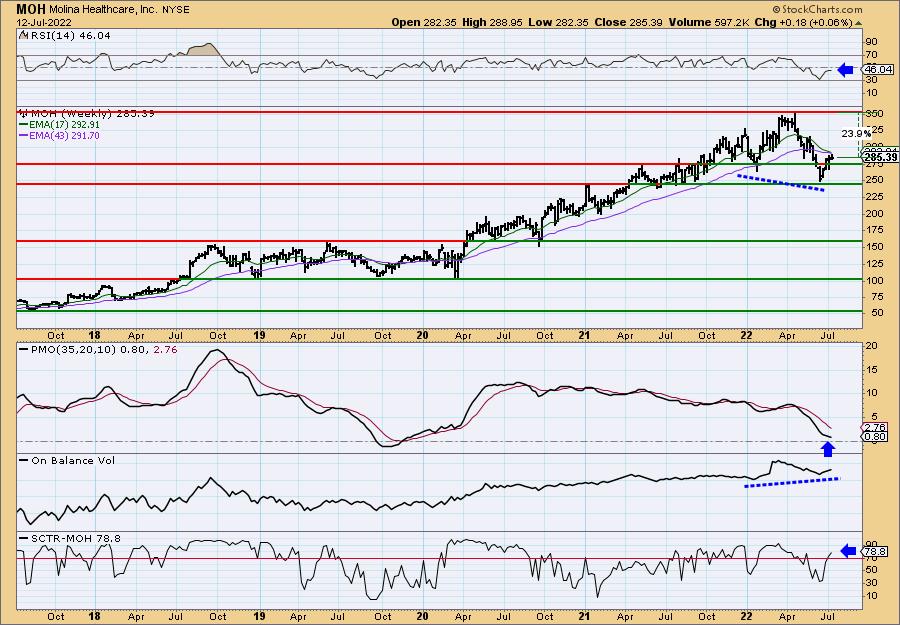
The weekly RSI is flat and negative and the weekly PMO is still declining. I really like the positive OBV divergence going into this rally. The SCTR is very good at 78.8%.
Don't forget, on Thursdays I look at reader-requested symbols, click HERE to send me an email. I read every email I receive and try to answer them all!
Current Market Outlook:
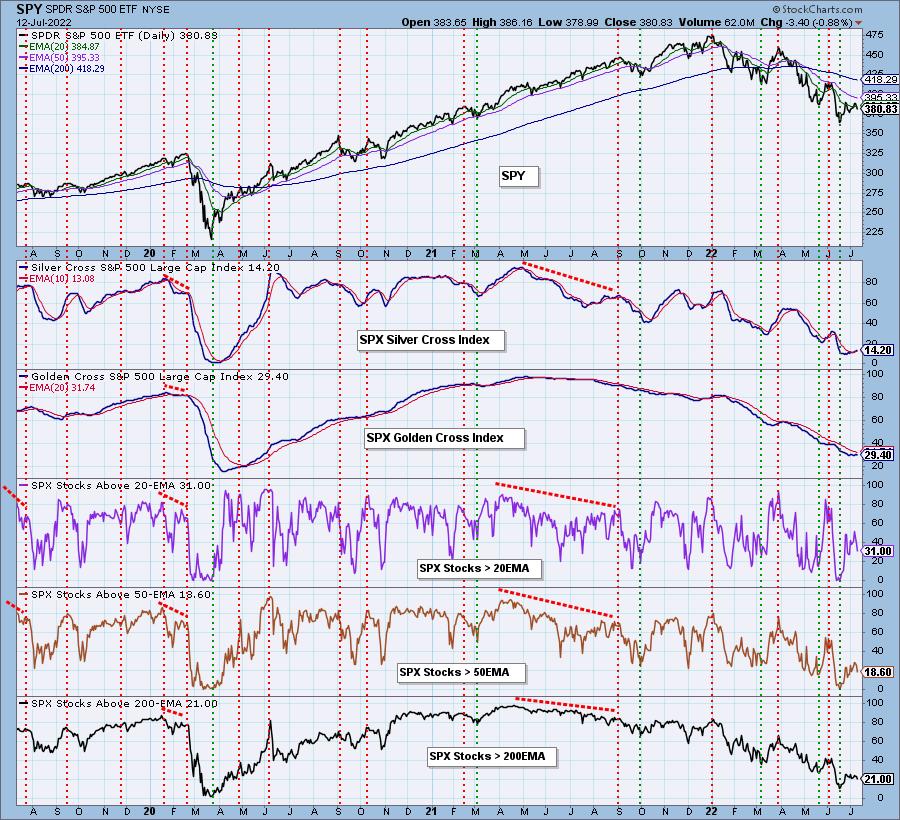
Market Environment: It is important to consider the odds for success by assessing the market tides. The following chart uses different methodologies for objectively showing the depth and trend of participation for intermediate- and long-term time frames.
- The Silver Cross Index (SCI) shows the percentage of SPX stocks on IT Trend Model BUY signals (20-EMA > 50-EMA)
- The Golden Cross Index (GCI) shows the percentage of SPX stocks on LT Trend Model BUY signals (50-EMA > 200-EMA)
Don't forget that as a "Diamonds" member, you have access to our GCI/SCI curated ChartList on DecisionPoint.com. You'll find it under "Members Only" links on the left side on the Blogs and Links Page.
Here is the current chart:
Full Disclosure: I'm 45% exposed.
I'm required to disclose if I currently own a stock I mention and/or may buy/short it within the next 72 hours.
"Technical Analysis is a windsock, not a crystal ball." - Carl Swenlin
(c) Copyright 2022 DecisionPoint.com
Watch the latest episode of DecisionPoint with Carl & Erin Swenlin on Mondays 7:00p EST or on the DecisionPoint playlist on the StockCharts TV YouTube channel here!
NOTE: The stocks reported herein are from mechanical trading model scans that are based upon moving average relationships, momentum and volume. DecisionPoint analysis is then applied to get five selections from the scans. The selections given should prompt readers to do a chart review using their own analysis process. This letter is not a call for a specific action to buy, sell or short any of the stocks provided. There are NO sure things or guaranteed returns on the daily selection of "Diamonds in the Rough."
Helpful DecisionPoint Links:
DecisionPoint Shared ChartList and DecisionPoint Chart Gallery
Price Momentum Oscillator (PMO)
Swenlin Trading Oscillators (STO-B and STO-V)
For more links, go to DecisionPoint.com