
The scan results were pretty thin today, but I did have one appear from the industry groups we talked about in last Friday's Diamond Mine trading room and yesterday's free DecisionPoint Trading Room. I had to go out on my own to find the last two symbols. It shouldn't surprise you that I do not have "runner-up" stocks today.
I wanted to find a symbol in Renewable Energy and Gold Miners. Honestly, TPI Composites (TPIC) that I presented last week is still my favorite Solar stock (I'm in PLUG, but like TPIC better right now), but I found Sunworks (SUNW) which has a very nice chart. I went with a standard in the Gold Miners group, Barrick Gold (GOLD) as its relative performance to the group was outstanding.
I had also gotten bullish on Biotechs again so when Vertex Pharma (VRTX) appeared in my Diamond PMO Scan, I grabbed it to present.
I am expanding my exposure by adding GOLD to my portfolio tomorrow. Remember, just because I've added it, it doesn't mean you should. Be sure that when you purchase a "Diamond in the Rough", you're doing it because it fits your risk profile and analysis process! Also, remember that I only present picks, I don't give sell recommendations.
Good Luck & Good Trading!
Erin
Today's "Diamonds in the Rough": GOLD, SUNW and VRTX.

RECORDING LINK (8/5/2022):
Topic: DecisionPoint Diamond Mine (8/5/2022) LIVE Trading Room
Start Time: Aug 5, 2022 09:00 AM
Meeting Recording Link
Access Passcode: August#5
REGISTRATION FOR Friday 8/12 Diamond Mine:
When: Aug 12, 2022 09:00 AM Pacific Time (US and Canada)
Topic: DecisionPoint Diamond Mine (8/12/2022) LIVE Trading Room
Register in advance for this webinar HERE
Save the registration confirmation email with login instructions in case Zoom doesn't notify you in time.

StockChartsTV is now producing the recording for the free DP Trading Room! It airs at 3p ET, much sooner than I was able to get out the recording links. Carl has joined so you can "ask the master" all those questions you've always wanted his opinion on! If you haven't registered to attend live at Noon ET, you can do so HERE.
Welcome to DecisionPoint Daily Diamonds, wherein I highlight ten "Diamonds in the Rough" per week. These are selected from the results of my DecisionPoint Scans, which search for stocks that could benefit from the trend and condition of the market. Remember, these are not recommendations to buy or sell, but are the most interesting of the stocks that surfaced in my scans. My objective is to save you the work of the initial, tedious culling process, but you need to apply your own analysis to see if these stocks pique your interest as well. There are no guaranteed winners here!
"Predefined Scans Triggered" are taken from StockCharts.com using the "Symbol Summary" option instead of a "SharpChart" on the workbench.
Barrick Gold Corp. (GOLD)
EARNINGS: 8/8/2022 (BMO) ** Reported Yesterday **
Barrick Gold Corp. engages in the production and sale of gold and copper, as well as related activities such as exploration and mine development. It operates through the following segments: Barrick Nevada, Veladero, Pueblo Viejo, Lagunas Norte, Turquoise Ridge, Acacia, and Pascua-Lama. The company was founded by Peter D. Munk in 1983 and is headquartered in Toronto, Canada.
Predefined Scans Triggered: P&F Double Bottom Breakout.
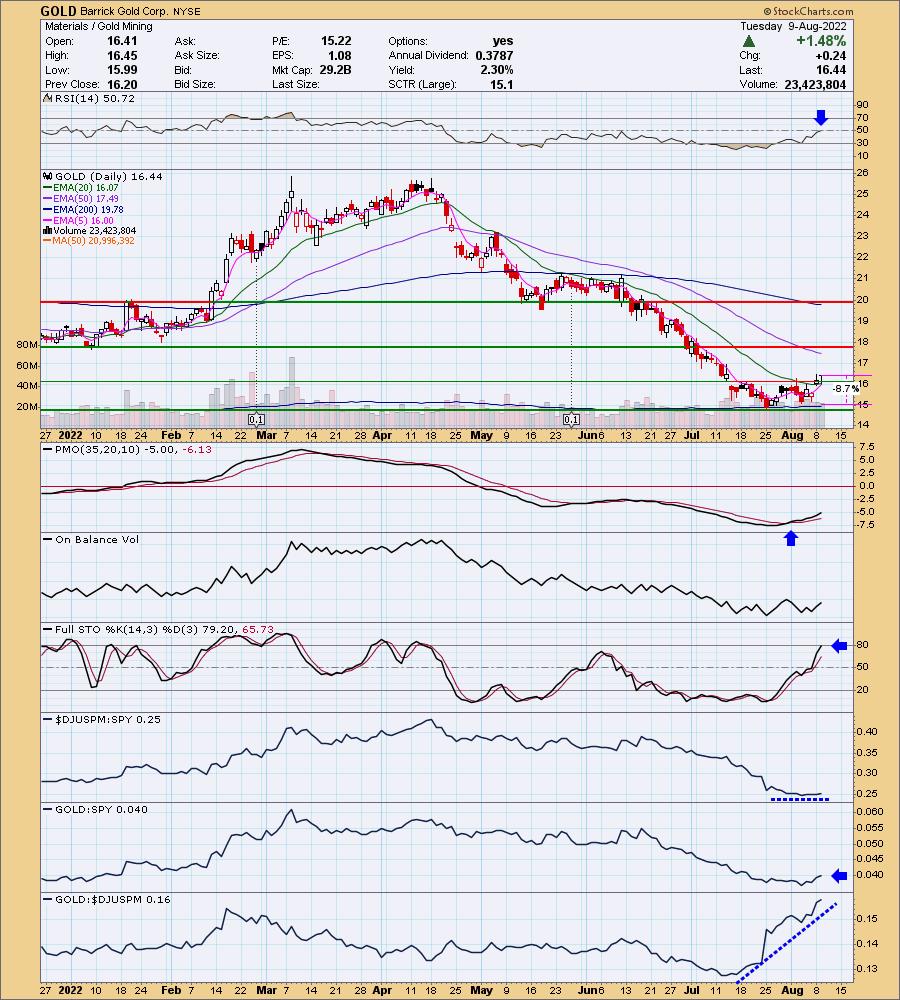
GOLD is down -0.06% in after hours trading. I've covered GOLD twice before, both times in 2020: April 7th 2020 and November 3rd 2020. Both positions eventually hit stops. Carl and I noticed that the Gold Miners industry group chart was showing a lot of potential yesterday. I sent out notice to all of you that this was an interesting group to consider. Many of these stocks have been beat down and offer incredible upside potential.
We have a small bullish double-bottom in the very short term. Price closed above the confirmation line of the pattern today. It also managed to get above the 20-day EMA. The RSI just moved into positive territory and the PMO is rising nicely out of oversold territory. Stochastics should be above 80 tomorrow. Relative strength isn't apparent for the group, but given GOLD's outstanding performance against the group, it is managing to outperform the market already. I'd like to set the stop below support at the July low, but that is just too deep. I'm planning on setting the stop around 8.7% or $15.01.
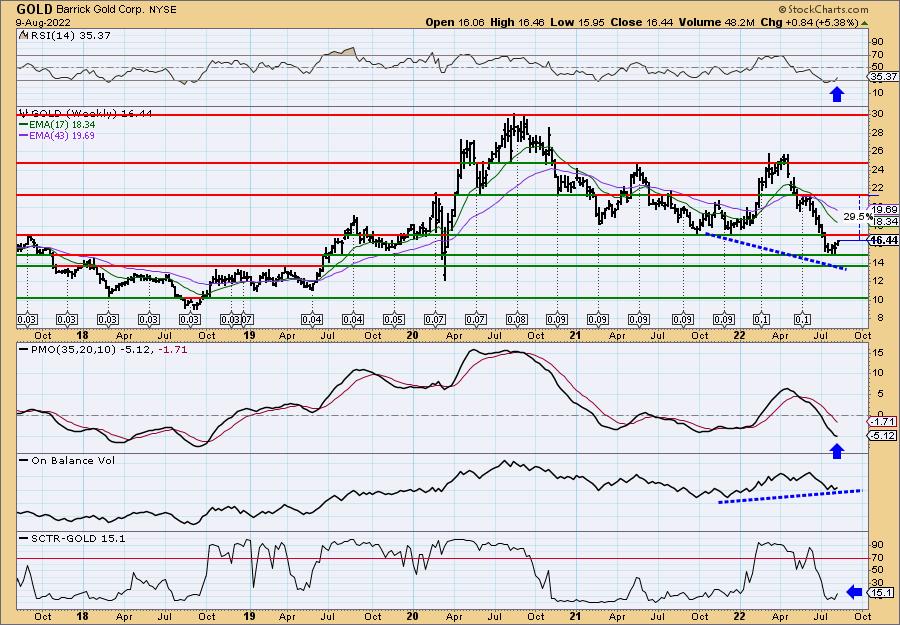
This reversal is coming off a support zone between $13 and $15. The RSI is negative, but rising. The weekly PMO is decelerating in response to the recent rally. There is a strong positive OBV divergence. The only hiccup I see would be resistance at $17. Upside potential is about 30% if that level can be overcome.
Sunworks, Inc. (SUNW)
EARNINGS: 8/9/2022 (BMO)
Sunworks, Inc. engages in the provision of photovoltaic and battery based power and storage systems for the residential and commercial markets. It operates through the Solcius and Sunworks business segments. The Solcius segment focuses on residential projects. The Sunworks segment deals with commercial projects including commercial, agricultural, industrial, and public works projects. The company was founded by Roland F. Bryan, Mark P. Harris, and Christopher T. Kleveland in 1983 and is headquartered in Provo, UT.
Predefined Scans Triggered: P&F Double Top Breakout.
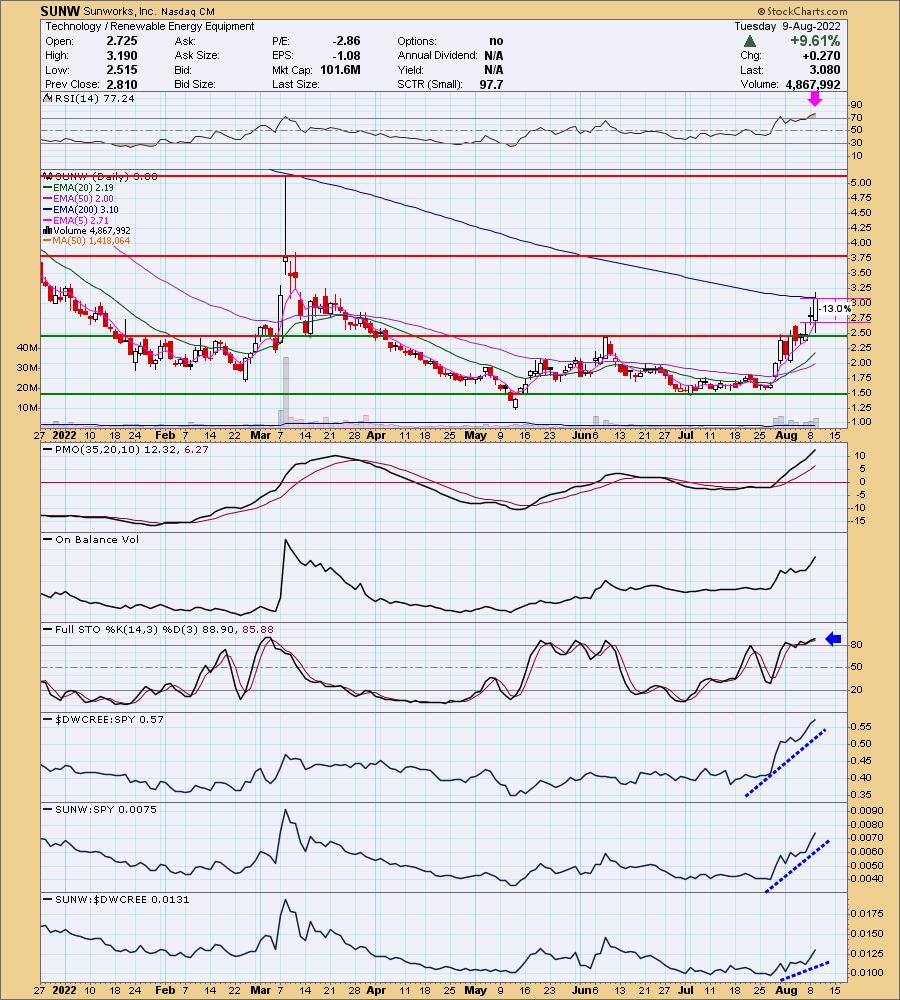
SUNW is down -1.30% in after hours trading. They reported earnings before the market opened and clearly investors liked it. Please note this is a very low-priced stock, so position size wisely. A pullback is highly likely after a move this strong. That would offer you a better entry and the 13% stop level I've listed will be smaller. I don't like to list stops that deep, but it is taking into account a possible pullback before entry. The RSI is overbought which I'm not thrilled with, but price action has been impressive. Remember overbought conditions can persist for a stock in a bull market. It nearly closed above the 200-day EMA today. The PMO is rising strongly and is somewhat overbought. We do see the bottom of its range is generally -15, so the current +12.32 reading isn't that bad. The OBV is confirming the rally, Stochastics are above 80 and oscillating, and relative strength is excellent. As noted above the stop is deep, but a pullback will help. Of course we have a bullish engulfing candlestick today so it may continue higher.
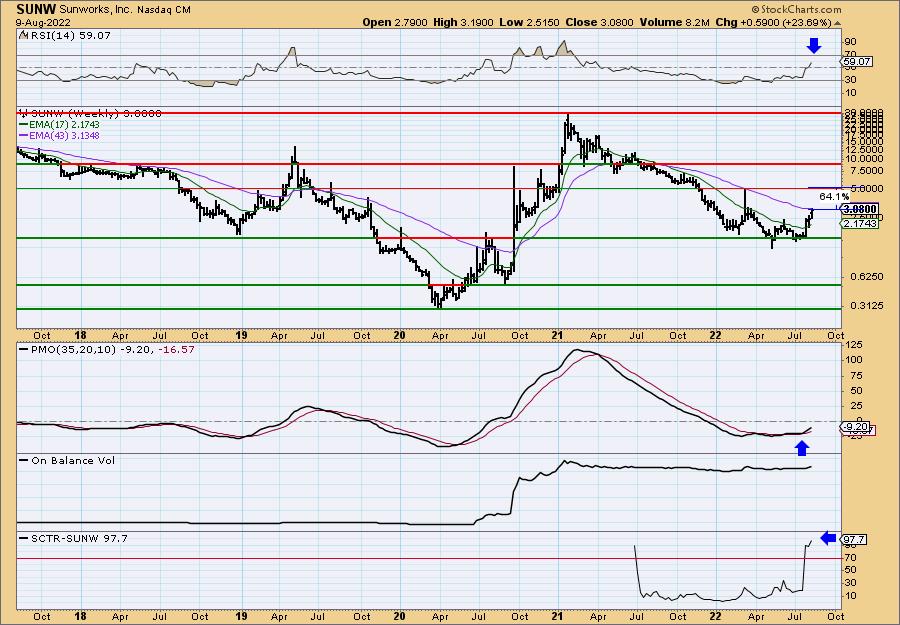
The weekly chart looks excellent! Note that it is a log-scale chart. Therefore, trendlines aren't necessarily useful. The weekly RSI is positive, rising strongly and isn't overbought. The weekly PMO is finally starting to put distance between it and the signal line as it rises. The SCTR is first rate.
Vertex Pharmaceuticals Inc. (VRTX)
EARNINGS: 11/1/2022 (AMC)
Vertex Pharmaceuticals, Inc. is a global biotechnology company, which engages in the business of discovering, developing, manufacturing and commercializing small molecule drugs for patients with serious diseases. The firm focuses on development and commercializing therapies for the treatment of cystic fibrosis, infectious diseases including viral infections such as influenza and bacterial infections, autoimmune diseases such as rheumatoid arthritis, cancer, inflammatory bowel disease and neurological disorders including pain and multiple sclerosis. The company was founded by Joshua S. Boger in 1989 and is headquartered in Boston, MA.
Predefined Scans Triggered: New 52-week Highs, Moved Above Upper Bollinger Band, Moved Above Upper Price Channel and P&F Double Top Breakout.
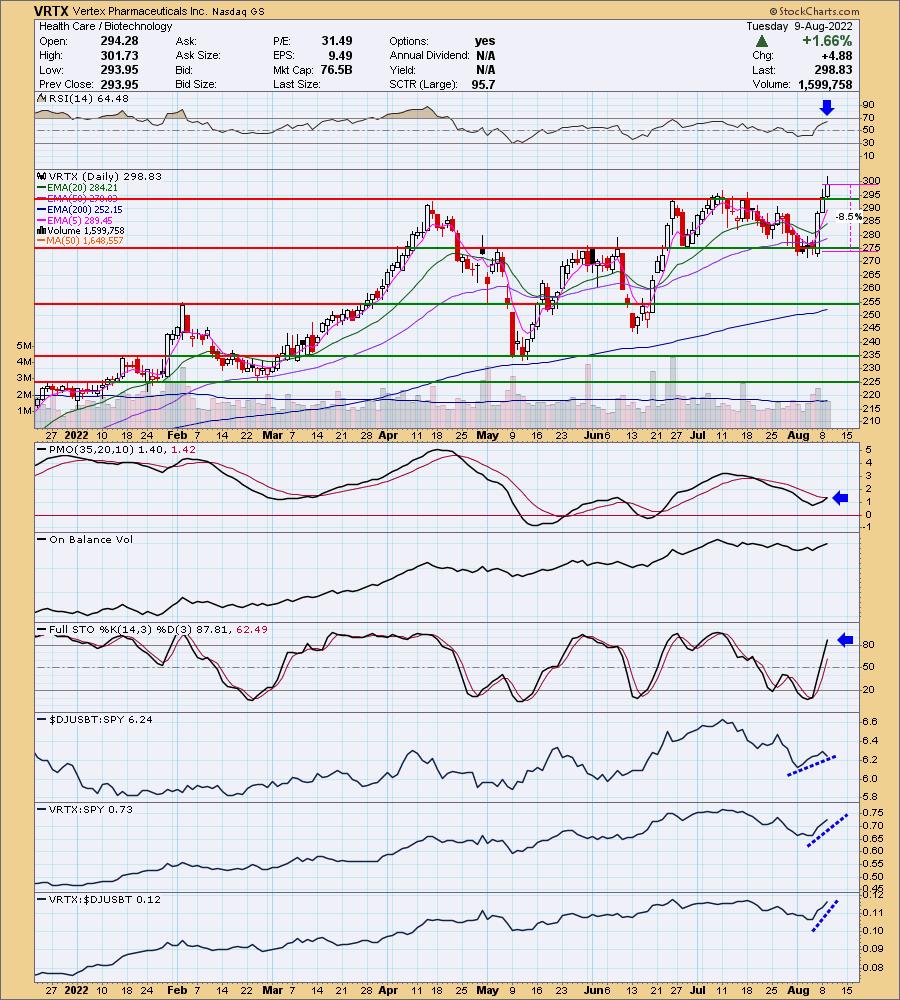
VRTX is up +0.38% in after hours trading. I've covered VRTX once before on April 7th 2020 (Position is closed). File this one under "Winners Keep on Winning". VRTX is at new 52-week highs and is still moving higher. Today's breakout was impressive. The RSI is positive and the PMO is nearing a crossover BUY signal. Stochastics are above 80 and rising strongly. Relative strength for the group is picking up and VRTX is a strong relative performer. The stop is set around 8.5% or $273.43.
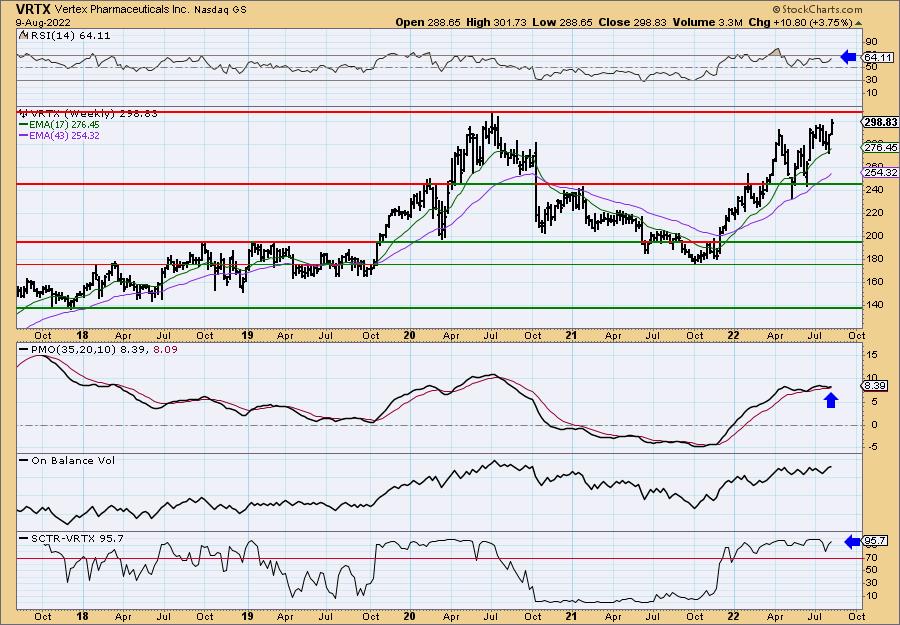
This appears to be an all-time closing high. The weekly RSI has been in positive territory all year. The weekly PMO is bottoming above the signal line again. The OBV is confirming and the SCTR is excellent at over 95%. Consider an upside target around 17% or $349.63.
Don't forget, on Thursdays I look at reader-requested symbols, click HERE to send me an email. I read every email I receive and try to answer them all!
Current Market Outlook:
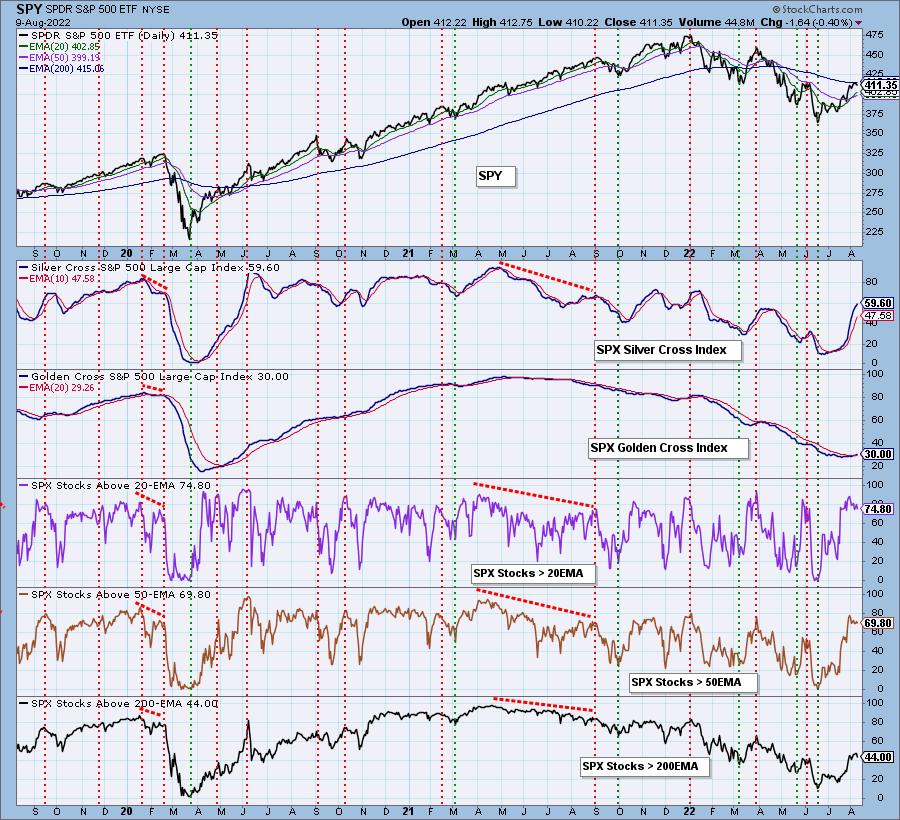
Market Environment: It is important to consider the odds for success by assessing the market tides. The following chart uses different methodologies for objectively showing the depth and trend of participation for intermediate- and long-term time frames.
- The Silver Cross Index (SCI) shows the percentage of SPX stocks on IT Trend Model BUY signals (20-EMA > 50-EMA)
- The Golden Cross Index (GCI) shows the percentage of SPX stocks on LT Trend Model BUY signals (50-EMA > 200-EMA)
Don't forget that as a "Diamonds" member, you have access to our GCI/SCI curated ChartList on DecisionPoint.com. You'll find it under "Members Only" links on the left side on the Blogs and Links Page.
Here is the current chart:
Full Disclosure: I'm will be 60% exposed tomorrow after I purchase GOLD.
I'm required to disclose if I currently own a stock I mention and/or may buy/short it within the next 72 hours.
"Technical Analysis is a windsock, not a crystal ball." - Carl Swenlin
(c) Copyright 2022 DecisionPoint.com
Watch the latest episode of DecisionPoint with Carl & Erin Swenlin on Mondays 7:00p EST or on the DecisionPoint playlist on the StockCharts TV YouTube channel here!
NOTE: The stocks reported herein are from mechanical trading model scans that are based upon moving average relationships, momentum and volume. DecisionPoint analysis is then applied to get five selections from the scans. The selections given should prompt readers to do a chart review using their own analysis process. This letter is not a call for a specific action to buy, sell or short any of the stocks provided. There are NO sure things or guaranteed returns on the daily selection of "Diamonds in the Rough."
Regarding BUY/SELL Signals: The signal status reported herein is based upon mechanical trading model signals and crossovers. They define the implied bias of the price index/stock based upon moving average relationships and momentum, but they do not necessarily call for a specific action. They are information flags that should prompt chart review. Further, they do not call for continuous buying or selling during the life of the signal. For example, a BUY signal will probably (but not necessarily) return the best results if action is taken soon after the signal is generated. Additional opportunities for buying may be found as price zigzags higher, but the trader must look for optimum entry points. Conversely, exit points to preserve gains (or minimize losses) may be evident before the model mechanically closes the signal.
Helpful DecisionPoint Links:
DecisionPoint Shared ChartList and DecisionPoint Chart Gallery
Price Momentum Oscillator (PMO)
Swenlin Trading Oscillators (STO-B and STO-V)
For more links, go to DecisionPoint.com