
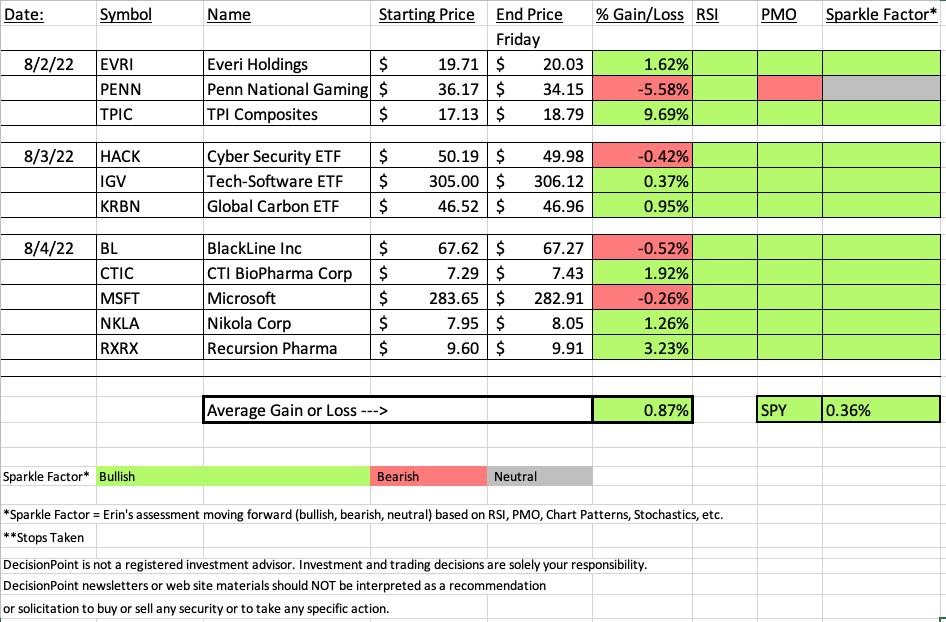
It was excellent week for "Diamonds in the Rough", the one issue was the "Dud" this week took down our overall winning percentage. We still beat the SPY though!
The big winner came from Renewable Energy (TPIC). This group has been on fire and this week it continued to improve relative strength. Gambling was hit and miss. One of the stocks I picked was up on the week (EVRI) and the other (PENN) was the biggest loser.
I do want to mention that I was at my mom and dad's today and my normally very bearish father was telling me that I was probably too bearish. Talk about a switch! I told him that I was cautiously optimistic, but something was bothering me about the SPY price chart and indicators. I couldn't put my finger on it, but I explained this to Dad and he did understand. His evidence is the improvement in the Technology sector and in the top ten highest capitalized stocks in the S&P. I agreed, but told him I need a breakout. It's always interesting when we take different viewpoints. We're about even on who turns out to be right. I hope he is this time around.
The recording link for today's Diamond Mine is below as well as the registration for next Friday's Diamond Mine.
Good Luck & Good Trading,
Erin

RECORDING LINK (8/5/2022):
Topic: DecisionPoint Diamond Mine (8/5/2022) LIVE Trading Room
Start Time: Aug 5, 2022 09:00 AM
Meeting Recording Link
Access Passcode: August#5
REGISTRATION FOR Friday 8/12 Diamond Mine:
When: Aug 12, 2022 09:00 AM Pacific Time (US and Canada)
Topic: DecisionPoint Diamond Mine (8/12/2022) LIVE Trading Room
Register in advance for this webinar HERE
Save the registration confirmation email with login instructions in case Zoom doesn't notify you in time.

A few items about the spreadsheet: I've put on the spreadsheet whether the RSI is positive (green) or negative (red). The PMO column tells you if it is rising (green) or falling (red). Finally I've added my own "Sparkle Factor" that gives you my assessment going forward, bullish (green), bearish (red) or neutral (gray). The Sparkle Factor is basically my thoughts on whether I expect it to rise or fall. A neutral means it could really go either way so it could be added to a watch list. If you're in a stock I consider "neutral" going forward, the ball is in your court.
Darling:
TPI Composites, Inc. (TPIC)
EARNINGS: 8/3/2022 (AMC) *** REPORTS TOMORROW ***
TPI Composites, Inc. is a holding company, which engages in the manufacturing of composite wind blades for the wind energy market. It operates through the following segments: United States (US), Asia, Mexico, Europe, the Middle East & Africa (EMEA), and India. The US segment includes the production of wind blades in its Newton, Iowa plant, the manufacturing of precision molding and assembly systems used for the production of wind blades in its Warren, Rhode Island facility, and composite solutions for the transportation industry. The Asia segment produces wind blades in its Taicang Port, Dafeng, and Yangzhou, China facilities. The Mexico segment focuses on its operation of wind blades in Juárez and Matamoros, Mexico. The EMEA segment offers wind blades from two facilities in Izmir, Turkey, and performs wind blade inspection and repair services. The India segment relates to wind blade sales and other sales operation in India. The company was founded by Everett Pearson and Neil Tillotson in 1968 and is headquartered in Scottsdale, AZ.
Predefined Scans Triggered: Moved Above Upper Keltner Channel, Stocks in a New Uptrend (ADX), Moved Above Upper Price Channel and P&F Double Top Breakout.
Below are the commentary and chart from Tuesday (8/2):
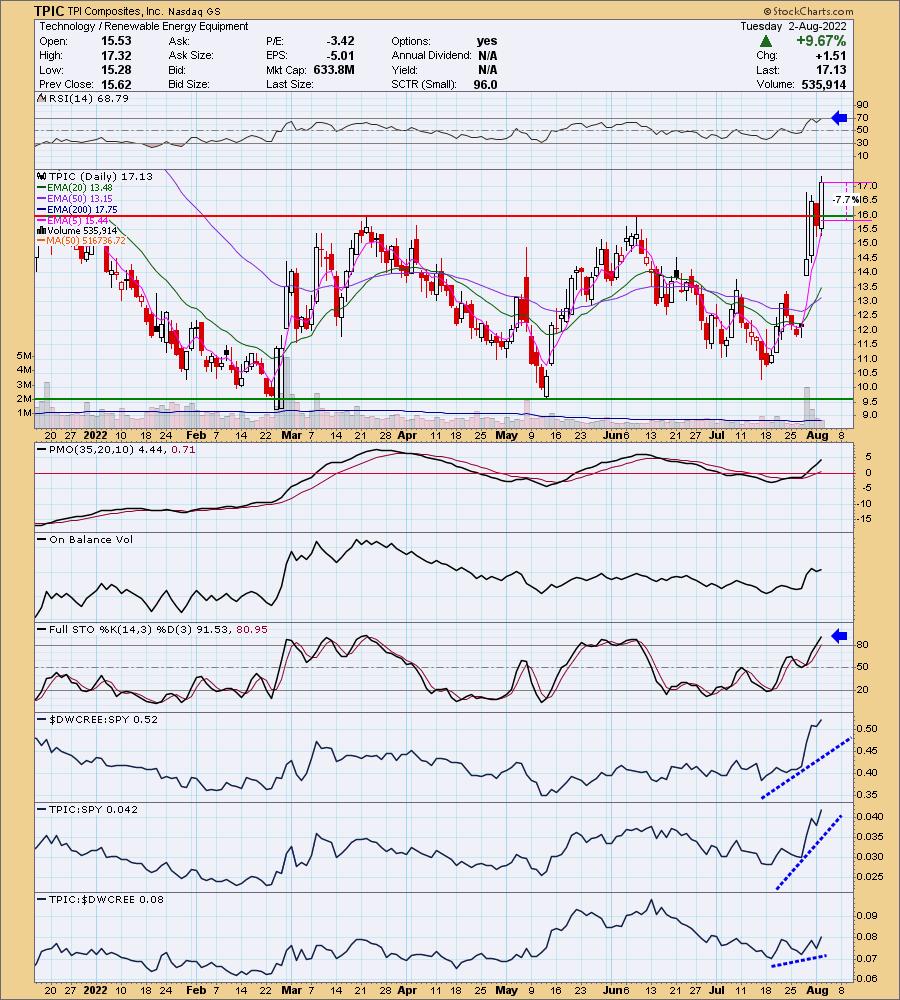
"TPIC is down -1.87% in after hours trading. They report earnings tomorrow. I covered TPIC on December 16th 2020. The position is closed, but it was up over 70% at one point. We have a large bullish engulfing candlestick today. It was unfortunately up 9.67% today and is definitely due for a pullback, so time your entry and you could do very well. The RSI is positive and not yet overbought. The PMO is rising strongly and Stochastics are above 80. The group's strength is very clear and TPIC is one of the better performers. The stop is set at 7.7% or $30.32."
Here is today's chart:
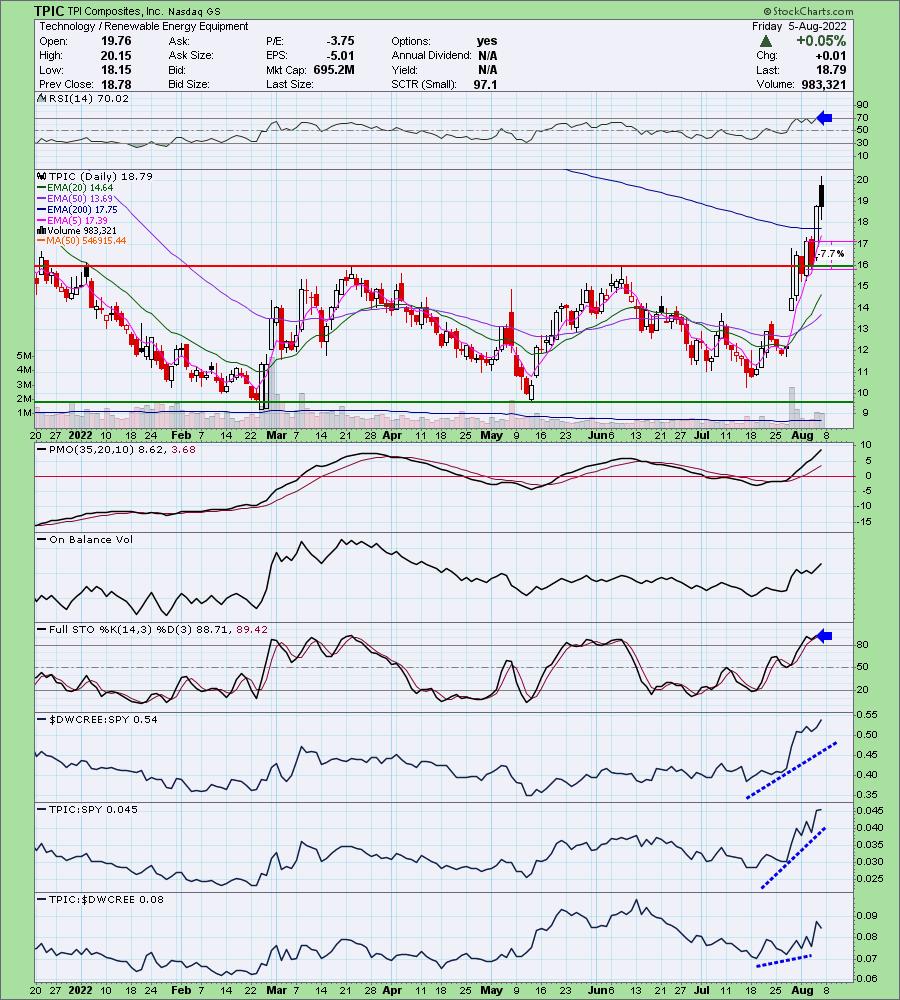
It was dicey on Wednesday when this stock dove lower after I picked it, but it bounced right off support and continued higher. I'm not liking the bearish filled black candlestick, but this offer latecomers a decent entry if a pullback occurs on Monday.
Don't forget, on Thursdays I look at reader-requested symbols, so shoot me an email at erin@decisionpoint.com. I read every email I receive and try to answer them all!
Dud:
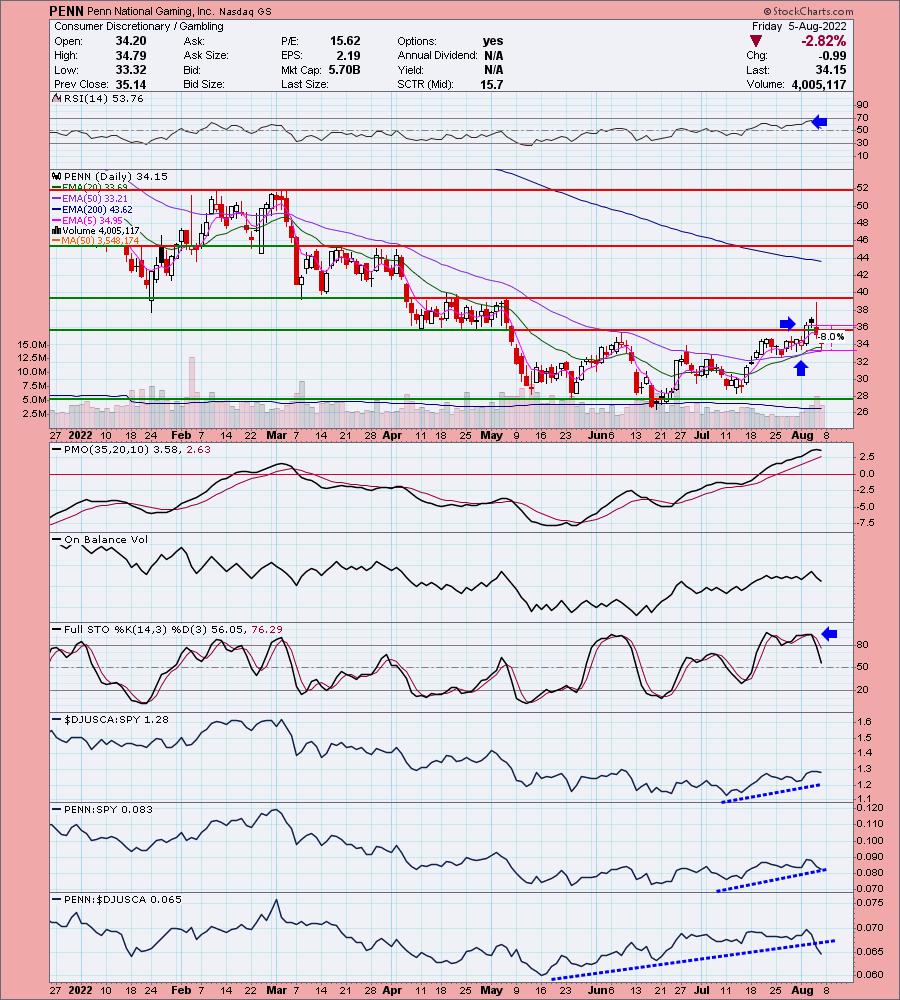
Penn National Gaming, Inc. (PENN)
EARNINGS: 8/4/2022 (BMO)
Penn National Gaming, Inc. owns and manages gaming and racing facilities and video gaming terminal operations with a focus on slot machine entertainment. It operates through the following business segments: Northeast, South, West, Midwest, and Other. The Northeast segment consists of properties including Ameristar East Chicago, Greektown Casino-Hotel, and Hollywood Casino Bangor. The South segment operates properties including 1st Jackpot Casino, Ameristar Vicksburg, and Boomtown Biloxi. The West segment includes Ameristar Black Hawk, Cactus Pete's and Horseshu, and M Resort. The Midwest segment consists of properties including Ameristar Council Bluffs, Argosy Casino Alton, and Argosy Casino Riverside. The Other segment manages properties including Freehold Raceway, Retama Park Racetrack, and Sanford-Orlando Kennel Club. The company was founded by Peter M. Carlino in 1982 and is headquartered in Wyomissing, PA.
Predefined Scans Triggered: Elder Bar Turned Green, New CCI Buy Signals, Moved Above Upper Price Channel and P&F Double Top Breakout.
Below are the commentary and chart from Tuesday (8/2):
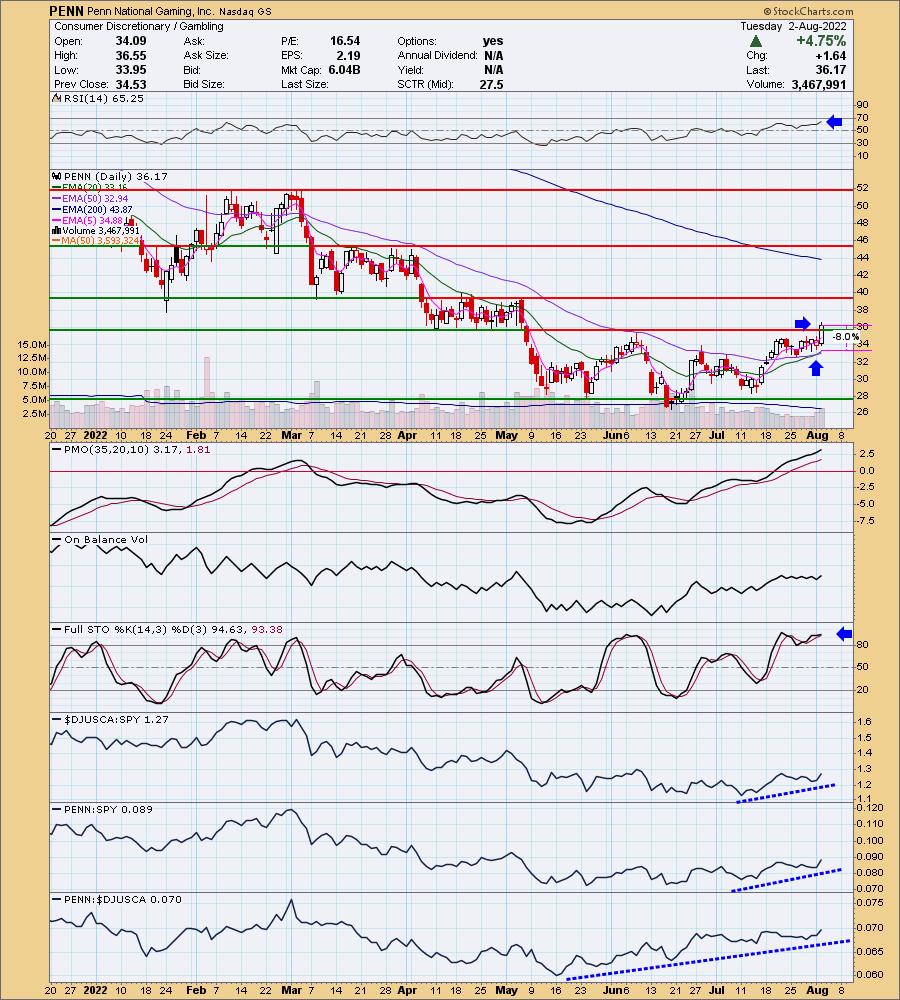
"PENN is down -0.47% in after hours trading. I've covered it twice before in 2020: March 26th and April 30th. The stops were eventually hit so the positions are closed. Today's breakout occurred alongside a new IT Trend Model "Silver Cross" BUY signal (20-day EMA crossed above the 50-day EMA). The PMO is accelerating higher and the RSI is in positive territory/not overbought. Stochastics are oscillating above 80 indicating internal strength. Relative strength is also bullish. The stop is set at $33.28."
Here is today's chart:
I still listed this one with a "Neutral" Sparkle Factor (my outlook for the stock moving forward). It had a bad few days, but support at the 20/50-day EMAs appears to be holding. I do not like the PMO turning over and Stochastics don't look good; hence the Neutral position. I think there are better choices out there, but if you are in it, I would hold on unless it loses the 50-day EMA.
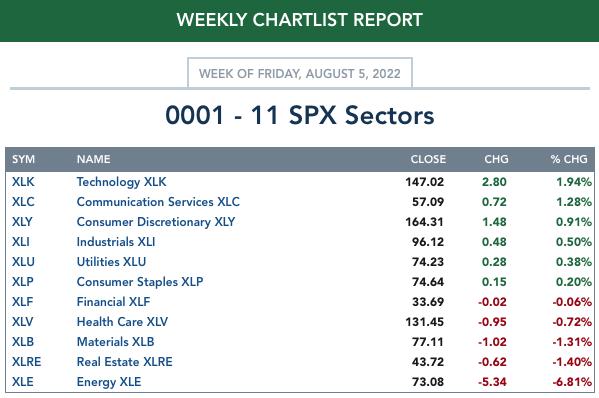
THIS WEEK's Sector Performance:
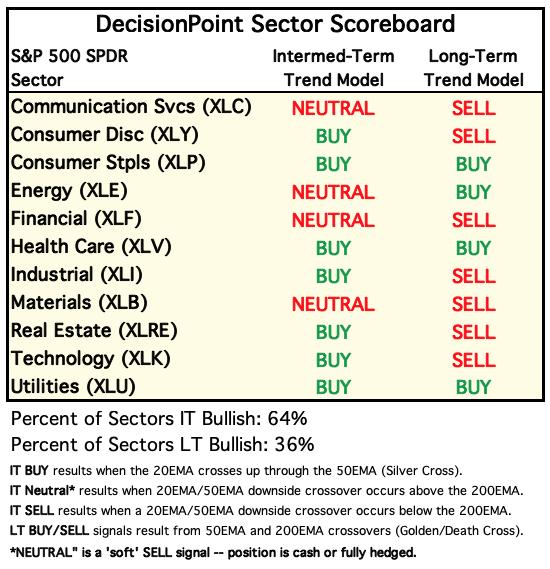
DecisionPoint Sector Scoreboard (Mechanical Trend Model Signals):
Click Here to view Carl's annotated Sector ChartList!
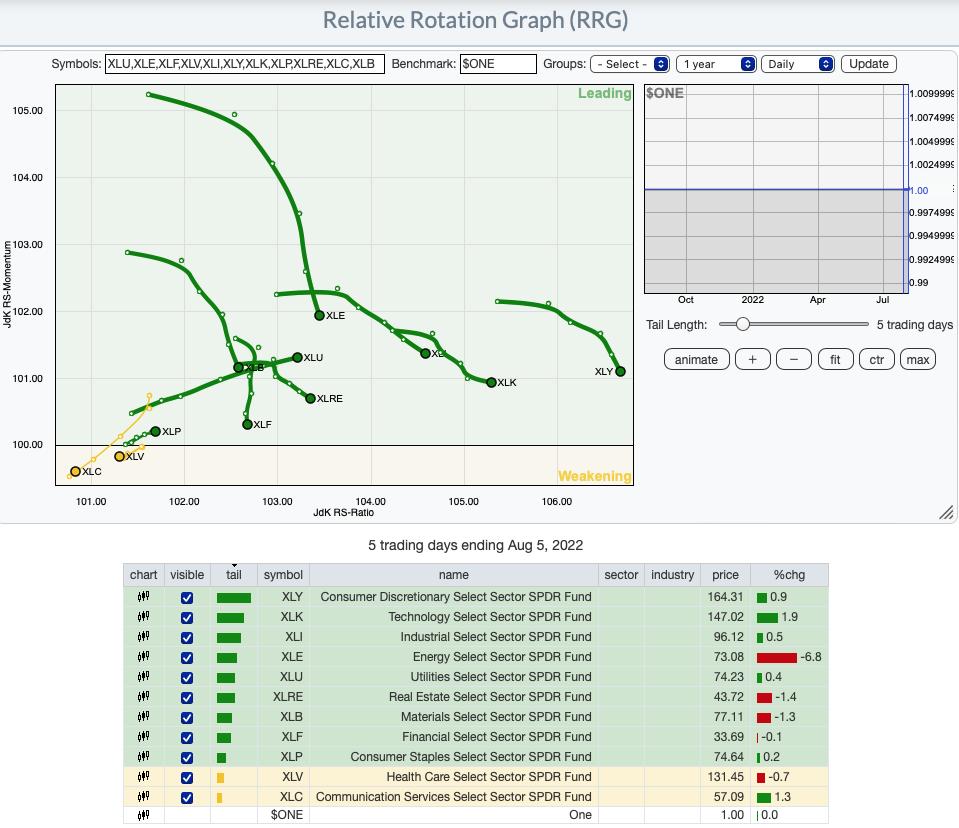
RRG® Daily Chart ($ONE Benchmark):
All but XLC and XLV are in the Leading quadrant. XLV still has a somewhat bearish heading, but XLC has reversed into a bullish northeast heading.
Of those in the Leading quadrant, XLU and XLP are the only two with bullish northeast headings. All others have neutral to bearish southeast headings. Overall, there is clearly some weakness pervading the market, but overall there is still internal strength given the mostly bullish daily RRG.
RRG® Weekly Chart ($ONE Benchmark):
The weekly RRG is bullish. Only two sectors have bearish southwest headings, XLB and XLE. XLU is likely to enter the Lagging quadrant, but its northerly component in its heading means it isn't likely to stay there. If you consider that the center point on the graph is "neutral". If a sector were right on that center point on a $ONE RRG, it would mean that it has neither gained nor lost. So those sectors furthest from the center are the strongest gainers. That would be the three most aggressive sectors, XLC, XLK and XLY. If these sectors continue to outperform, the market has a high likelihood of moving higher.
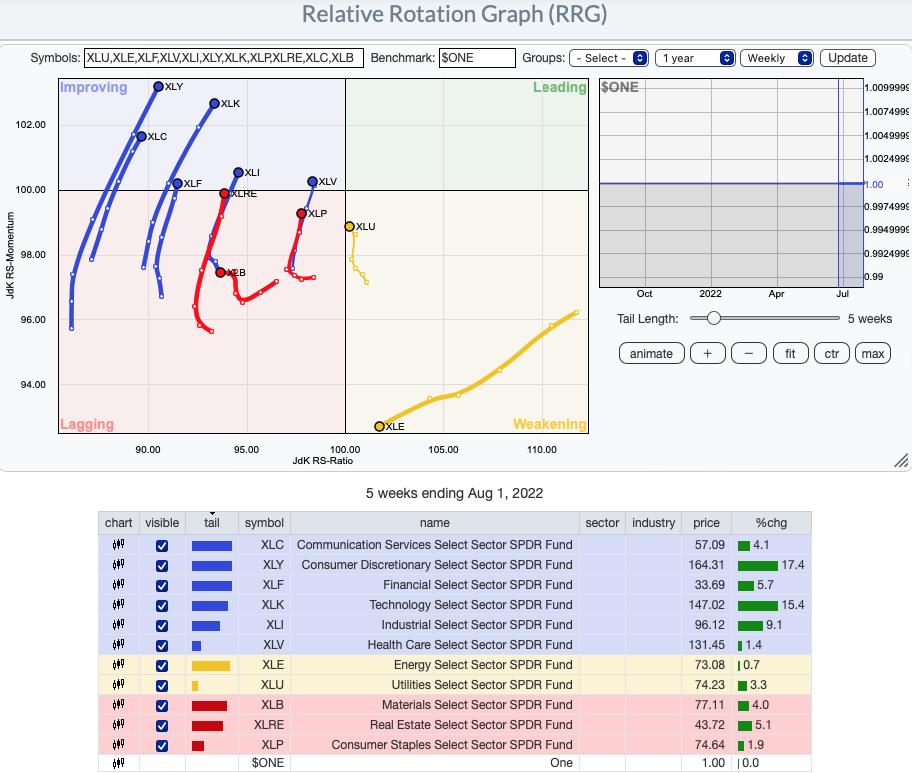
RRG® charts show you the relative strength and momentum for a group of stocks. Stocks with strong relative strength and momentum appear in the green Leading quadrant. As relative momentum fades, they typically move into the yellow Weakening quadrant. If relative strength then fades, they move into the red Lagging quadrant. Finally, when momentum starts to pick up again, they shift into the blue Improving quadrant.
CLICK HERE for an animated version of the RRG charts.
Sector to Watch: Technology (XLK)
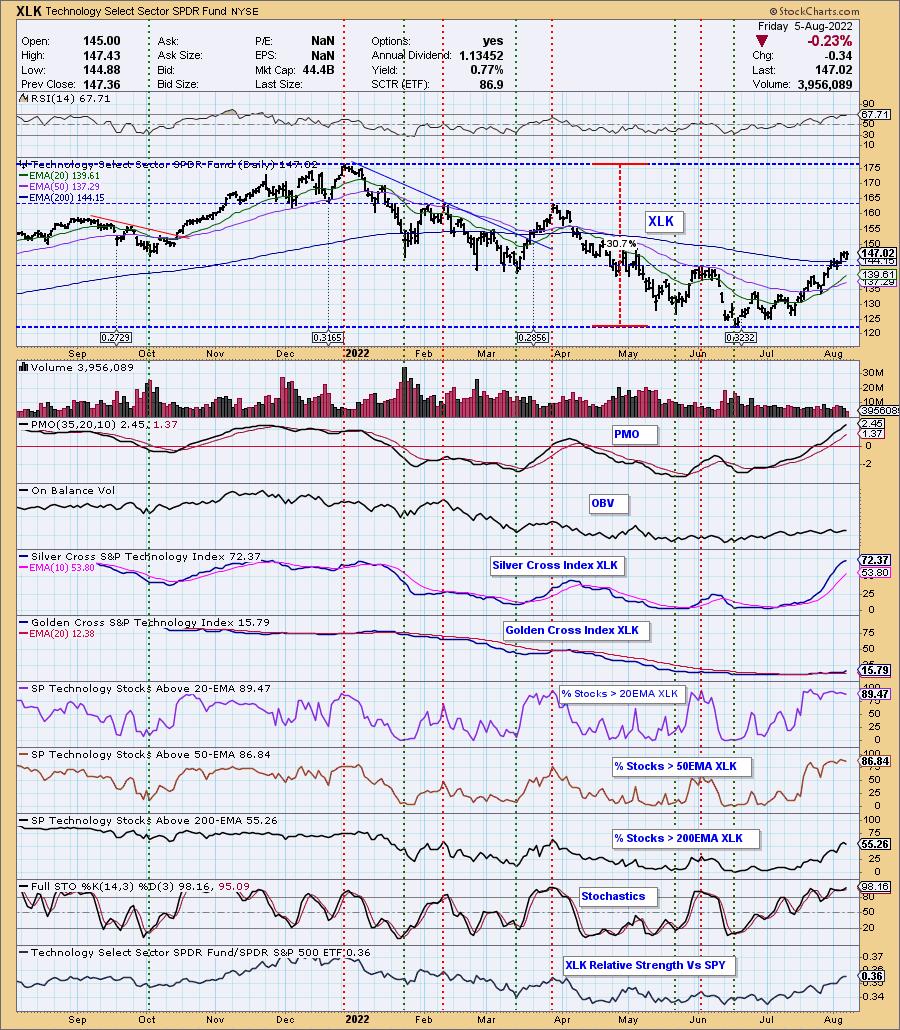
This morning it was a tie among XLK, XLF and XLI as to which would be the "Sector to Watch" next week. After looking at the participation numbers that came in after the close, I decided I liked Technology (XLK) best. Everything is going right for XLK. The RSI is positive and the PMO is rising strongly. Price has overcome strong overhead resistance as well as the 200-day EMA. We have very bullish participation with well over 80% of stocks above their 20/50-day EMAs. This has caused the Silver Cross Index to skyrocket. It is slowing a little now, but note in the last quarter of 2021, it remained overbought for some time. As long as participation of stocks above their key moving averages remains healthy, I see more upside. And yes, this does make me feel more bullish about next week.
Industry Group to Watch: Software (IGV)
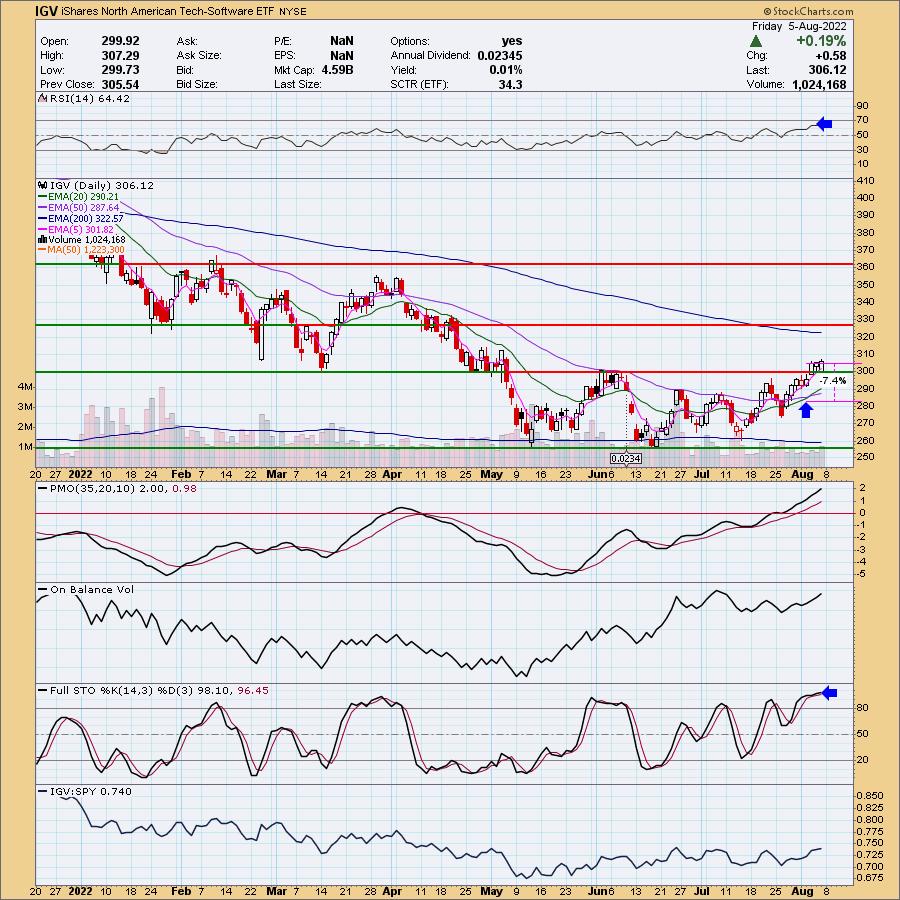
Alright, I cheated a bit as I'm using one Wednesday's "Diamonds in the Rough" instead of the DJUS industry group designation. We can actually trade IGV. I believe I will go ahead and add this to my portfolio next week. The RSI is still positive and this week's breakout is holding. The PMO is rising strongly and isn't overbought yet. Stochastics are steady above 80. I liked the chart on Wednesday and I still like it. I'm feeling a little uneasy about expanding my portfolio, but you know what they say, "Climb the wall of worry". A few symbols I liked when I did a cursory review were: SGFI, PAYC, BOX and this week's "Diamonds in the Rough", MSFT and BL.
Go to our Sector ChartList on DecisionPoint.com to get an in-depth view of all the sectors.
Have a great weekend! Good Luck & Good Trading!
- Erin
erin@decisionpoint.com
Full Disclosure: I'm 50% exposed.
Watch the latest episode of DecisionPoint with Carl & Erin Swenlin on Mondays 7:00p EST or on the DecisionPoint playlist on the StockCharts TV YouTube channel here!
Technical Analysis is a windsock, not a crystal ball. --Carl Swenlin
NOTE: The stocks reported herein are from mechanical trading model scans that are based upon moving average relationships, momentum and volume. DecisionPoint analysis is then applied to get five selections from the scans. The selections given should prompt readers to do a chart review using their own analysis process. This letter is not a call for a specific action to buy, sell or short any of the stocks provided. There are NO sure things or guaranteed returns on the daily selection of "diamonds in the rough."
Helpful DecisionPoint Links:
DecisionPoint Shared ChartList and DecisionPoint Chart Gallery
Price Momentum Oscillator (PMO)
Swenlin Trading Oscillators (STO-B and STO-V)
(c) Copyright 2022 DecisionPoint.com