
Okay, here's what I missed...kind of. Yesterday I had quite a few insurance stocks hit my scans. I was concentrating on ETFs, but I feel I should've mentioned that theme as many of those stocks outperformed today. Well, one of my readers brought a nice looking stock from the Property & Casualty industry group.
A "hot tip" from a follower suggested that we look at H&R Block given the new hires at the IRS. It certainly performed well yesterday, but was somewhat disappointing today. I actually prefer Intuit (INTU). It's a software stock but they are famous for TurboTax. It wasn't a request so I'm not showing you the chart. Just thought the "news story" was interesting.
I've listed all of the requests given in the "runners-up" list if I'm not covering it. I will say that I don't believe all of these would make the cut as "Diamonds in the Rough", so look carefully at them. The ones that have me concerned are any that have a decelerating PMO and/or very overbought RSIs. Winners keep on winning, but they've been winning for awhile.
Good Luck & Good Trading!
Erin
Today's "Diamonds in the Rough": CHPT, DQ, NOW, RRC and SIGI.
Runners-up: PFIX, HRB, INTU, ICL, UBER, ORCL, ARKO, CAL, ELA, FBP, RNA, SFBS and UNG.

RECORDING LINK (8/5/2022):
Topic: DecisionPoint Diamond Mine (8/5/2022) LIVE Trading Room
Start Time: Aug 5, 2022 09:00 AM
Meeting Recording Link
Access Passcode: August#5
REGISTRATION FOR Friday 8/12 Diamond Mine:
When: Aug 12, 2022 09:00 AM Pacific Time (US and Canada)
Topic: DecisionPoint Diamond Mine (8/12/2022) LIVE Trading Room
Register in advance for this webinar HERE
Save the registration confirmation email with login instructions in case Zoom doesn't notify you in time.

StockChartsTV is now producing the recording for the free DP Trading Room! It airs at 3p ET, much sooner than I was able to get out the recording links. Carl has joined so you can "ask the master" all those questions you've always wanted his opinion on! If you haven't registered to attend live at Noon ET, you can do so HERE
Welcome to DecisionPoint Daily Diamonds, wherein I highlight ten "Diamonds in the Rough" per week. These are selected from the results of my DecisionPoint Scans, which search for stocks that could benefit from the trend and condition of the market. Remember, these are not recommendations to buy or sell, but are the most interesting of the stocks that surfaced in my scans. My objective is to save you the work of the initial, tedious culling process, but you need to apply your own analysis to see if these stocks pique your interest as well. There are no guaranteed winners here!
"Predefined Scans Triggered" are taken from StockCharts.com using the "Symbol Summary" option instead of a "SharpChart" on the workbench.
ChargePoint Holdings, Inc. (CHPT)
EARNINGS: 9/1/2022 (AMC)
ChargePoint Holdings, Inc. operates as an electric vehicle charging network provider. It designs, develops and markets networked electric vehicle charging system infrastructure and its Cloud Services enable consumers the ability to locate, reserve, authenticate and transact electric vehicle charging sessions. The firm provides an open platform providing real-time information about charging sessions and control, support and management of the networked charging systems. This network provides multiple web-based portals for charging system owners, fleet managers, drivers and utilities. The company was founded in 2007 and is headquartered in Campbell, CA.
Predefined Scans Triggered: None.
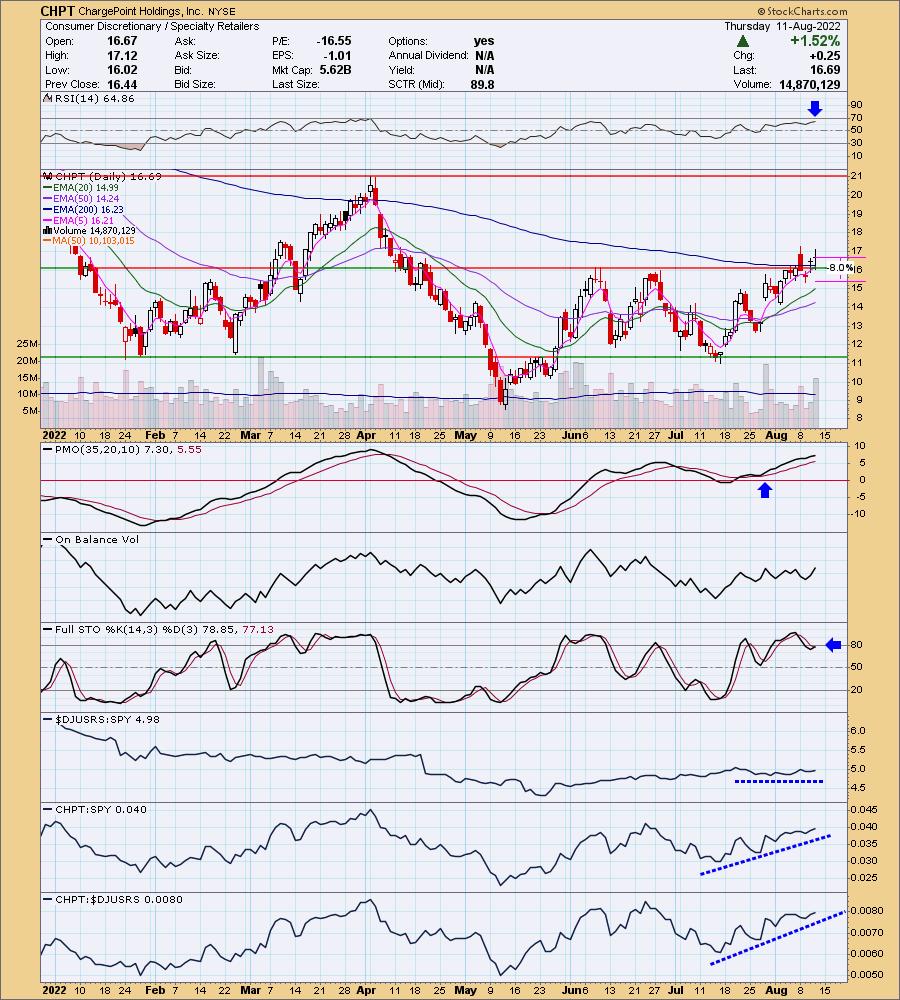
CHPT is up +0.66% in after hours trading. I covered CHPT on June 2nd 2022 (position closed). I like the breakout yesterday and followthrough today that held new support at the June tops and 200-day EMA. It has been in a trading range for the past few months so this breakout is good to see. The PMO bottomed above its signal line in June. It is getting a bit overbought, but based on the lows of -12, a reading of +7.30 is fine. Stochastics have turned back up. Relative strength looks good. I have set an 8% stop below June tops at around $15.35.
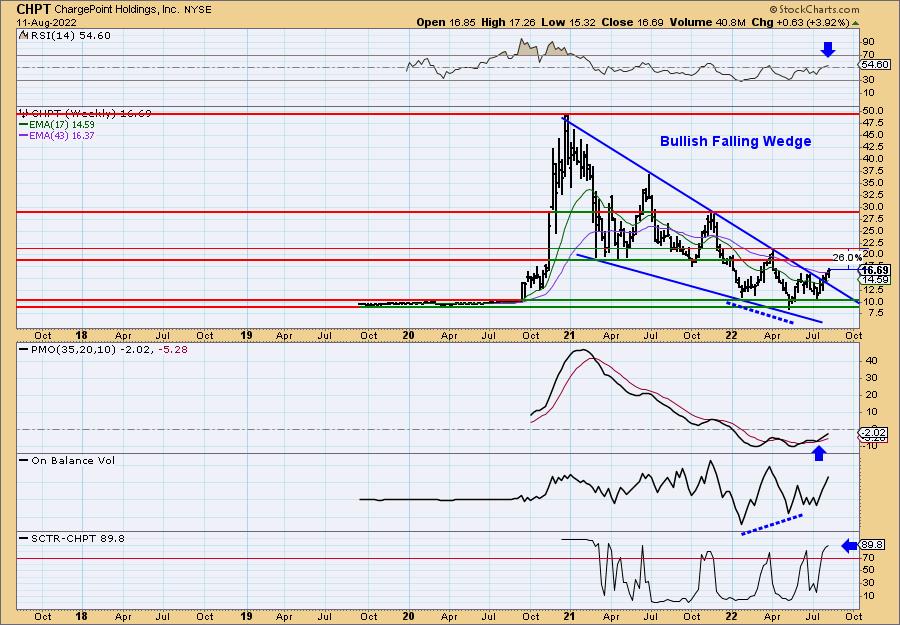
The breakout looks even better on the weekly chart given it is confirming a bullish falling wedge. The expectation is higher prices. The weekly PMO bottomed above its signal line which is especially bullish. Notice that there is a positive OBV divergence that led into the breakout. Price has overcome the 43-week EMA. The weekly RSI just moved into positive territory. Upside potential is about 26% or more if it breaks out above the 2022 high.
Daqo New Energy Corp. (DQ)
EARNINGS: 10/27/2022 (BMO)
Daqo New Energy Corp. is a holding company, which engages in the provision of polysilicon products. It involves in the manufacture and sale of polysilicon to photovoltaic product manufactures, who further process the polysilicon into ingots, wafers, cells, and modules for solar power solutions. The company was founded by Guang Fu Xu on November 22, 2007 and is headquartered in Shanghai, China.
Predefined Scans Triggered: P&F Bullish Catapult, Filled Black Candles, P&F Ascending Triple Top Breakout and P&F Double Top Breakout.
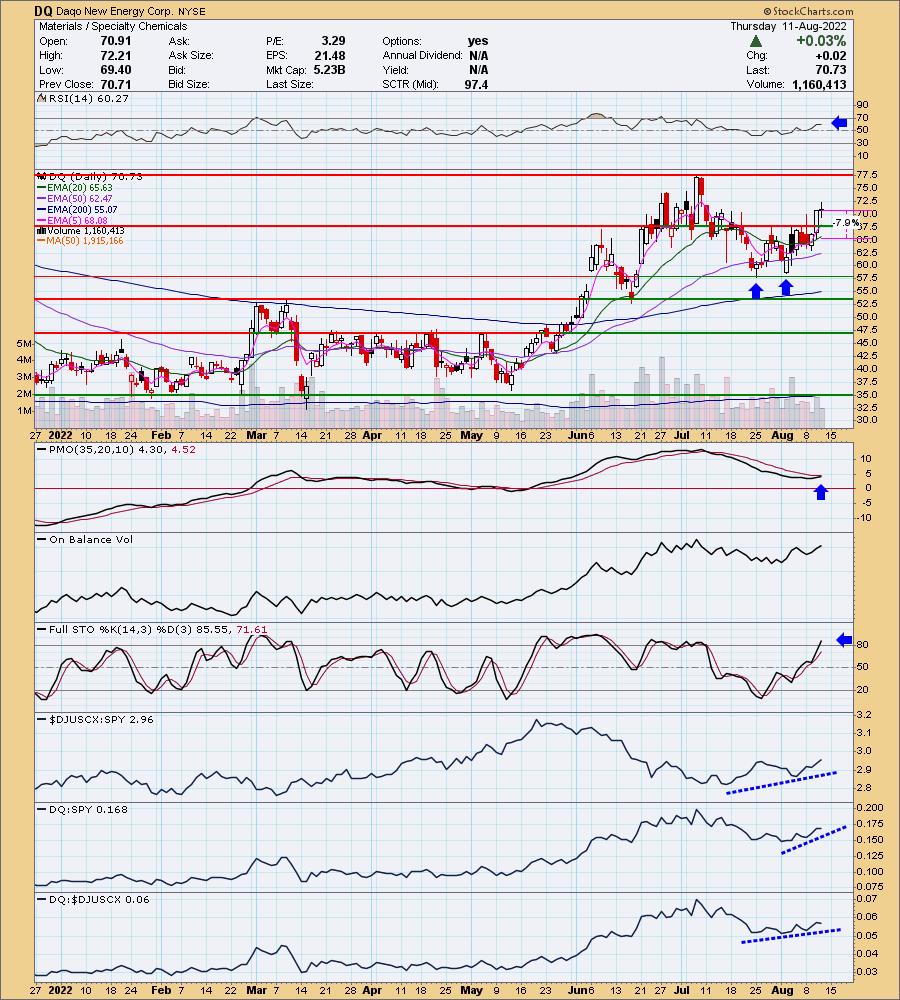
DQ is down -1.02% in after hours trading. I must say that every time I see this symbol I think "Dairy Queen" as that is what we call it. Pretty sure I don't want to eat what Daqo produces. We have a bullish double bottom pattern that executed on yesterday's breakout. The minimum upside target is just past the July high. The RSI is positive and the PMO is nearing a crossover BUY signal. Stochastics are above 80 and relative strength is very good. I've set the stop below support and the 20-day EMA at 7.9% or around $65.14.
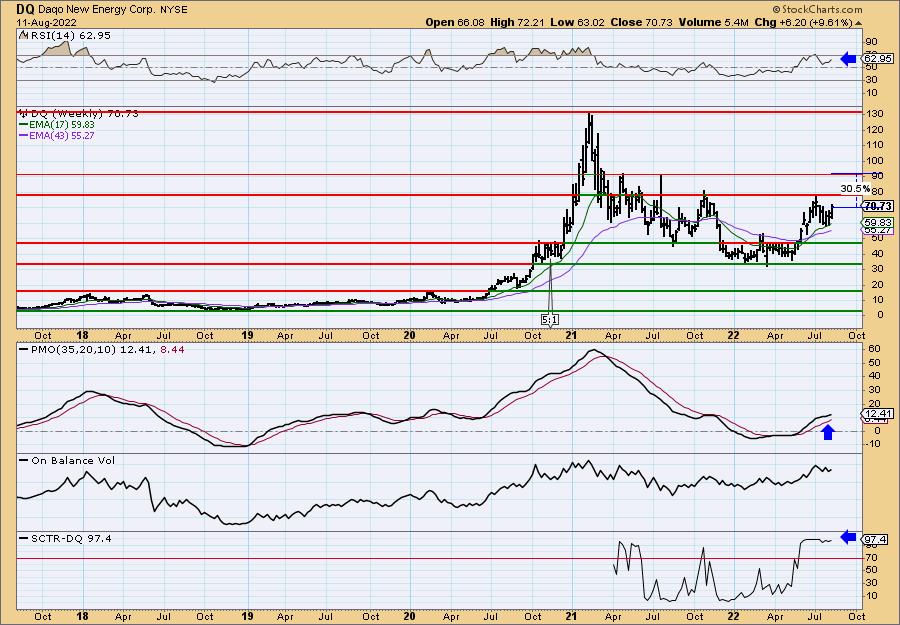
Last time DQ tested the late-2021 high, it was turned away. Based on the indicators, I expect the breakout this time. The weekly RSI is positive, rising and not overbought. The weekly PMO is accelerating higher and the SCTR rank is superb. I've set upside potential at about 30% at the mid-2021 highs.
ServiceNow, Inc. (NOW)
EARNINGS: 10/26/2022 (AMC)
ServiceNow, Inc. engages in the provision of enterprise cloud computing solutions. The firm delivers digital workflows on a single enterprise cloud platform called the Now Platform. Its product portfolio is focused on providing Information Technology, Employee and Customer workflows. It offers its solutions for the industries under the categories of government, financial services, healthcare, telecommunications, manufacturing, IT services, technology, oil & gas, education, and consumer products. The company was founded by Frederic B. Luddy in June 2004 and is headquartered in Santa Clara, CA.
Predefined Scans Triggered: Elder Bar Turned Blue, Bearish Engulfing, P&F Ascending Triple Top Breakout and P&F Double Top Breakout.
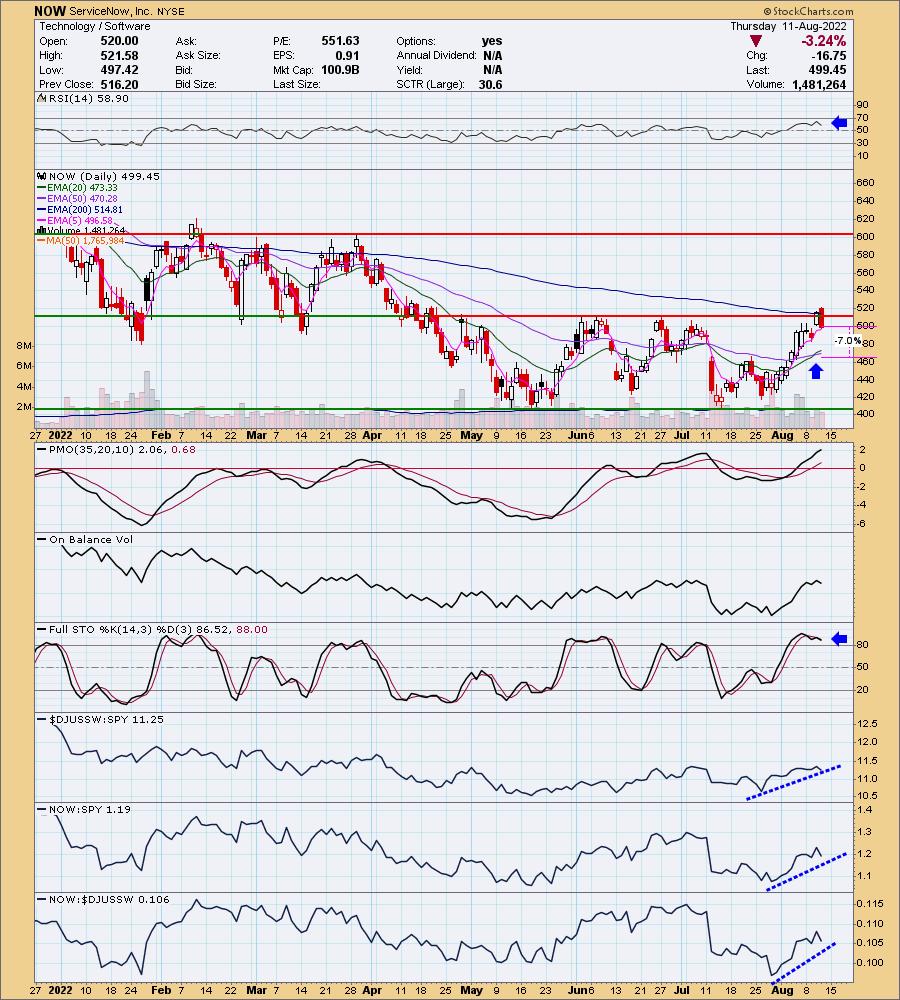
NOW is up +0.29% in after hours trading. I've covered it three times before, all in 2020: May 21st (position open and up +30.19%), August 13th (position closed on 2022 low) and August 25th (position closed on 2022 low).
I do not like today's bullish engulfing candlestick which implies lower prices tomorrow so time your entry appropriately. I was asked by the subscriber whether adding to their position made sense. I do see this as a hold and a slightly risky entry. The indicators are still very positive and it did break from the trading range yesterday. The PMO is rising and not overbought given the bottom of the range is -6, this implies +6 is the upper range. Stochastics turned over, but remain above 80. Relative strength is very good. I've set the stop below the 50-day EMA at 7% around $464.59.
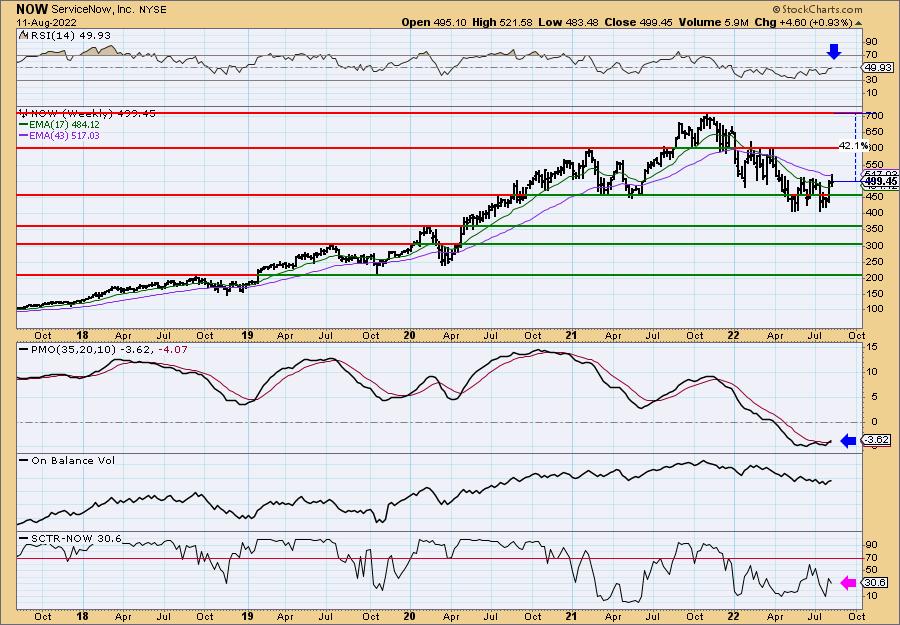
The weekly chart is positive overall. The weekly RSI is nearing positive territory and the weekly PMO shows a crossover BUY signal. For me, I would prefer to enter after the breakout sticks. Upside potential is about 21% at first resistance level and 42% at the second resistance level.
Range Resources Corp. (RRC)
EARNINGS: 10/25/2022 (AMC)
Range Resources Corp. engages in the exploration, development and acquisition of natural gas and oil properties in the Appalachian and Midcontinent regions. The company was founded in 1976 and is headquartered in Fort Worth, TX.
Predefined Scans Triggered: New CCI Buy Signals.
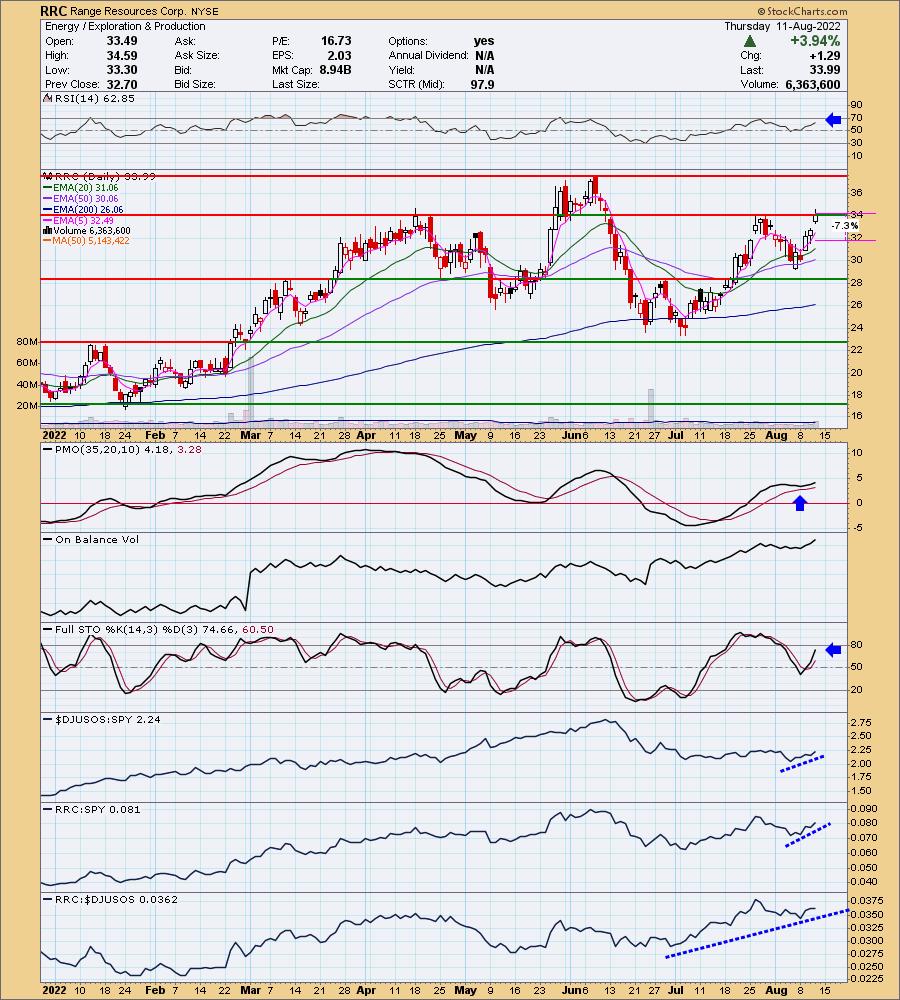
RRC is up +0.32% in after hours trading. I covered it on March 10th 2022. The position is open and up +20.83%. I like today's breakout on the gap up. It did settle right on resistance, but the chart is strong. The RSI is positive and the PMO very bullishly bottomed above its signal line. Stochastics are rising after bottoming just out of positive territory. Relative strength is excellent. I've set the stop at 7.3% around $31.51.
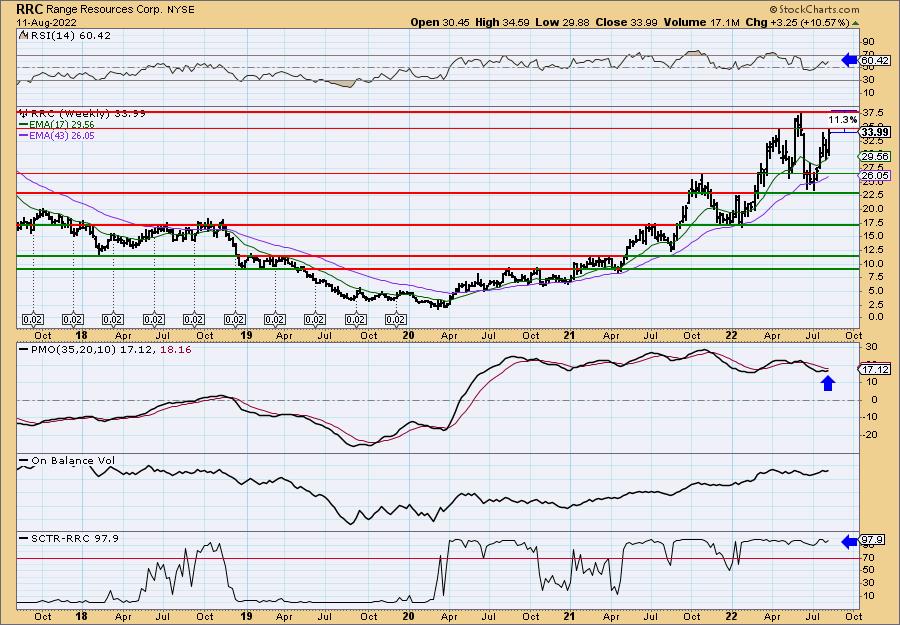
The weekly RSI is in positive territory and rising. The weekly PMO is starting to rise toward a crossover BUY signal. The SCTR is outstanding at 98%. The next level of resistance is about 11% away, but I would set a target around 17% or $39.77.
Selective Insurance Group, Inc. (SIGI)
EARNINGS: 10/26/2022 (AMC)
Selective Insurance Group, Inc. provides property and casualty insurance products. It operates through the following segments: Standard Commercial Lines, Standard Personal Lines, E&S Lines, and Investments. The Standard Commercial Lines segment offers insurance products and services to commercial customers, such as non-profit organizations and local government agencies. The Standard Personal Lines segment consists of insurance products and services, including flood insurance coverage. The E&S Lines segment includes insurance products and services provided to customers who have not obtained coverage in the standard marketplace. The Investments segment includes premiums collected by various segments and engages in the issuance of debt and equity securities. Selective Insurance Group was founded by Daniel L. B. Smith in 1926 and is headquartered in Branchville, NJ.
Predefined Scans Triggered: Bullish MACD Crossovers and P&F Low Pole.
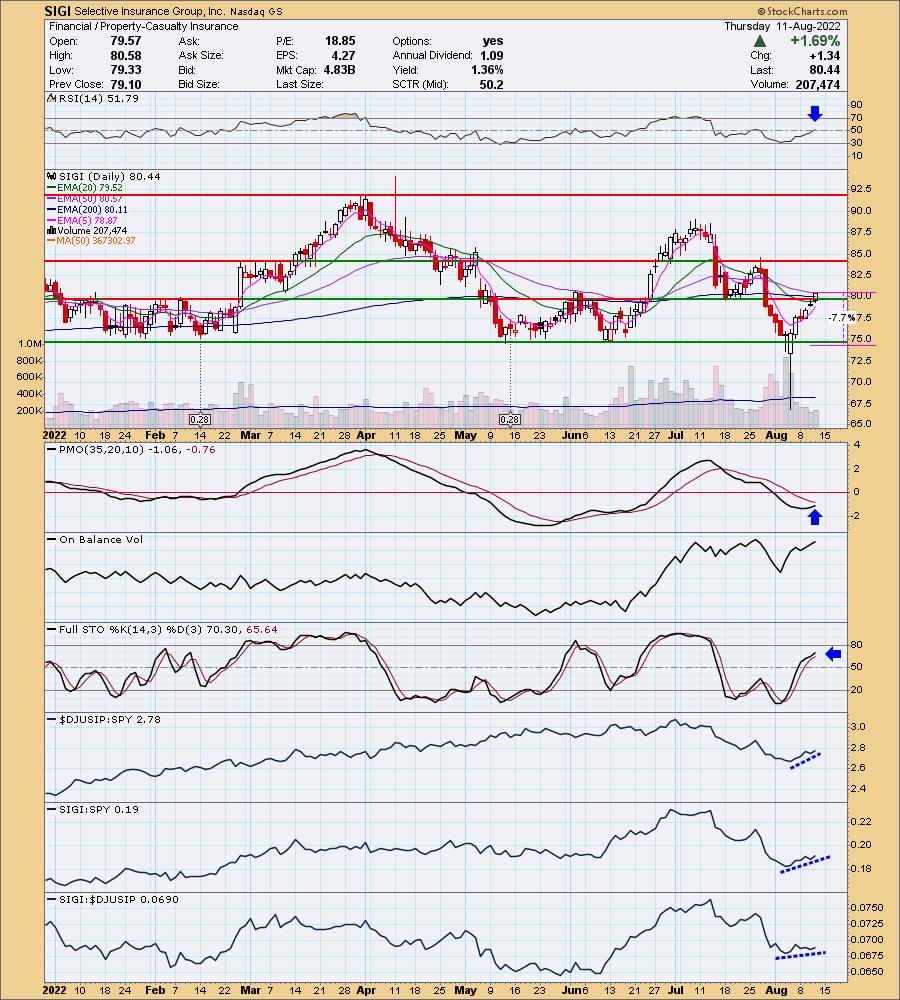
SIGI is unchanged in after hours trading. Price is breaking out above the July bottom, but still has to overcome the 50-day EMA and the early June top. The indicators suggest it will. The RSI just moved into positive territory and the PMO is closing in on a crossover BUY signal. Stochastics are rising in positive territory. There is a strong positive OBV divergence that led into this rally so it should sustain. The stop is set at 7.7% around $74.25.
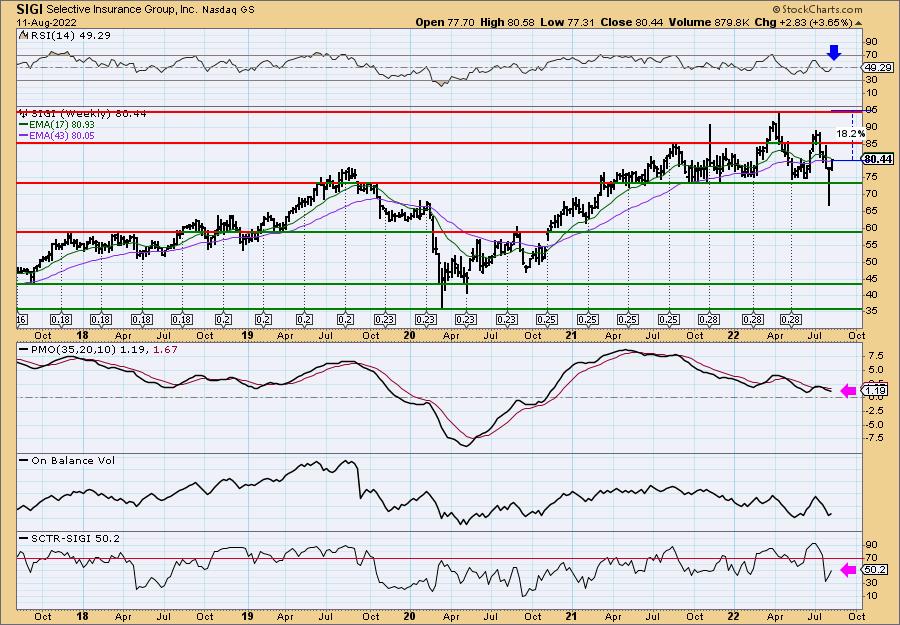
The weekly chart shows a trading range with subsequent failed breakouts. Overall support is holding. The weekly RSI should hit positive territory shortly. The weekly PMO isn't so bullish, but it does look like it is decelerating. I'd also like to see a much higher SCTR. Probably a more short-term investment. Upside potential is about 18.2%.
Don't forget, on Thursdays I look at reader-requested symbols, click HERE to send me an email. I read every email I receive and try to answer them all!
Current Market Outlook:
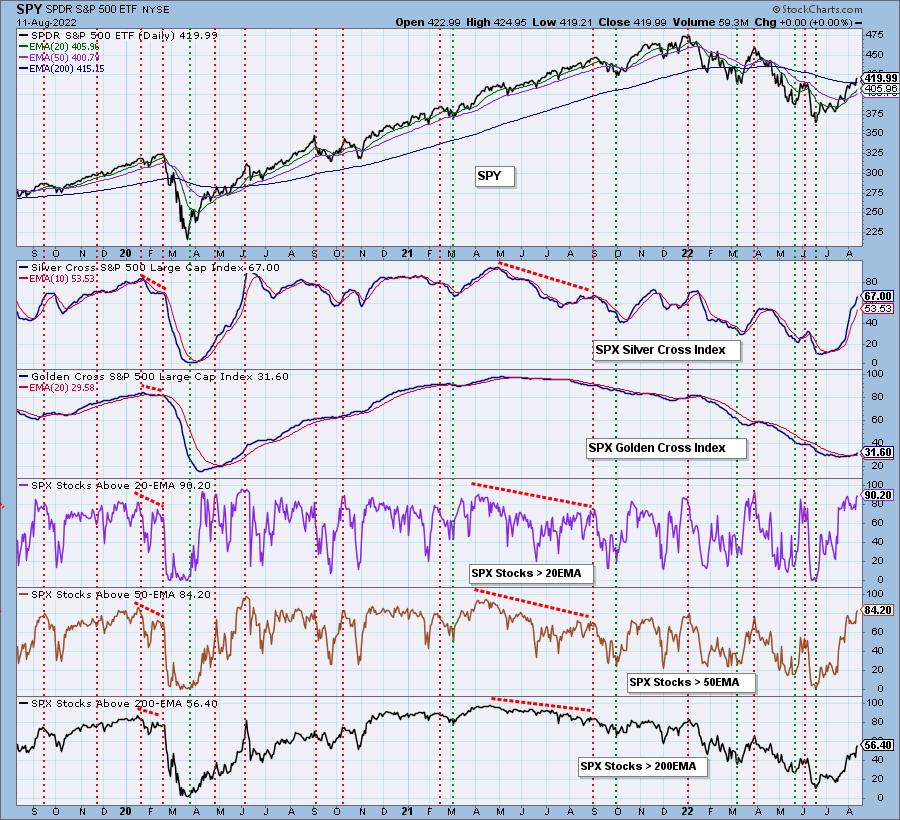
Market Environment: It is important to consider the odds for success by assessing the market tides. The following chart uses different methodologies for objectively showing the depth and trend of participation for intermediate- and long-term time frames.
- The Silver Cross Index (SCI) shows the percentage of SPX stocks on IT Trend Model BUY signals (20-EMA > 50-EMA)
- The Golden Cross Index (GCI) shows the percentage of SPX stocks on LT Trend Model BUY signals (50-EMA > 200-EMA)
Don't forget that as a "Diamonds" member, you have access to our GCI/SCI curated ChartList on DecisionPoint.com. You'll find it under "Members Only" links on the left side on the Blogs and Links Page.
Here is the current chart:
Full Disclosure: I'm 60% exposed to the market.
I'm required to disclose if I currently own a stock I mention and/or may buy/short it within the next 72 hours.
"Technical Analysis is a windsock, not a crystal ball." - Carl Swenlin
(c) Copyright 2022 DecisionPoint.com
Watch the latest episode of DecisionPoint with Carl & Erin Swenlin on Mondays 7:00p EST or on the DecisionPoint playlist on the StockCharts TV YouTube channel here!
NOTE: The stocks reported herein are from mechanical trading model scans that are based upon moving average relationships, momentum and volume. DecisionPoint analysis is then applied to get five selections from the scans. The selections given should prompt readers to do a chart review using their own analysis process. This letter is not a call for a specific action to buy, sell or short any of the stocks provided. There are NO sure things or guaranteed returns on the daily selection of "Diamonds in the Rough."
Regarding BUY/SELL Signals: The signal status reported herein is based upon mechanical trading model signals and crossovers. They define the implied bias of the price index/stock based upon moving average relationships and momentum, but they do not necessarily call for a specific action. They are information flags that should prompt chart review. Further, they do not call for continuous buying or selling during the life of the signal. For example, a BUY signal will probably (but not necessarily) return the best results if action is taken soon after the signal is generated. Additional opportunities for buying may be found as price zigzags higher, but the trader must look for optimum entry points. Conversely, exit points to preserve gains (or minimize losses) may be evident before the model mechanically closes the signal.
Helpful DecisionPoint Links:
DecisionPoint Shared ChartList and DecisionPoint Chart Gallery
Price Momentum Oscillator (PMO)
Swenlin Trading Oscillators (STO-B and STO-V)
For more links, go to DecisionPoint.com