
I had quite a few requests this week with a clear theme of Energy stocks. It was brought to my attention that with the pressure on producing more gas to bring down prices in the U.S. that refineries will become very busy. One of yesterday's "Diamonds in the Rough", PBF, is a company that refines.
I decided to include two Energy names that were requested and then threw in Software, Gold Mining and a Retailer to widen the variety. Do check the other Energy names in the "Stocks to Review". I also included other reader requests in the "Stocks to Review" that include Financials (not a fan) and Agriculture (mixed reviews, but I know we've talked WEAT and DBA before).
I'm rearranging the Diamond Mine presentation per reader request. Instead of waiting to cover the sector/industry group/stocks to watch at the end, I will do it after the overall market review. Then we can spend the rest of the time looking at symbol requests. I don't know why I didn't think of this before so thank you, dear reader, for your excellent idea!
See you in tomorrow's Diamond Mine! Here is a link to register.
Good Luck & Good Trading,
Erin
Today's "Diamonds in the Rough": AUY, CHPT, PAA, TRGP AND VRNT.
Stocks to Review: ENB, PBA, ADM, AR, C, CF, CANO, CRK, DBA, DVN, ENLC, EOG, GS, JPM, MOO, MOS, PTEN, SSRM, UEC, WEAT and XLF.

RECORDING LINK (5/27/2022):
Topic: DecisionPoint Diamond Mine 5/27/2022) LIVE Trading Room
Start Time: May 27, 2022 09:00 AM
Meeting Recording Link.
Access Passcode: MayDP#27
REGISTRATION FOR Friday 6/3 Diamond Mine:
When: Jun 3, 2022 09:00 AM Pacific Time (US and Canada)
Topic: DecisionPoint Diamond Mine (6/3/2022) LIVE Trading Room
Register in advance for this webinar HERE.
** Save the registration confirmation email with login instructions in case Zoom doesn't notify you in time.**

Free DP Trading Room (5/31) RECORDING LINK:
Topic: DecisionPoint Trading Room
Start Time: May 31, 2022 08:59 AM
Meeting Recording Link.
Access Passcode: May#31st
For best results, copy and paste the access code to avoid typos.
Welcome to DecisionPoint Daily Diamonds, wherein I highlight ten "Diamonds in the Rough" per week. These are selected from the results of my DecisionPoint Scans, which search for stocks that could benefit from the trend and condition of the market. Remember, these are not recommendations to buy or sell, but are the most interesting of the stocks that surfaced in my scans. My objective is to save you the work of the initial, tedious culling process, but you need to apply your own analysis to see if these stocks pique your interest as well. There are no guaranteed winners here!
"Predefined Scans Triggered" are taken from StockCharts.com using the "Symbol Summary" option instead of a "SharpChart" on the workbench.
Yamana Gold Inc. (AUY)
EARNINGS: 7/28/2022 (AMC)
Yamana Gold, Inc. engages in the production of gold, silver and copper. It operates through the following segments: El Peñón, Canadian Malartic, Jacobina, Minera Florida, Cerro Moro, Other Mines, and Corporate and Other. The company was founded by Peter Marrone on March 17, 1994 and is headquartered in Toronto, Canada.
Predefined Scans Triggered: Moved Above Upper Bollinger Band, Stocks in a New Uptrend (Aroon), Moved Above Ichimoku Cloud, Moved Above Upper Price Channel and P&F Double Top Breakout.
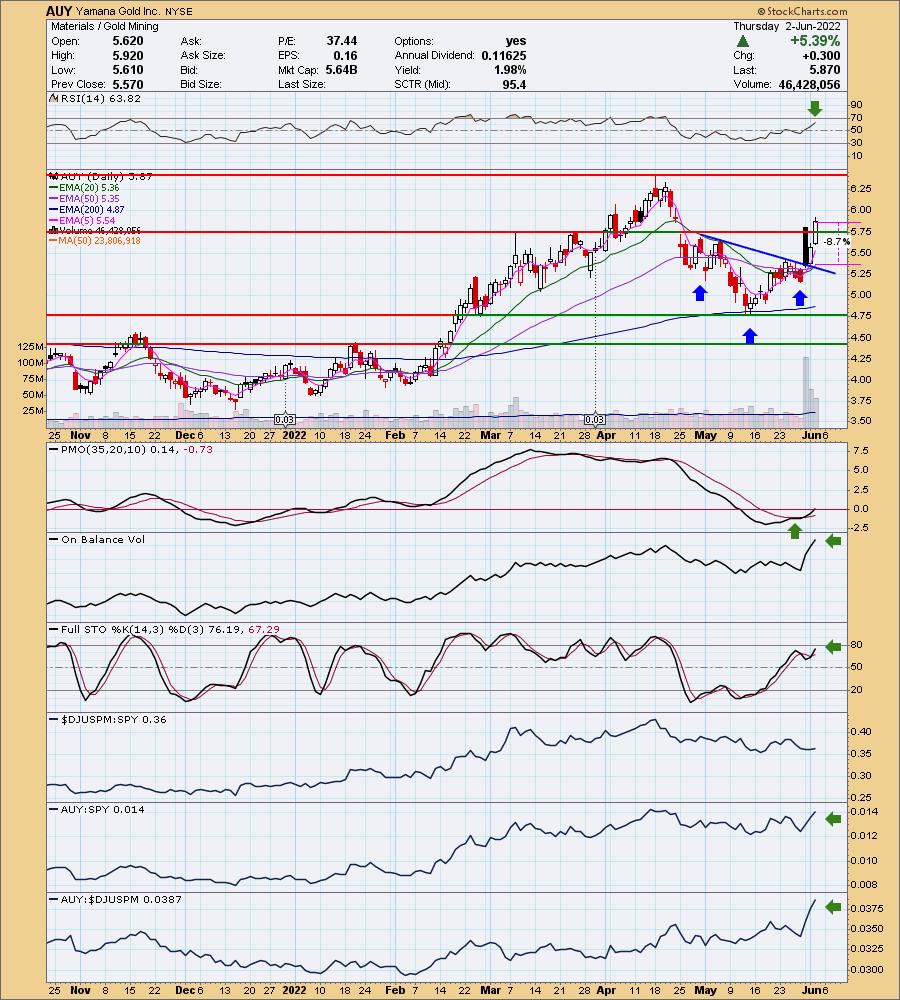
AUY is down -0.17% in after hours trading. I've covered AUY on December 17th 2020 (Position is closed) and January 21st 2022 (Position closed frustratingly so. The stop barely triggered and then AUY was off to the races. Happens to the best of us.). I've been cautious on Gold Miners, but today's pop is changing my mind. AUY is a low priced Gold Miner so expect some volatility here. It formed a rather messy reverse head and shoulders, but Tuesday's bearish filled black candlestick helped it breakout above the neckline. Despite an ugly candlestick, price moved higher yesterday and then broke above resistance today. We have a Silver Cross BUY signal as the 20-day EMA crossed above the 50-day EMA. Volume is coming in big time. The RSI is positive and not overbought. The PMO is on a BUY signal and hit positive territory today. Stochastics are rising after bottoming in positive territory. Relative strength is kicking in for AUY as it is outperforming the industry group. I've set a deep stop that aligns with the 50-day EMA. I set it deeper partly because of today's 5%+ move and because I know this stock is volatile.
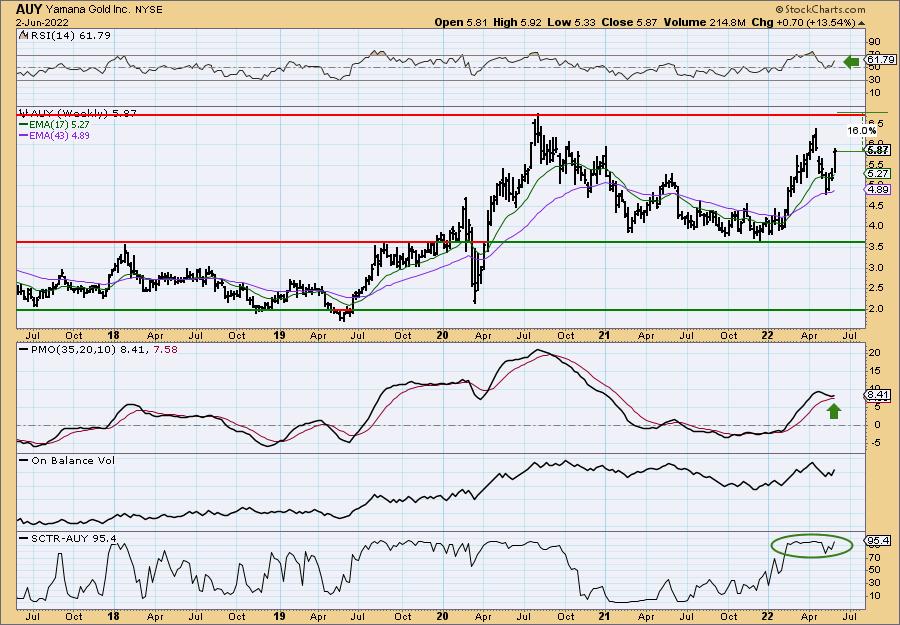
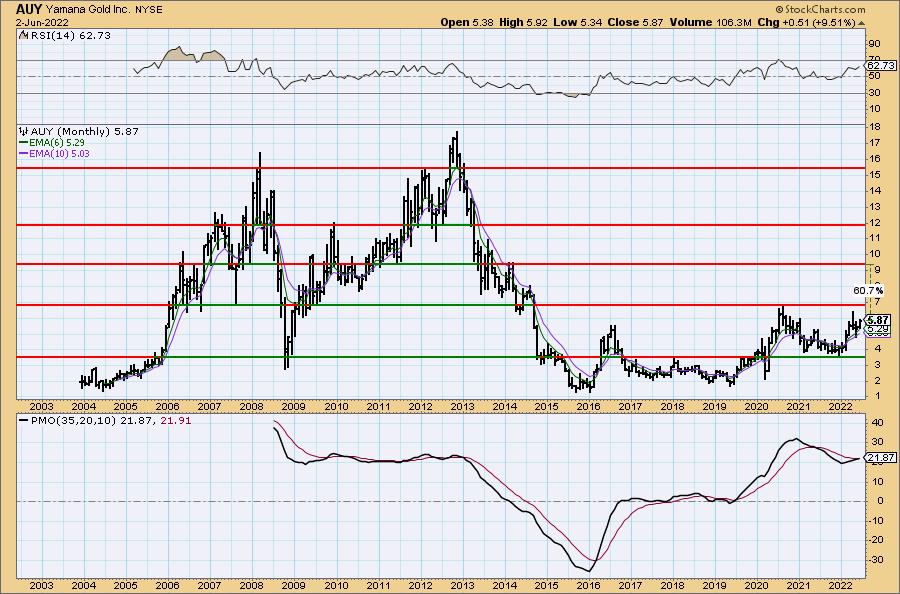
This week's breakout move has turned the weekly PMO up above its signal line which is especially bullish. The weekly RSI stayed positive and the SCTR has resumed its high reading above 90%. I've listed upside potential at the 2020 top, but underneath I've included a monthly chart. This one has seen much higher highs.
ChargePoint Holdings, Inc. (CHPT)
EARNINGS: 9/1/2022 (AMC)
ChargePoint Holdings, Inc. operates as an electric vehicle charging network provider. It designs, develops and markets networked electric vehicle charging system infrastructure and its Cloud Services enable consumers the ability to locate, reserve, authenticate and transact electric vehicle charging sessions. The firm provides an open platform providing real-time information about charging sessions and control, support and management of the networked charging systems. This network provides multiple web-based portals for charging system owners, fleet managers, drivers and utilities. The company was founded in 2007 and is headquartered in Campbell, CA.
Predefined Scans Triggered: Elder Bar Turned Green, Moved Above Upper Bollinger Band and P&F Low Pole.
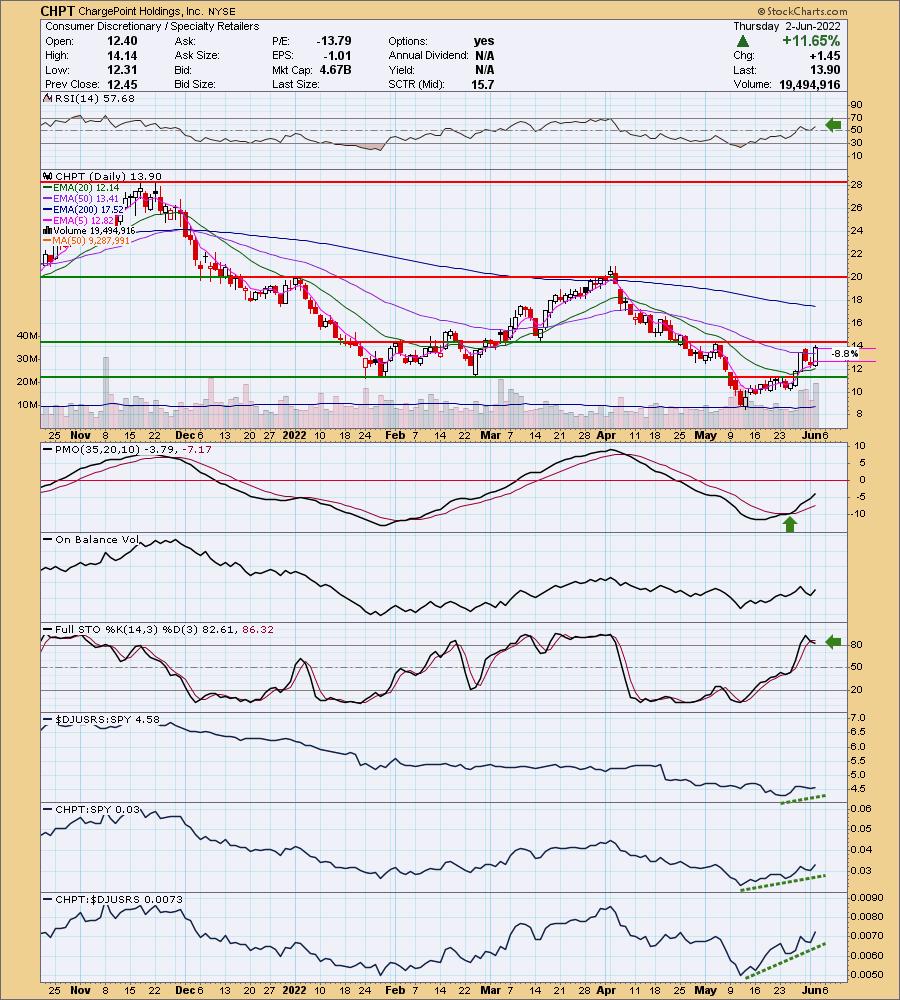
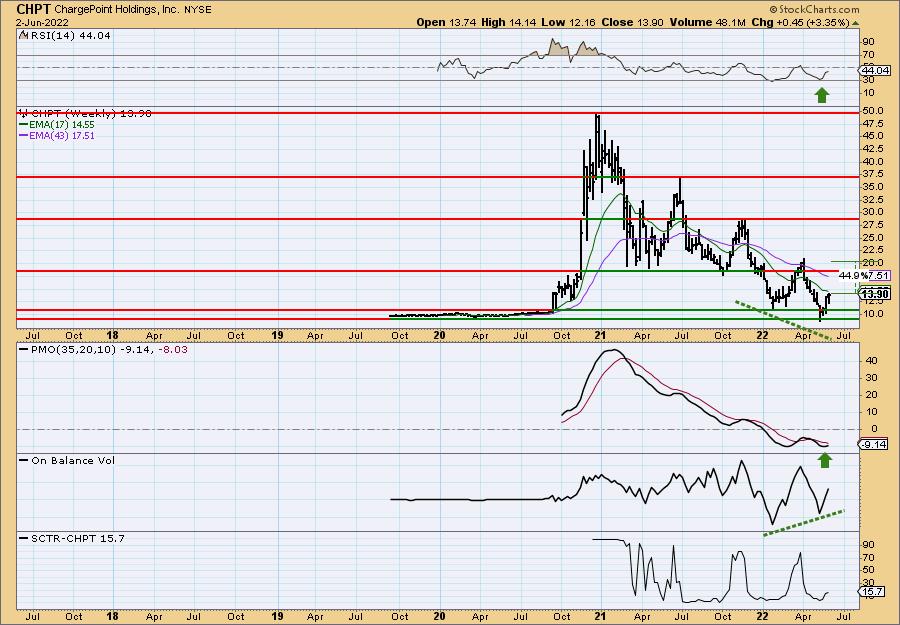
CHPT is down -0.58% in after hours trading. It was up 11.65% today so a pullback tomorrow is likely. This is a play on a strong Consumer Discretionary sector right now. Additionally you'll note in the company's description that they are involved in the EV industry (Toyota is one big car company they are working with). This one may not weather the storm when the bear market rally finishes, so it's one you may want to keep on a watch list.
The chart is very strong and was even before this big gain today. The RSI is positive and rising/not overbought. The PMO is rising out of oversold territory. Note that the PMO on this one is steady with "clean" crossovers, no noise and twitch. The OBV is rising to confirm the uptrend. Stochastics have tipped over, but are comfortably above 80 for now. Relative strength is picking up. Given today's big move, setting a stop is tricky. You'll have a better time of it if the stock pulls back. I would shoot for the 20-day EMA as a stop level.
It is in a clear declining trend in the long term, but it is bouncing off all-time lows and is in the process of setting up a bullish double-bottom. The weekly RSI is negative but based on the location of price near all-time lows it isn't surprising. The weekly PMO is turning back up. The SCTR is dismal, but there is a very nice positive OBV divergence visible. Upside potential if it just reaches the confirmation line of the double-bottom is almost 45%.
Plains All American Pipeline, LP (PAA)
EARNINGS: 8/3/2022 (AMC)
Plains All American Pipeline LP engages in the provision of logistics services and owns midstream energy infrastructure. It operates through the following business segments: Transportation, Facilities, and Supply and Logistics. The Transportation segment includes transporting crude oil and natural gas liquids (NGL) on pipelines, gathering systems, and trucks. The Facilities segment offers storage, terminalling, and throughput services primarily for crude oil and NGL, as well as NGL fractionation and isomerization services and natural gas and condensate processing services. The Supply and Logistics segment is involved in the sale of gathered and bulk-purchased crude oil, as well as the sale of NGL volumes. The company was founded in 1998 and is headquartered in Houston, TX.
Predefined Scans Triggered: None.
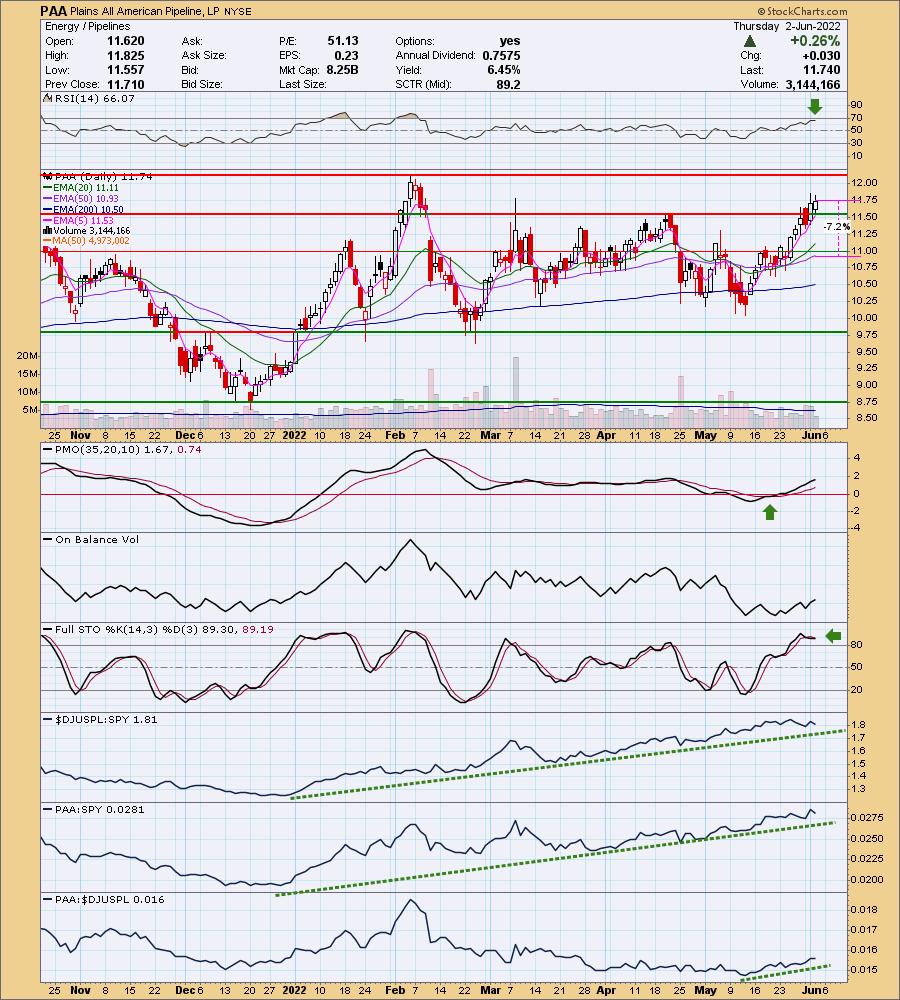
PAA is up +0.34% in after hours trading. I like yesterday's breakout, but not so thrilled overhead resistance is arriving so soon. The indicators are strong so I doubt it will struggle with that resistance, but it is still important to note. The RSI is positive and not overbought. The PMO is on a crossover BUY signal and rising steadily. Stochastics are oscillating above 80 now. Relative strength is excellent and is even picking up for PAA against the group. The stop is set below the 50-day EMA.
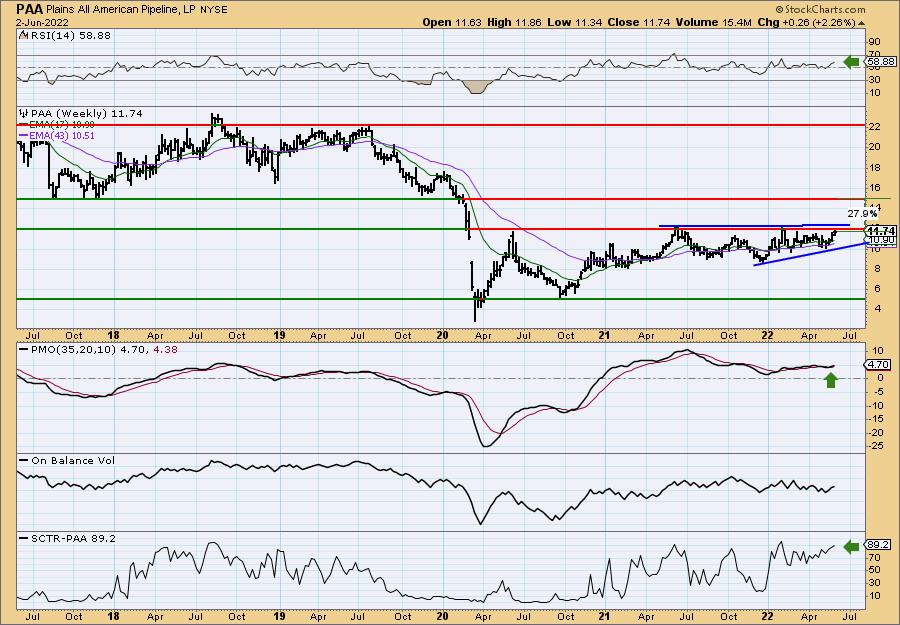
The weekly chart shows a bullish ascending triangle that suggests and upside breakout. The weekly RSI is positive and rising/not overbought. The weekly PMO has just triggered a crossover BUY signal. The SCTR is very good near 90. Upside potential if it reaches the 2017 lows, is nearly 28%.
Targa Resources Corp. (TRGP)
EARNINGS: 8/4/2022 (BMO)
Targa Resources Corp. provides midstream natural gas and natural gas liquids services. It also provides gathering, storing, and terminaling crude oil, and storing, terminaling, and selling refined petroleum products. It operates through the following business segments: Gathering and Processing, and Logistics and Transportation. The Gathering and Processing segment includes assets used in the gathering of natural gas produced from oil and gas wells and processing this raw natural gas into merchantable natural gas by extracting NGLs and removing impurities, and assets used for crude oil gathering and terminaling. The Logistics and Transportation segment includes all the activities necessary to convert mixed NGLs into NGL products and provides certain value-added services such as the storing, fractionating, terminaling, transporting and marketing of NGLs and NGL products, including services to LPG exporters, and the storing and terminaling of refined petroleum products and crude oil and certain natural gas supply and marketing activities in support of its other businesses. The company was founded on October 27, 2005, and is headquartered in Houston, TX.
Predefined Scans Triggered: New CCI Buy Signals, Moved Above Upper Bollinger Band, P&F Ascending Triple Top Breakout and P&F Double Top Breakout.
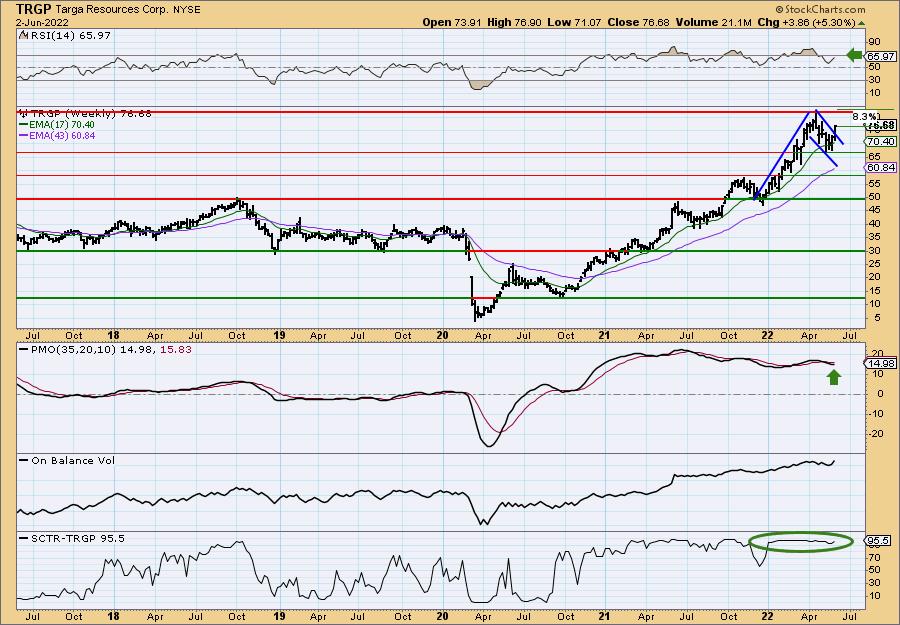
TRGP is down -0.20% in after hours trading. Yesterday the double-bottom formation was confirmed with the breakout. Today saw very nice follow-through. The RSI is positive and not overbought. The PMO is on a new crossover BUY signal and has now moved into positive territory. Stochastics are above 80 and relative strength is excellent for the group and while it hasn't been outperforming the group, it is performing very well against the SPY. The stop is set below the 50-day EMA.
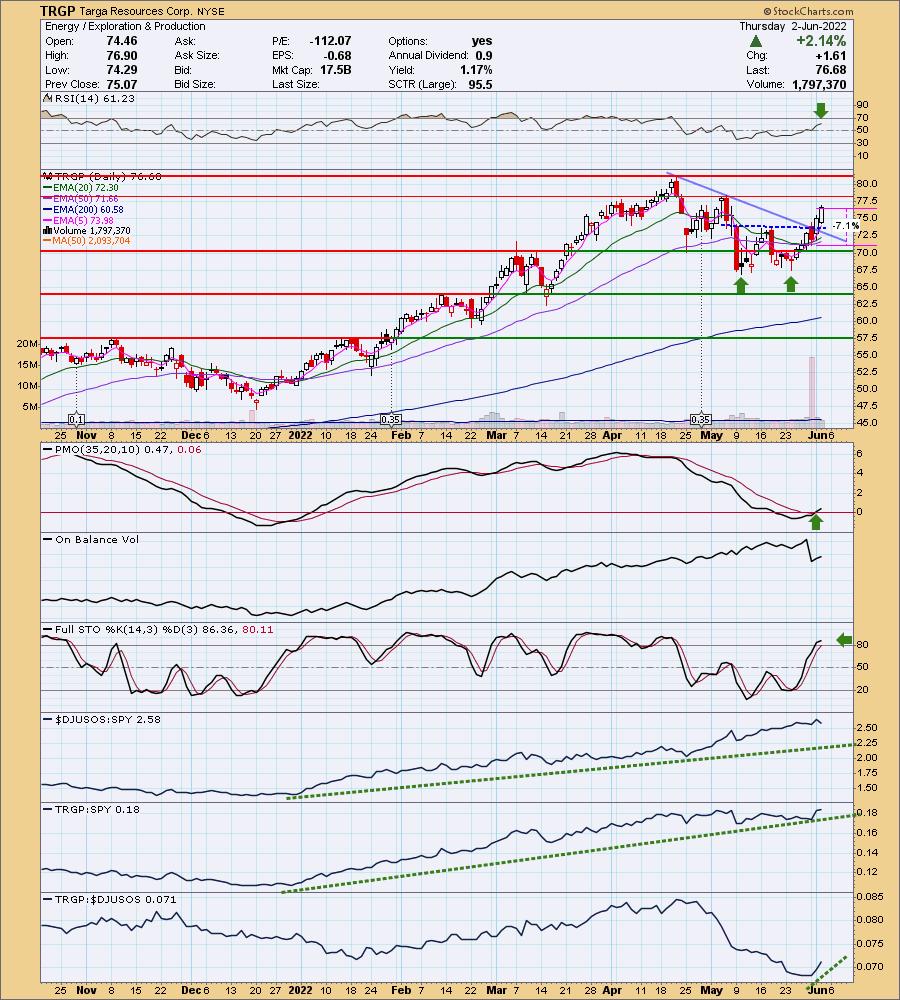
There a bull flag on the weekly chart and price has just broken out of it. The minimum upside target of the pattern is over $110 or about 45%.
Verint Systems, Inc. (VRNT)
EARNINGS: 6/7/2022 (AMC)
Verint Systems, Inc. engages in providing actionable intelligence. It operates through the following segments: Customer Engagement Solutions and Cyber Intelligence Solutions. The Customer Engagement segment includes customer-centric organizations optimize customer engagement, increase customer loyalty, and maximize revenue opportunities, while generating operational efficiencies, reducing cost, and mitigating risk. The Cyber Intelligence Solutions segment addresses the security intelligence market. The company was founded by Daniel Bodner in February 1994 and is headquartered in Melville, NY.
Predefined Scans Triggered: New CCI Buy Signals and Entered Ichimoku Cloud.
VRNT is up +0.61% in after hours trading. Today price broke out and confirmed the bullish double-bottom pattern. The minimum upside target is about $57.50 which would put it at or above overhead resistance at the April top. The RSI just moved into positive territory and the PMO generated a new crossover BUY signal today. Relative strength hasn't been much to write home about but the group is beginning to outperform and that will help VRNT. The stop is set below the 200-day EMA.
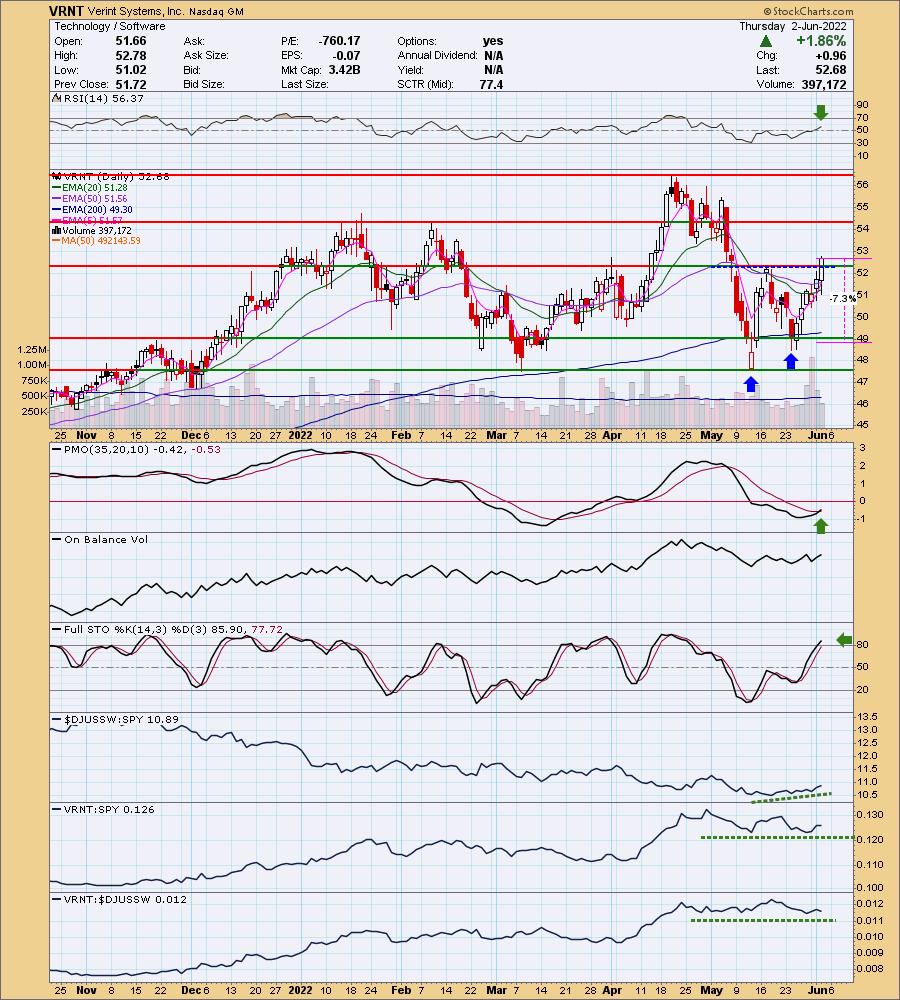
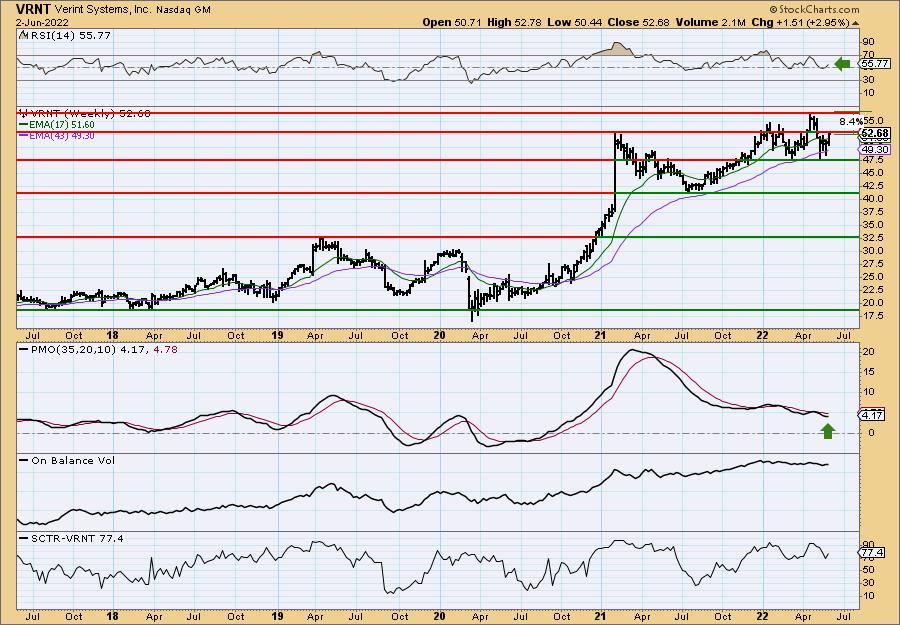
The weekly RSI is positive and rising. The weekly PMO is turning up. The SCTR has remained above my 70% threshold all year and it is now rising again. Since it is near all-time highs, consider an upside target of 15% around $60.58.
Don't forget, on Thursdays I look at reader-requested symbols, click HERE to shoot me an email. I read every email I receive and try to answer them all!
Current Market Outlook:
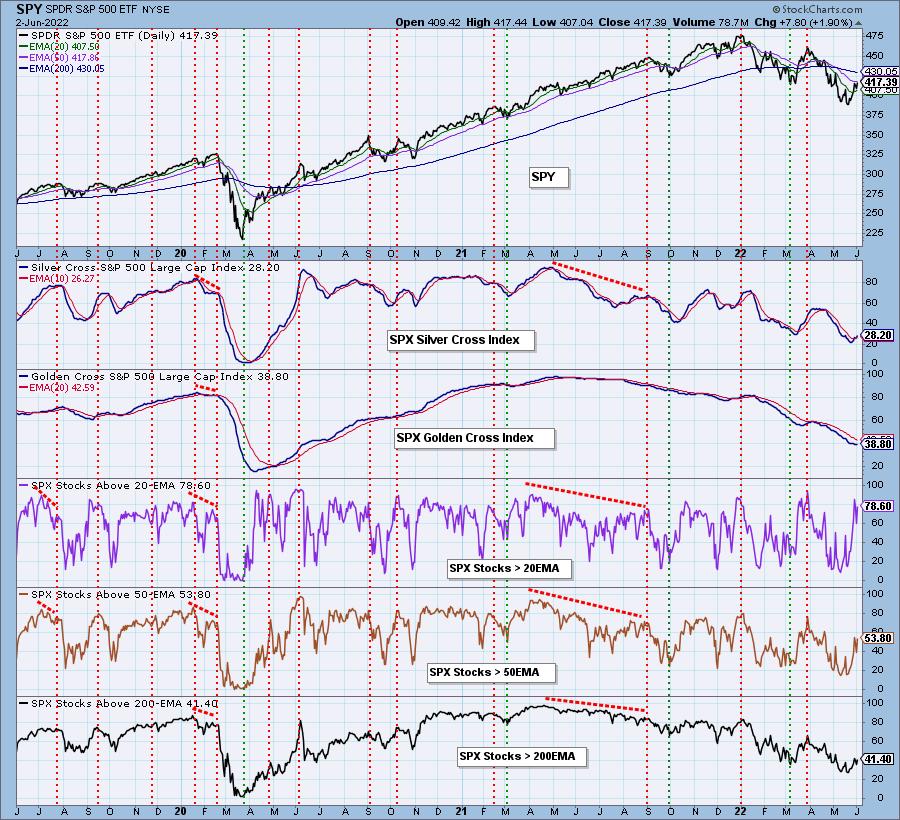
Market Environment: It is important to consider the odds for success by assessing the market tides. The following chart uses different methodologies for objectively showing the depth and trend of participation for intermediate- and long-term time frames.
- The Silver Cross Index (SCI) shows the percentage of SPX stocks on IT Trend Model BUY signals (20-EMA > 50-EMA)
- The Golden Cross Index (GCI) shows the percentage of SPX stocks on LT Trend Model BUY signals (50-EMA > 200-EMA)
Don't forget that as a "Diamonds" member, you have access to our GCI/SCI curated ChartList on DecisionPoint.com. You'll find it under "Members Only" links on the left side on the Blogs and Links Page.
Here is the current chart:
Full Disclosure: I'm 30% exposed. I added yesterday's HOLI and PBF. Afraid I missed the boat on AUY, but I'm watching for a pullback or possible entry tomorrow. We'll see.
I'm required to disclose if I currently own a stock I mention and/or may buy/short it within the next 72 hours.
"Technical Analysis is a windsock, not a crystal ball." - Carl Swenlin
(c) Copyright 2022 DecisionPoint.com
Watch the latest episode of DecisionPoint with Carl & Erin Swenlin on Mondays 7:00p EST or on the DecisionPoint playlist on the StockCharts TV YouTube channel here!
NOTE: The stocks reported herein are from mechanical trading model scans that are based upon moving average relationships, momentum and volume. DecisionPoint analysis is then applied to get five selections from the scans. The selections given should prompt readers to do a chart review using their own analysis process. This letter is not a call for a specific action to buy, sell or short any of the stocks provided. There are NO sure things or guaranteed returns on the daily selection of "Diamonds in the Rough."
Helpful DecisionPoint Links:
DecisionPoint Shared ChartList and DecisionPoint Chart Gallery
Price Momentum Oscillator (PMO)
Swenlin Trading Oscillators (STO-B and STO-V)
For more links, go to DecisionPoint.com