
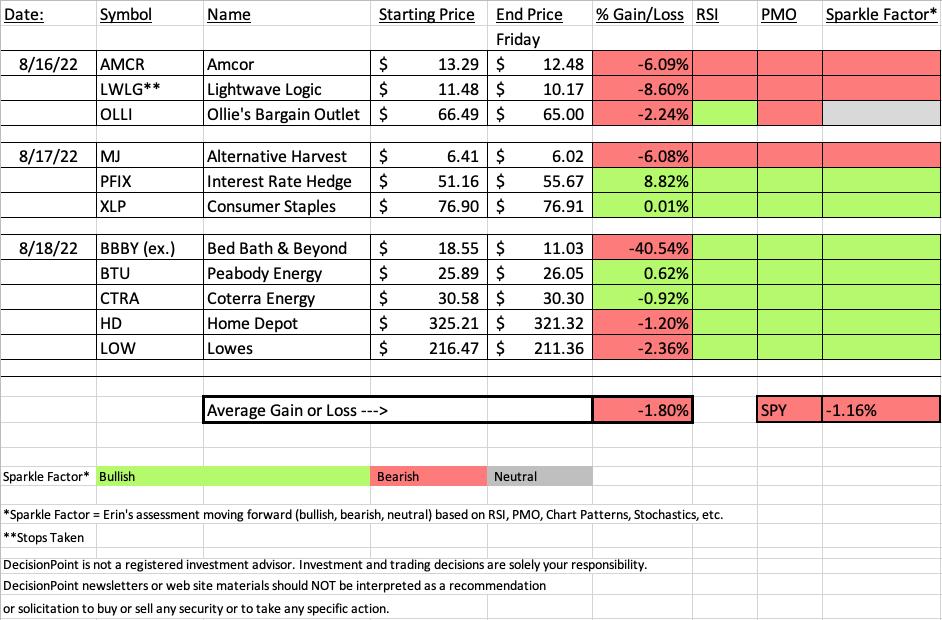
I offered you one Technology "Diamond in the Rough" and it turned out to be this week's Dud. The stop was triggered. The parabolic chart of "meme" stock Bed, Bath & Beyond (BBBY) resolved as expected with a continuation of the deadly drop that began on Wednesday when the parabolic failed. It fell an additional 40%+ today! It's down more than 63% from Wednesday's intraday high.
This week's "Darling" came from ETF Wednesday, the Interest Rate Hedge ETF (PFIX). Yields are on the rise and this is the perfect way to take advantage. I'm stalking it still. Opting not to expand my exposure, but I will likely drop a stock or two so that I can add it safely without expanding my exposure.
The "Sector to Watch" and "Industry Group to Watch" were easy to find this week. It was obvious in the Diamond Mine this morning that Energy is now rebounding and of the groups, Exploration & Production looks excellent going into next week.
The recording link for today's Diamond Mine is below as well as the registration for next Friday's Diamond Mine. Have a great weekend!
Good Luck & Good Trading,
Erin

TODAY'S RECORDING LINK (8/19/2022):
Topic: DecisionPoint Diamond Mine (8/19/2022) LIVE Trading Room
Start Time: Aug 19, 2022 09:00 AM
Meeting Recording Link
Access Passcode: August*19
REGISTRATION For Friday 8/26 Diamond Mine:
When: Aug 26, 2022 09:00 AM Pacific Time (US and Canada)
Topic: DecisionPoint Diamond Mine (8/26/2022) LIVE Trading Room
Register in advance for this webinar HERE
Save the registration confirmation email with login instructions in case Zoom doesn't notify you in time.

We didn't hit record Monday, so here is the link to the August 8th The DecisionPoint Trading Room:
A few items about the spreadsheet: I've put on the spreadsheet whether the RSI is positive (green) or negative (red). The PMO column tells you if it is rising (green) or falling (red). Finally I've added my own "Sparkle Factor" that gives you my assessment going forward, bullish (green), bearish (red) or neutral (gray). The Sparkle Factor is basically my thoughts on whether I expect it to rise or fall. A neutral means it could really go either way so it could be added to a watch list. If you're in a stock I consider "neutral" going forward, the ball is in your court.
Darling:
Simplify Interest Rate Hedge ETF (PFIX)
EARNINGS: 11/9/2022 (AMC)
PFIX is actively managed to provide a hedge against a sharp increase in long-term interest rates. The fund holds OTC interest rate options, US Treasurys, and US Treasury Inflation-Protected Securities (TIPS). For more information, click here.
Predefined Scans Triggered: Elder Bar Turned Green.
Below are Wednesday's Comments and Chart:
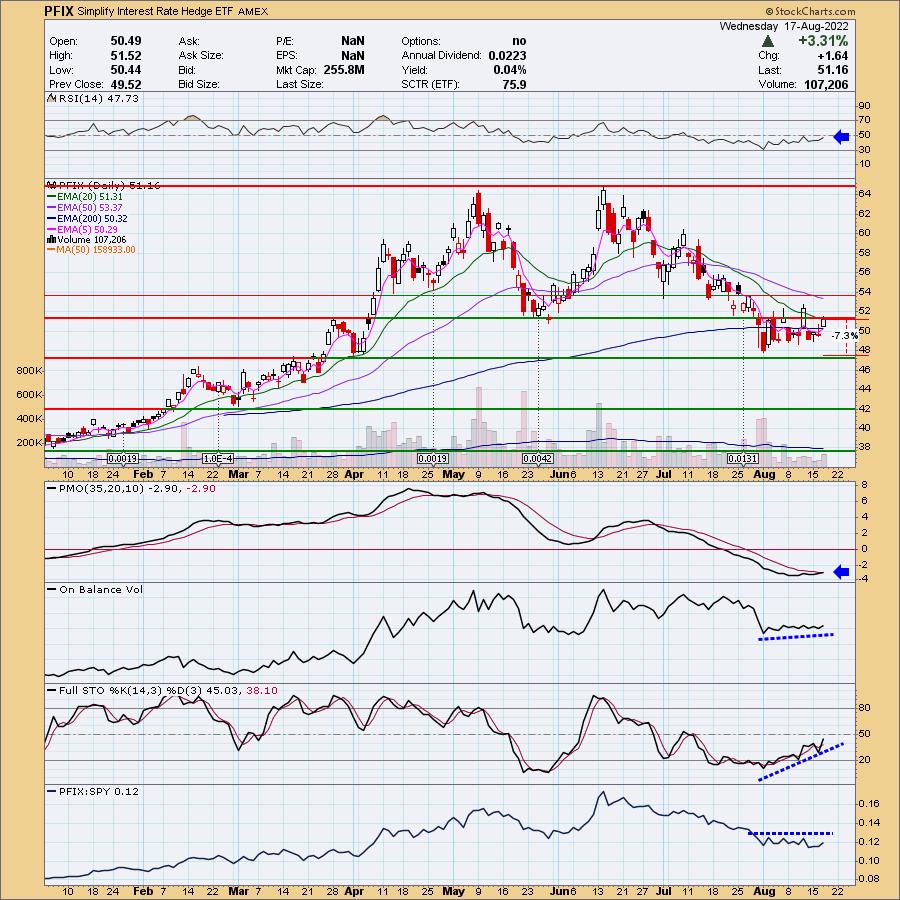
"PFIX is down -0.12% in after hours trading. It appears to me that interest rates are about to rise in a big way based on the technicals of the yield charts and particularly the 10-year Treasury Yield. Price has been consolidating, but the indicators are starting to show promise. The RSI is still negative, but rising somewhat. The PMO is what impressed me. It generated a crossover BUY signal today. The OBV is confirming the mild rising trend and Stochastics are rising toward positive territory. The stop is set at 7.3% or around $47.43."
Here is today's chart:
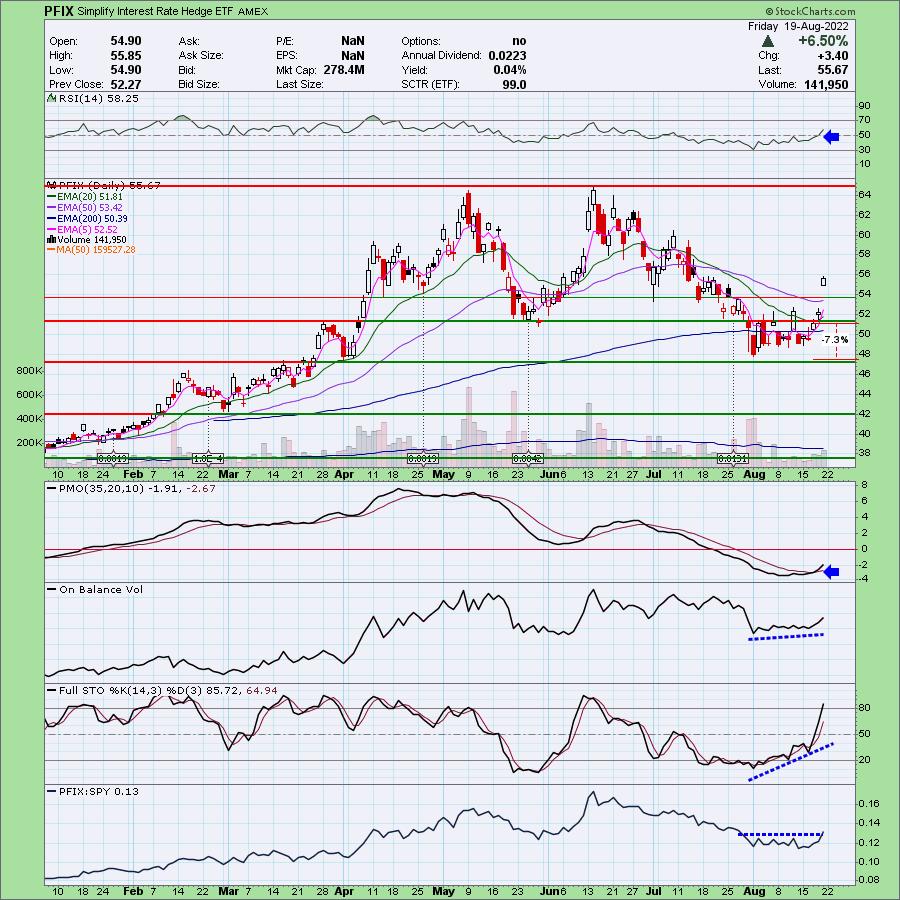
Today's gap up did leave us out in the cold if we didn't get in yesterday. However, I don't think it is too late to enter. Watch on Monday for an optimum entry, I believe it will pull back slightly after today's big gain. The one thing we are vulnerable to is a possible reverse island formation. Unfortunately we can't identify that pattern until it actually happens, but it would imply a gap down on Monday if that is what it is. Or, it could consolidate and then gap down. Overall, the chart is very bullish and with the FOMC raising the Fed rate, I would imagine the others will eventually follow. Technically this chart is extraordinarily bullish.
Don't forget, on Thursdays I look at reader-requested symbols, so shoot me an email at erin@decisionpoint.com. I read every email I receive and try to answer them all!
Dud:
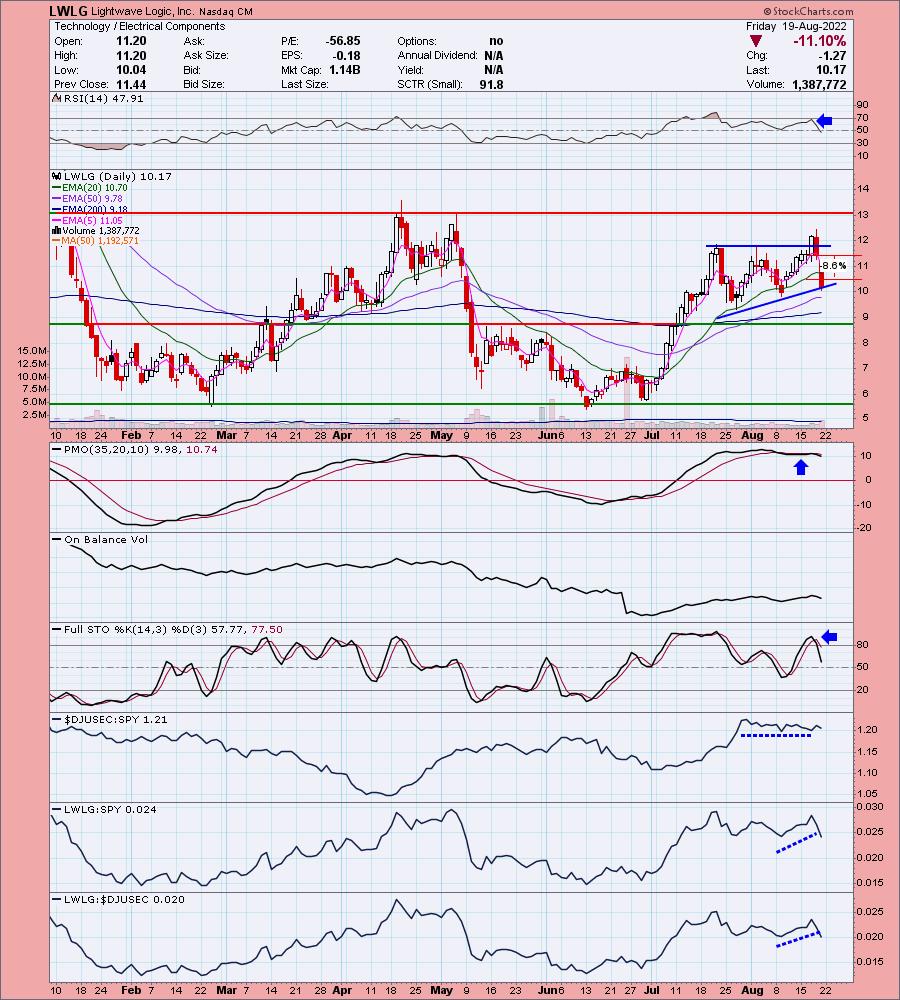
Lightwave Logic, Inc. (LWLG)
EARNINGS: 11/9/2022 (AMC)
Lightwave Logic, Inc. is a development stage company which engages in the commercialization of electro-optic photonic devices. The firm offers the P2ICTM technology platform which uses in-house proprietary organic polymers. Its products include electro-optical modulation devices and proprietary polymer photonic integrated circuits. The company was founded on June 24, 1997 and is headquartered in Englewood, CO.
Predefined Scans Triggered: None.
Below are the comments and chart from Tuesday:
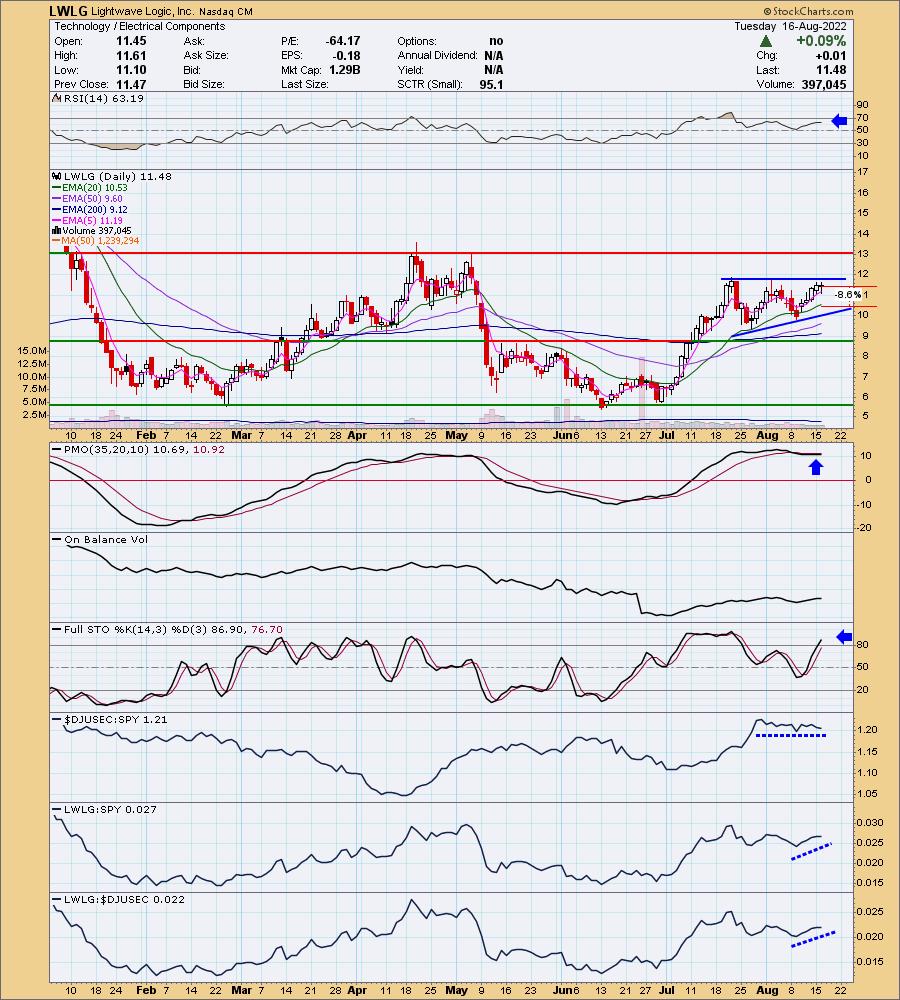
"LWLG is down -1.57% in after hours trading. What excited me about the chart was the clean ascending triangle pattern (flat top, rising bottoms). Today's filled black candlestick and after hours trading suggest this one may decide to go back down and test the bottom of the pattern so you might want to hold off on a purchase. This one has been added to my personal watch list. The RSI is positive and not overbought. The PMO is rising again and is going in on a crossover BUY signal. Stochastics are rising above 80. The group is performing inline with the SPY, but LWLG is outperforming both the group and SPY. Consider stop of 8.6%, below the 20-day EMA around $10.50."
Here is today's chart:
I was feeling pretty good about this pick on Wednesday, but the bottom fell out yesterday with a brutal continuation today that triggered our 8.6% stop. Looking at this with fresh eyes, The PMO was very overbought and the crossover BUY signal was not "clean"; in fact, that last buy signal was hard to even see. It was a bad pick, but our the only real issue with the chart was that overbought PMO. Support is near at the 50-day EMA and it is holding the short-term rising trend (barely). I would've sold this one on this morning's breakdown below the 20-day EMA given its horrendous performance yesterday.
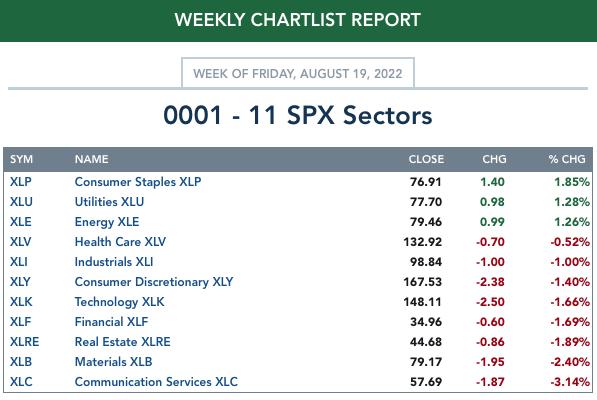
THIS WEEK's Sector Performance:
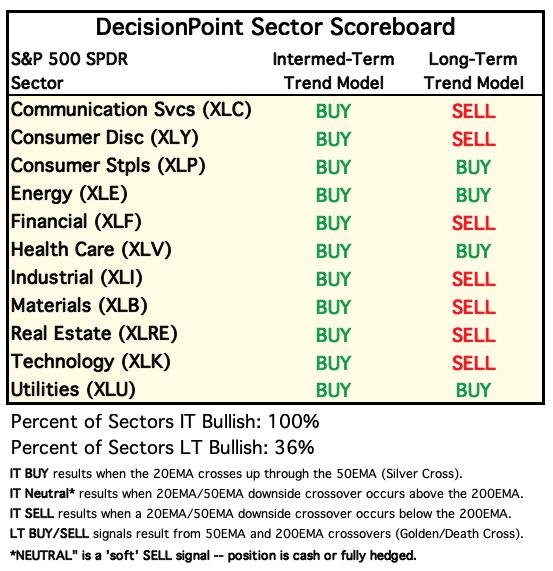
DecisionPoint Sector Scoreboard (Mechanical Trend Model Signals):
Click Here to view Carl's annotated Sector ChartList!
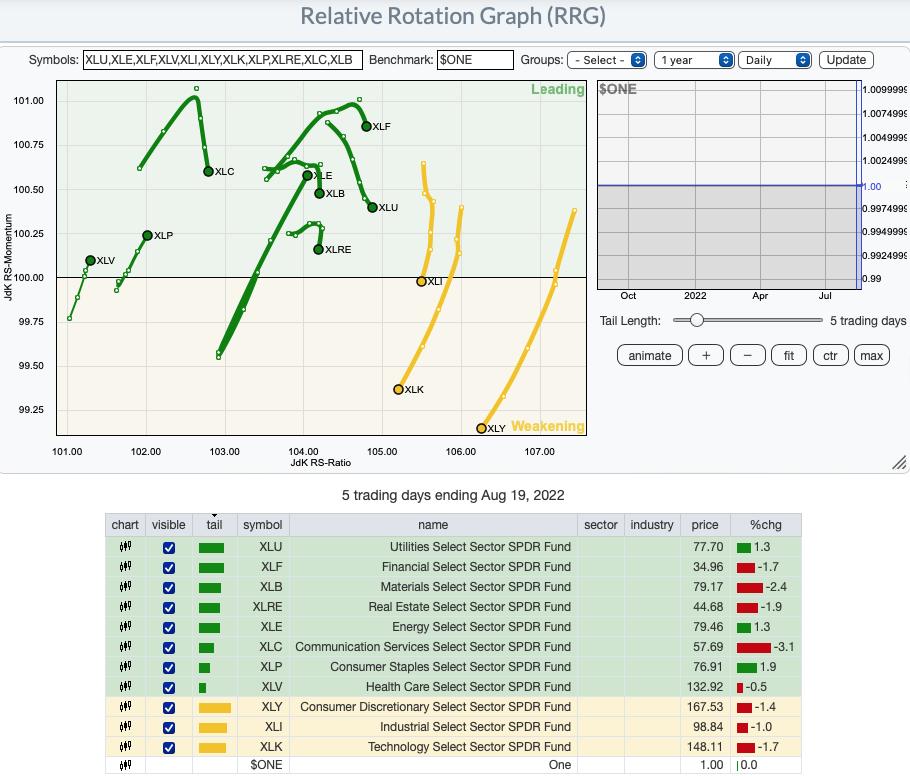
RRG® Daily Chart ($ONE Benchmark):
There is a changing of the guard on the daily RRG. Defensive sectors XLP and XLV are showing new strength and XLE has made an incredible recovery. These three sectors are the only ones with bullish northeast headings.
The aggressive sectors, XLK and XLY have plummeted in performance. XLI isn't far behind as it has now entered the Weakening quadrant to join them.
The remainder, XLC, XLB, XLF, XLU and XLRE, have curled around in the Leading quadrant and are headed for the Weakening quadrant. Overall, next week, we should keep an eye on XLE, XLP and XLV.
RRG® Weekly Chart ($ONE Benchmark):
The weekly RRG shows us that the market is in a strong rising trend in the intermediate term. All sectors with the exception of XLE and XLB have bullish northeast headings and are headed to the Leading quadrant, or in the case of XLU, in the Leading quadrant.
XLE hasn't recuperated on the weekly RRG, but given its rapid improvement on the daily RRG, we would expect it to start at least moving northward as XLB is.
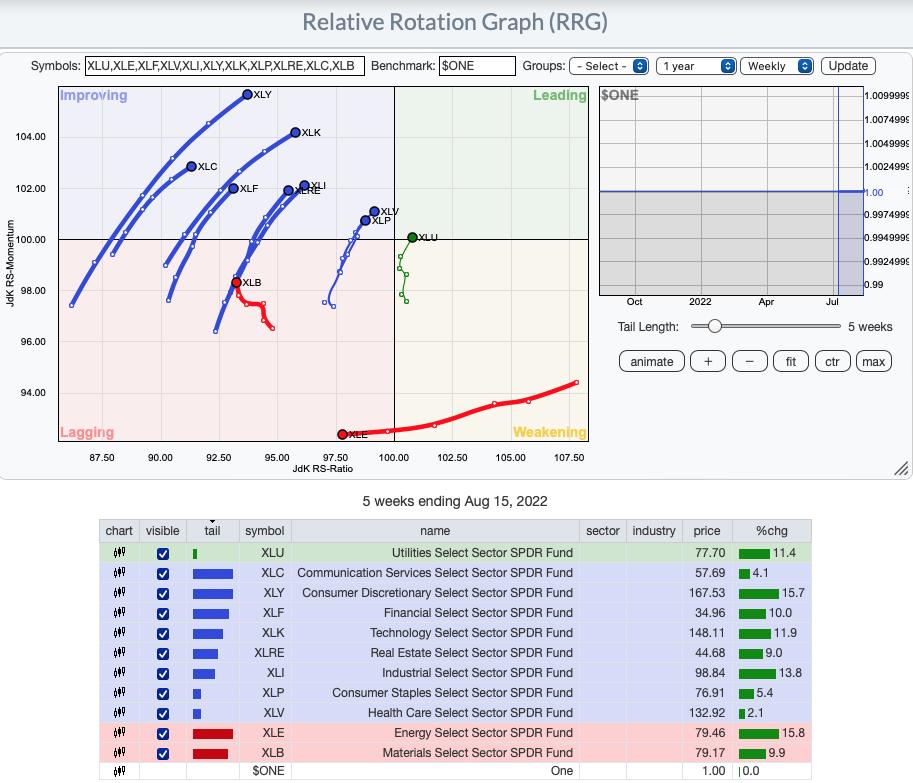
RRG® charts show you the relative strength and momentum for a group of stocks. Stocks with strong relative strength and momentum appear in the green Leading quadrant. As relative momentum fades, they typically move into the yellow Weakening quadrant. If relative strength then fades, they move into the red Lagging quadrant. Finally, when momentum starts to pick up again, they shift into the blue Improving quadrant.
CLICK HERE for an animated version of the RRG charts.
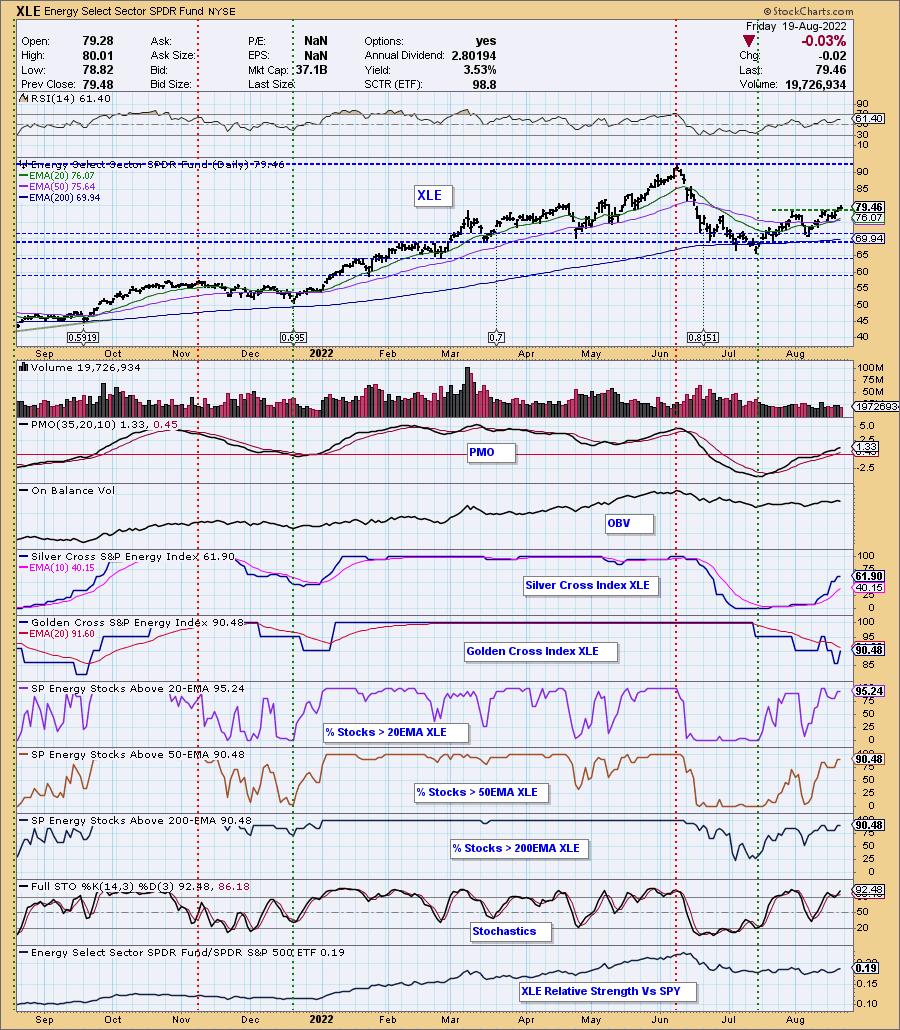
Sector to Watch: Energy (XLE)
It's a bit hard to see, but today XLE broke out above short-term overhead resistance. The sector has built a rising trend and this week saw a "Silver Cross" of the 20/50-day EMAs which triggered an IT Trend Model BUY signal. The RSI is positive and the PMO is rising out of oversold territory. Most importantly participation is staying strong. The Silver Cross Index (SCI) is rising and is at an acceptable 62%. The %Stocks above their 20/50/200-day EMAs are over 90% which suggests a solid foundation and a high likelihood of moving the SCI much higher. Stochastics are strong above 80 and relative strength is beginning to improve.
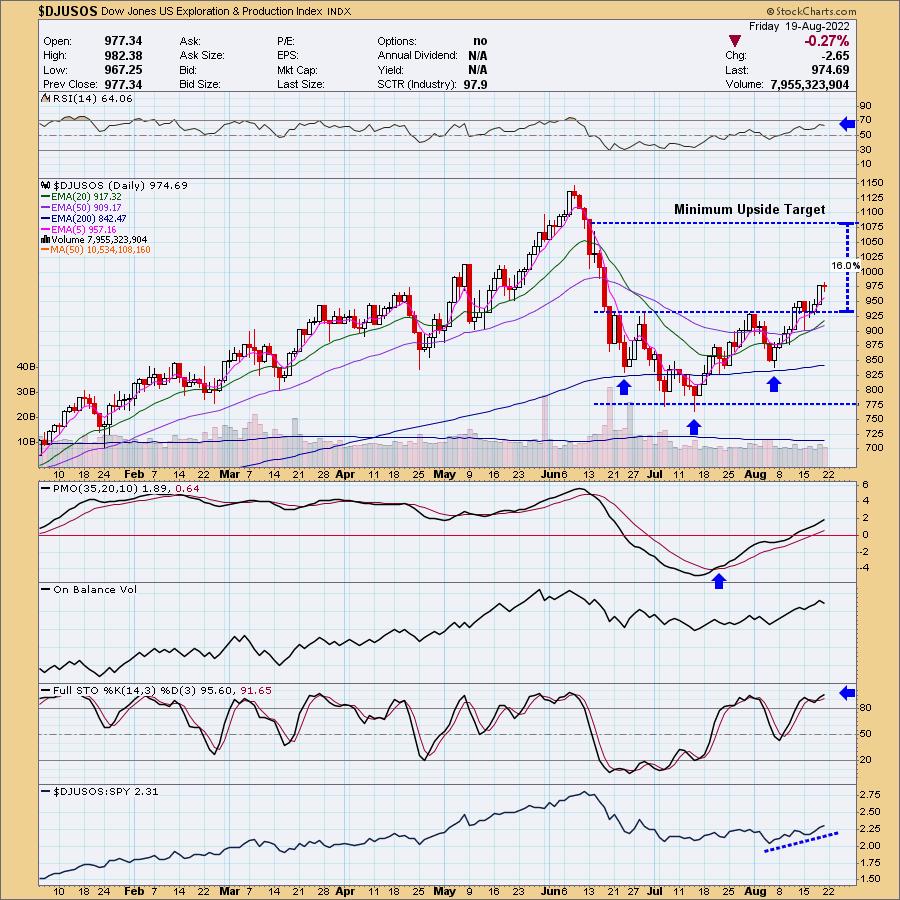
Industry Group to Watch: Exploration & Production ($DJUSOS)
This week a reverse head and shoulders pattern executed with a breakout above the neckline. The minimum upside target isn't quite at overhead resistance. Note it is the "minimum" upside target based on the pattern's confirmation on the breakout. Indicators are strong and not overbought with relative strength continuing to improve.
Go to our Sector ChartList on DecisionPoint.com to get an in-depth view of all the sectors. On StockCharts.com you can find the Industry Summary.
Have a great weekend! Good Luck & Good Trading!
- Erin
erin@decisionpoint.com
Full Disclosure: I'm 60% exposed and plan to add PFIX.
Watch the latest episode of DecisionPoint with Carl & Erin Swenlin on Mondays 7:00p EST or on the DecisionPoint playlist on the StockCharts TV YouTube channel here!
Technical Analysis is a windsock, not a crystal ball. --Carl Swenlin
NOTE: The stocks reported herein are from mechanical trading model scans that are based upon moving average relationships, momentum and volume. DecisionPoint analysis is then applied to get five selections from the scans. The selections given should prompt readers to do a chart review using their own analysis process. This letter is not a call for a specific action to buy, sell or short any of the stocks provided. There are NO sure things or guaranteed returns on the daily selection of "diamonds in the rough."
Helpful DecisionPoint Links:
DecisionPoint Shared ChartList and DecisionPoint Chart Gallery
Price Momentum Oscillator (PMO)
Swenlin Trading Oscillators (STO-B and STO-V)
(c) Copyright 2022 DecisionPoint.com