
I have to wonder what I will do when I actually see numerous ETFs with rising momentum. Currently there aren't many unless they are inverses. Therefore, today I pulled out some inverse ETFs for your review. Many ETFs are juiced (2x or 3x) so keep that in mind. I only included one. If you have a risk appetite, there's no reason you couldn't consider a juiced ETF, but my recommendation would be to consider how much you plan on buying and then buy 1/2 or 1/3 depending on the level of juice.
I've listed the ETFs that made my first cut in the runners-up.
I will have to cancel the Diamond Mine on 10/7. I'll be up in Seattle for ChartCon 2022 and I highly doubt I will be free enough to pull it off. I will put together the Recap that day, but I won't be able to do the trading room. I highly recommend you attend ChartCon this year. It is completely virtual and is set up to be entertaining as well as educational. For example, Tom Bowley (my partner for over 2 years on MarketWatchers LIVE) and I will be have a bull/bear debate on the SP500! I imagine you know who the bull will be and who will be the bear. Key note speakers are Larry Williams and Linda Raschke. Click here for more information.
Good Luck & Good Trading!
Erin
Today's "Diamonds in the Rough": EFZ, EPV and PSQ.
"Runners-up": GDX, PALL, WEAT, PSLV, BNDD, BERZ, EDZ, LABD and RWM.

RECORDING LINK (9/16/2022):
Topic: DecisionPoint Diamond Mine (9/16/2022) LIVE Trading Room
Start Time: Sept 16, 2022 09:00 AM
Recording LINK.
Passcode: Sept*16th
REGISTRATION For Friday 9/23 Diamond Mine:
When: Sep 23, 2022 09:00 AM Pacific Time (US and Canada)
Topic: DecisionPoint Diamond Mine (9/23/2022) LIVE Trading Room
Register in advance for this webinar HERE.
NO DIAMOND MINE ON 10/7***
Save the registration confirmation email with login instructions in case Zoom doesn't notify you in time.

Here is the Monday 9/12 recording:
Welcome to DecisionPoint Diamonds, wherein I highlight ten "Diamonds in the Rough" per week. These are selected from the results of my DecisionPoint Scans, which search for stocks that could benefit from the trend and condition of the market. Remember, these are not recommendations to buy or sell, but are the most interesting of the stocks that surfaced in my scans. My objective is to save you the work of the initial, tedious culling process, but you need to apply your own analysis to see if these stocks pique your interest as well. There are no guaranteed winners here!
"Predefined Scans Triggered" are taken from StockCharts.com using the "Symbol Summary" option instead of a "SharpChart" on the workbench.
ProShares Short MSCI EAFE (EFZ)
EARNINGS: N/A
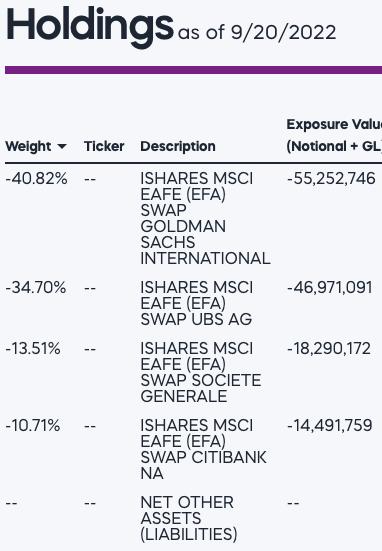
EFZ provides daily inverse exposure to a market-cap-weighted index representing 85% of the market capitalization in developed markets excluding North America. Click HERE for more information.
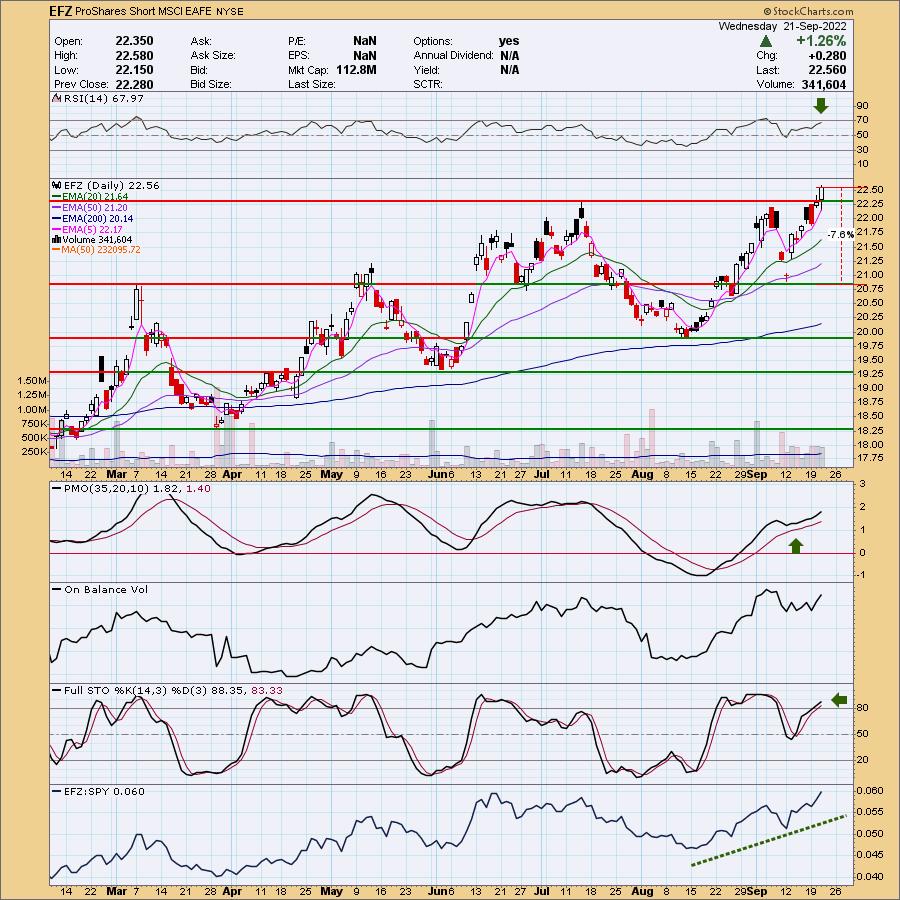
Predefined Scans Triggered: Moved Above Upper Keltner Channel, New 52-week Highs and P&F Double Top Breakout.
EFZ is up +0.49% in after hours trading. Excellent breakout today. The RSI is positive and not overbought. The PMO has bottomed above its signal line and is accelerating higher. The OBV is a little suspect since this breakout wasn't accompanied by a new high for the OBV. Stochastics are above 80 and rising. It's no surprise that it is outperforming this sagging market. The stop can be set beneath support at about 7.6% or $20.85.
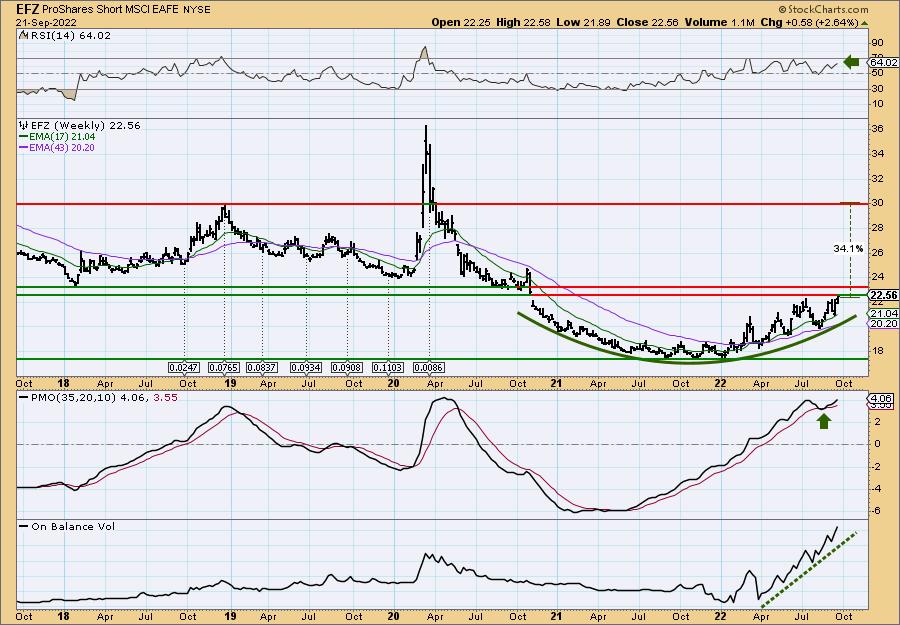
Very nice basing pattern on the weekly chart. It is up against a strong resistance zone, but indicators are favorable with the RSI positive and the PMO whipsawing back into a BUY signal. The OBV looks good as far as volume coming in, but it is a huge reverse divergence. All of that volume and then little price movement. I expect this is less important when talking about an inverse ETF. Right now it shows us how bearish people are. If we get the breakout on this chart, look for price to possibly rise over 34%.
ProShares UltraShort FTSE Europe (EPV)
EARNINGS: N/A
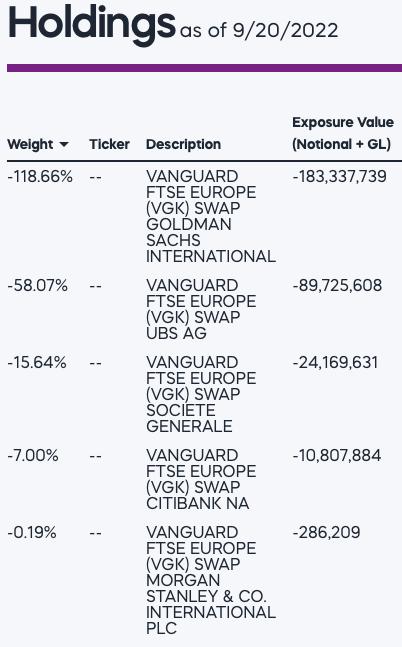
EPV provides a daily leveraged inverse (-2x) exposure to a market-cap-weighted index of European developed markets equities. For more information click HERE.
Predefined Scans Triggered: Moved Above Upper Keltner Channel, New 52-week Highs, Moved Above Upper Bollinger Band and P&F Double Top Breakout.
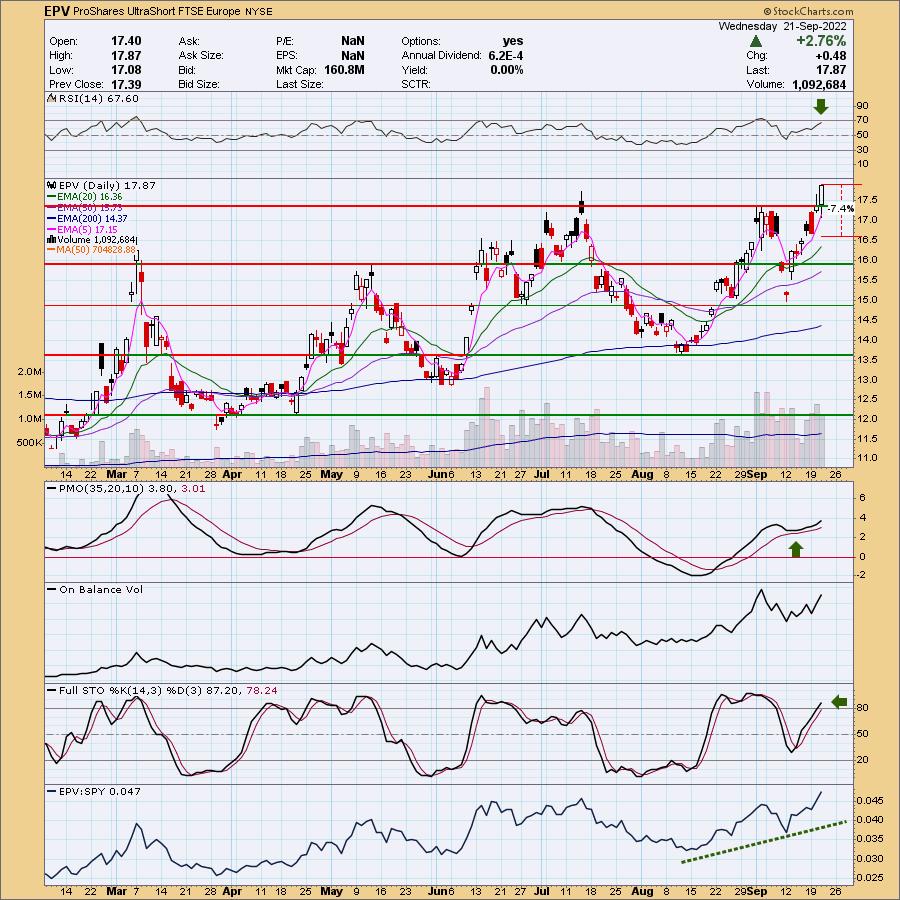
EPV is up +1.45% in after hours trading. This is a 2x juiced ETF so consider half of what you would normally buy if you don't want too much risk exposure. The breakout looks fantastic. It even closed on its high for the day. The RSI is positive and not overbought and the PMO has bottomed above its signal line and is also not overbought. The OBV should've made a new high, but as I said above, I don't think volume is as important for these ETFs. Stochastics just moved above 80 and it is of course outperforming the market. The stop is set at around 7.4% or $16.55.
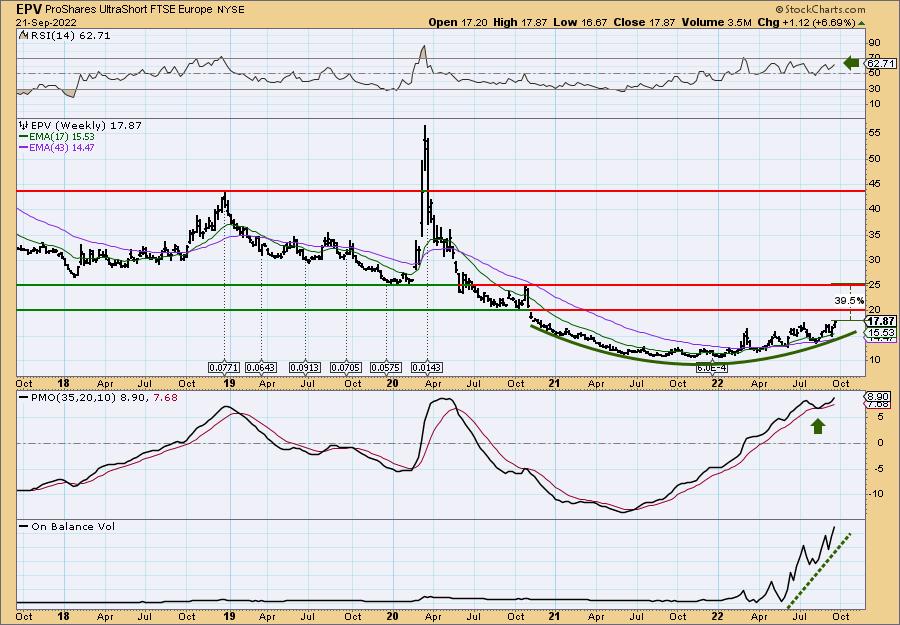
This weekly chart also shows a beautiful basing pattern. The weekly PMO has bottomed just above the signal line and volume is coming in overall. The weekly RSI is positive. If it can just reach that first support line it would be a 13% gain, but if it overcomes that resistance, we could be looking at upside potential of 39.5%.
ProShares Short QQQ (PSQ)
EARNINGS: N/A
PSQ provides inverse exposure to a modified market-cap-weighted index of 100 of the largest non-financial firms listed on NASDAQ. For more information click HERE.
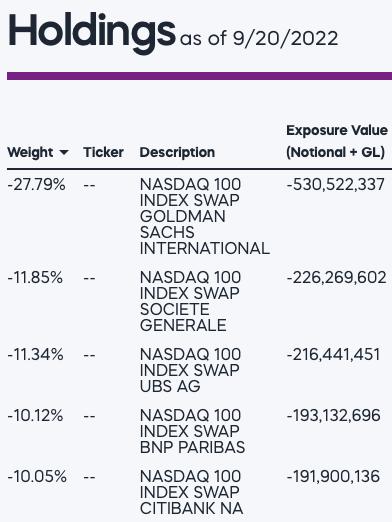
Predefined Scans Triggered: Elder Bar Turned Green and Moved Above Upper Price Channel.
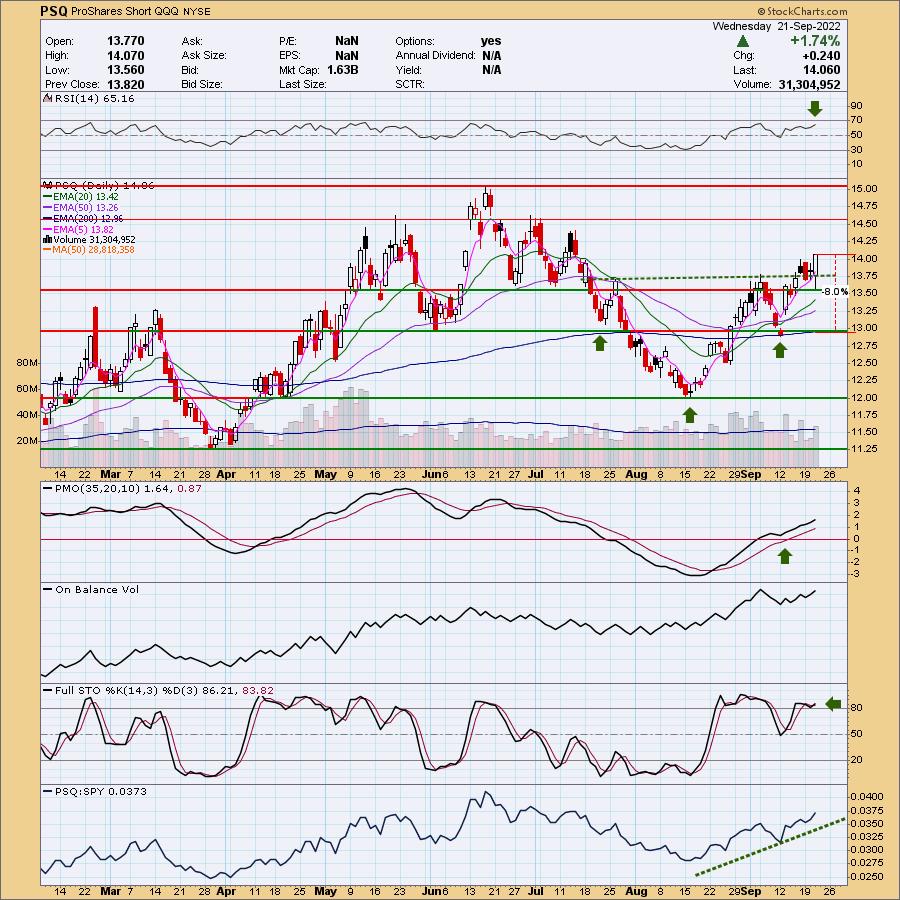
PSQ is up +0.85% in after hours trading. I love this chart and it makes sense since the QQQ is in the tank and likely to move much lower. This one is on my radar as a great hedge. It isn't juiced so if you want that, there are plenty of ETFs for you. We have a reverse head and shoulder that was confirmed with a strong move higher today. The upside target of the pattern would take it above resistance to $15.50. The RSI is positive and not overbought. The PMO bottomed above its signal line earlier this month. The OBV looks good enough. Stochastics are oscillating above 80 and of course, it is seeing giant outperformance. The stop is set below the 200-day EMA around 8% or $12.94.
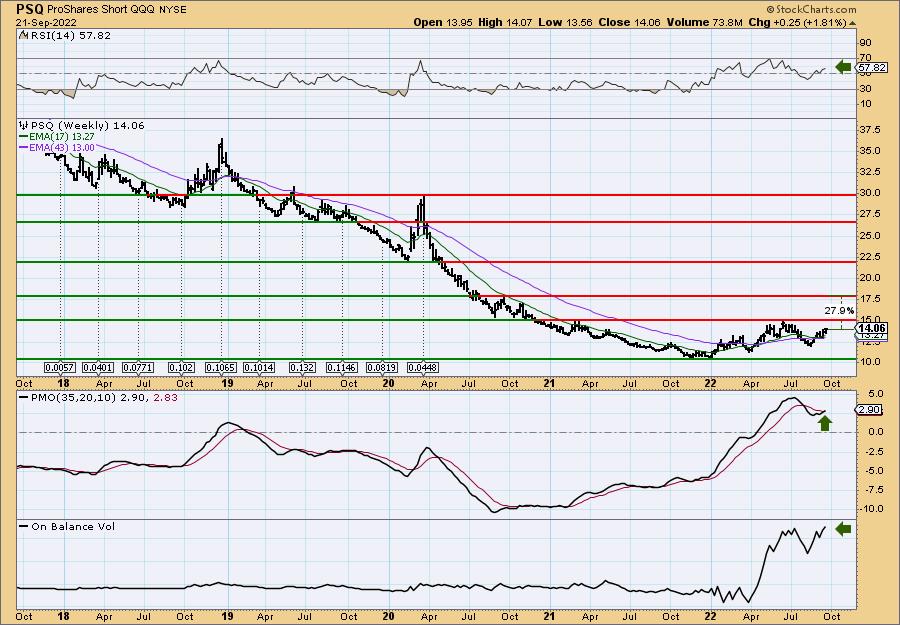
It looks like a possible cup with handle pattern on the weekly chart which is bullish. The weekly RSI is positive and rising and the weekly PMO is in the process of logging a crossover BUY signal on Friday. If resistance can be overcome, I would look for a move to the July high.
Don't forget, on Thursdays I look at reader-requested symbols, click HERE to send me an email. I read every email I receive and try to answer them all!
Current Market Outlook:
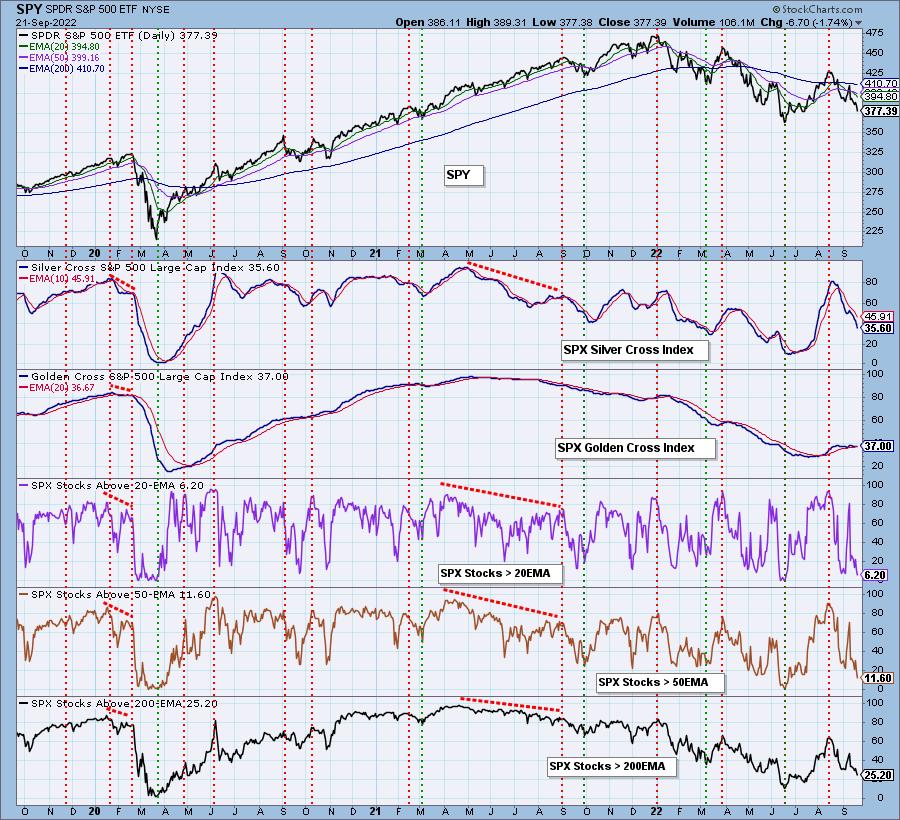
Market Environment: It is important to consider the odds for success by assessing the market tides. The following chart uses different methodologies for objectively showing the depth and trend of participation for intermediate- and long-term time frames.
- The Silver Cross Index (SCI) shows the percentage of SPX stocks on IT Trend Model BUY signals (20-EMA > 50-EMA)
- The Golden Cross Index (GCI) shows the percentage of SPX stocks on LT Trend Model BUY signals (50-EMA > 200-EMA)
Don't forget that as a "Diamonds" member, you have access to our GCI/SCI curated ChartList on DecisionPoint.com. You'll find it under "Members Only" links on the left side on the Blogs and Links Page.
Here is the current chart:
Full Disclosure: I am 20% exposed.
I'm required to disclose if I currently own a stock I mention and/or may buy/short it within the next 72 hours.
"Technical Analysis is a windsock, not a crystal ball." - Carl Swenlin
(c) Copyright 2022 DecisionPoint.com
Watch the latest episode of DecisionPoint with Carl & Erin Swenlin on Mondays 7:00p EST or on the DecisionPoint playlist on the StockCharts TV YouTube channel here!
NOTE: The stocks reported herein are from mechanical trading model scans that are based upon moving average relationships, momentum and volume. DecisionPoint analysis is then applied to get five selections from the scans. The selections given should prompt readers to do a chart review using their own analysis process. This letter is not a call for a specific action to buy, sell or short any of the stocks provided. There are NO sure things or guaranteed returns on the daily selection of "Diamonds in the Rough."
Regarding BUY/SELL Signals: The signal status reported herein is based upon mechanical trading model signals and crossovers. They define the implied bias of the price index/stock based upon moving average relationships and momentum, but they do not necessarily call for a specific action. They are information flags that should prompt chart review. Further, they do not call for continuous buying or selling during the life of the signal. For example, a BUY signal will probably (but not necessarily) return the best results if action is taken soon after the signal is generated. Additional opportunities for buying may be found as price zigzags higher, but the trader must look for optimum entry points. Conversely, exit points to preserve gains (or minimize losses) may be evident before the model mechanically closes the signal.
Helpful DecisionPoint Links:
DecisionPoint Shared ChartList and DecisionPoint Chart Gallery
Price Momentum Oscillator (PMO)
Swenlin Trading Oscillators (STO-B and STO-V)
For more links, go to DecisionPoint.com