
The market rallied strongly (finally!) and brought some new candidates on the bullish side rather than on the inverse side. Inverse ETFs still show rising momentum, but in the short term aren't likely to pay off. I still like to hold an inverse or other hedge in this market, but just watch them carefully for any major deterioration.
ETF Day has turned out to be an excellent addition to DP Diamonds reports. With a smaller universe, it has helped my prep time, but it has also given me a great opportunity to simply see how the market is doing under the surface and find pockets of strength. Interestingly, a reader asked me to look at a few ETFs for today rather than Reader Request Day. His line of thinking was right there with mine as I like Healthcare (XLV) (not covered today) and Biotechs (IBB). I also added Wheat (WEAT) given its nice basing pattern and new Silver Cross BUY signals.
Gold Miners (GDX) took off finally and deserves at least a look. I'm not adding to my exposure, but this is an area I have under a microscope right now.
Please be careful. I'm presenting a few that are only looking good based on today's action. I believe we have another week or so of upside coming, but risk levels are high across the board.
Good Luck & Good Trading!
Erin
Today's "Diamonds in the Rough": GDX, IBB and WEAT.
ETFs to Review: XLV, TAN, PSCE and CLTL.

RECORDING LINK (9/23/2022):
Topic: DecisionPoint Diamond Mine (9/23/2022) LIVE Trading Room
Start Time: Sept 23, 2022 09:00 AM
Passcode: Sept*23rd
REGISTRATION For Friday 9/30 Diamond Mine:
When: Sep 30, 2022 09:00 AM Pacific Time (US and Canada)
Topic: DecisionPoint Diamond Mine (9/30/2022) LIVE Trading Room
Register in advance for this webinar HERE
Save the registration confirmation email with login instructions in case Zoom doesn't notify you in time.
*** NO DIAMOND MINE ON 10/7 ***
I will be at ChartCon 2022 on Friday and unable to hold the trading room. I'm planning on doing the Recap, but that is tentative. You will receive your ten picks for the week including ETF Day and Reader Request Day.
I'll be running trading rooms with Dave Landry so you might want to sign up to attend ChartCon 2022! I'll also be debating my friend, Tom Bowley point/counterpoint style bear v. bull! The event will not be like it was in the past. It is more of a television production with entertaining segments that will make education fun! Here is the link.

Here is last Monday's recording:
Welcome to DecisionPoint Diamonds, wherein I highlight ten "Diamonds in the Rough" per week. These are selected from the results of my DecisionPoint Scans, which search for stocks that could benefit from the trend and condition of the market. Remember, these are not recommendations to buy or sell, but are the most interesting of the stocks that surfaced in my scans. My objective is to save you the work of the initial, tedious culling process, but you need to apply your own analysis to see if these stocks pique your interest as well. There are no guaranteed winners here!
"Predefined Scans Triggered" are taken from StockCharts.com using the "Symbol Summary" option instead of a "SharpChart" on the workbench.
VanEck Vectors Gold Miners ETF (GDX)
EARNINGS: N/A
GDX tracks a market-cap-weighted index of global gold-mining firms. For more information click HERE.
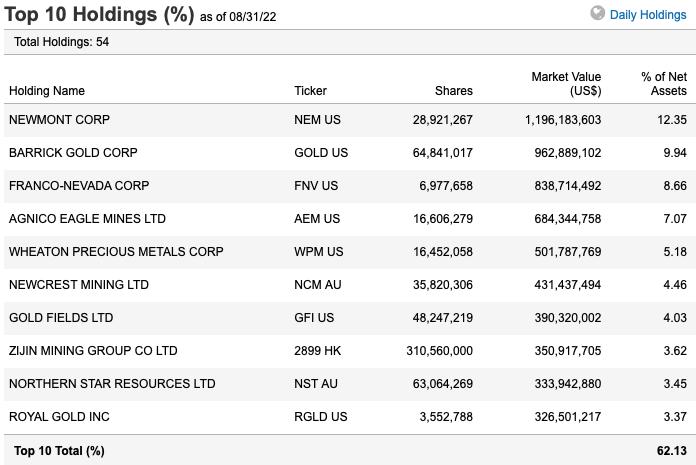
Predefined Scans Triggered: Elder Bar Turned Green and P&F Double Bottom Breakout.
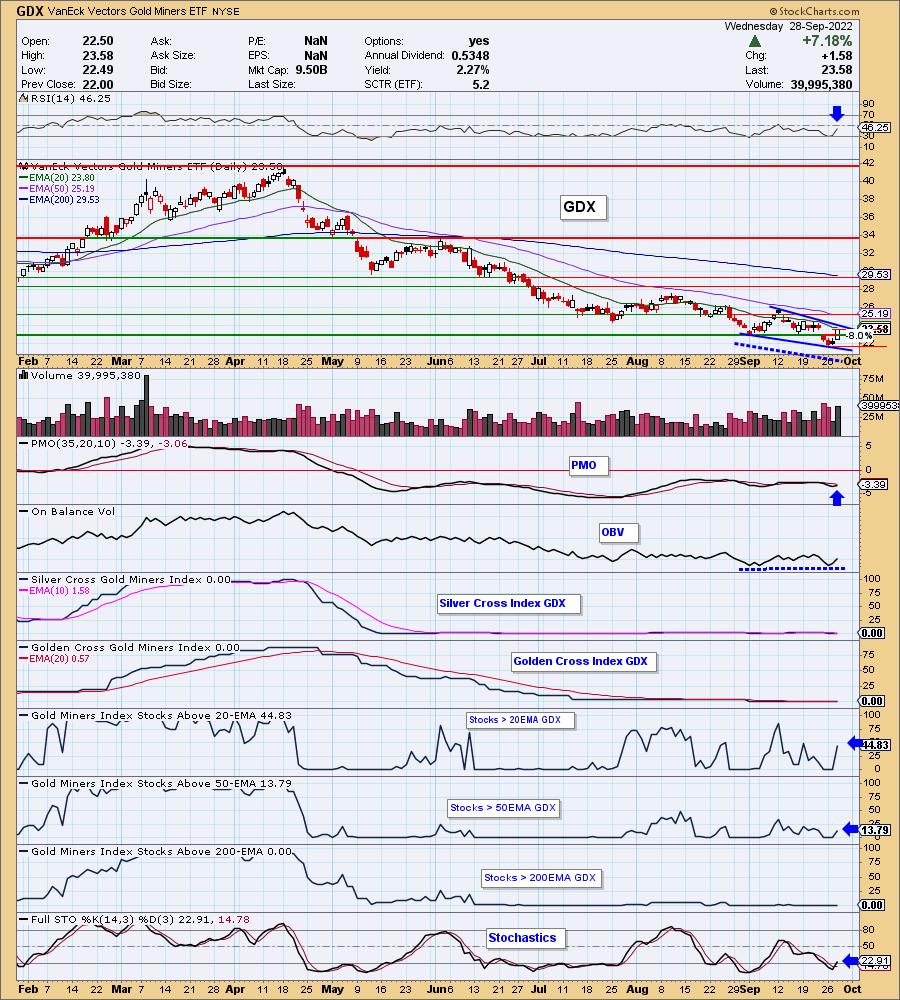
GDX is down -0.13% in after hours trading. After today's strong move it is highly likely it will stall tomorrow, but this one is definitely on my short-term radar. We have the luxury of using our under the hood indicators on GDX as we do track it for this particular industry group. The RSI is rising out of oversold territory. The PMO has turned up. There is an OBV positive divergence alongside a bullish falling wedge. Participation isn't great, but there is a big improvement on %Stocks > 20-day EMA and we even saw a few more above their 50-day EMA. Stochastics are rising and hopefully relative performance will pick back up. Be careful here, I know I've been fooled three times on new rallies in Miners. The stop is set at 8% around $21.69.
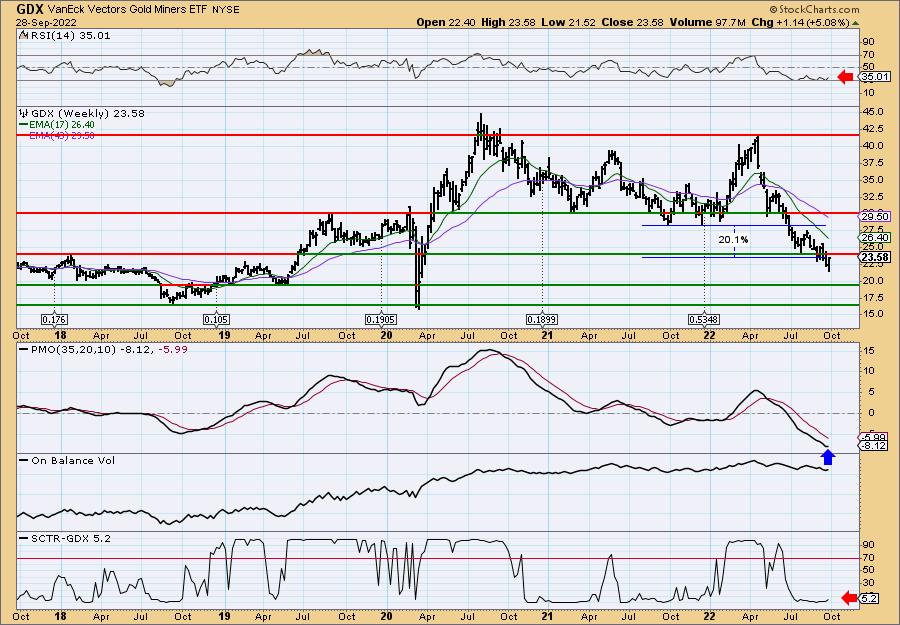
GDX broke important support last week so we'll want to see that overcome soon. The weekly RSI is still in the tank, but the PMO did decelerate and could turn back up before the end of the week. Upside potential is conservatively set at 20%. I think it could go further, but I want to see if this rally is for real first.
iShares Nasdaq Biotechnology ETF (IBB)
EARNINGS: N/A
IBB tracks the performance of a modified market-cap-weighted index of US biotechnology companies listed on US exchanges. For more information click HERE.
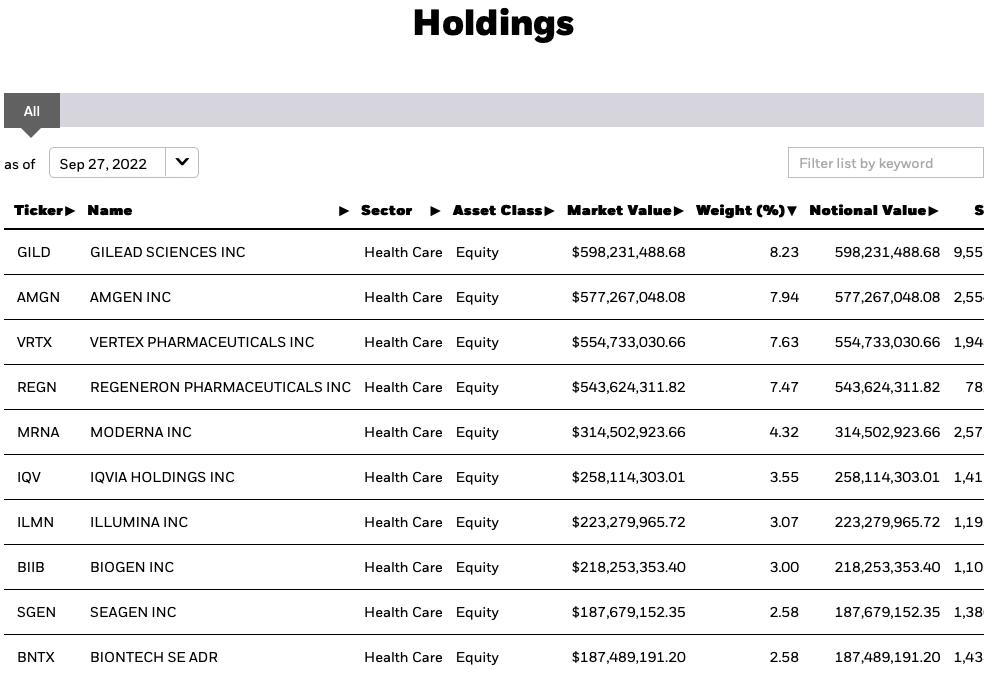
Predefined Scans Triggered: Elder Bar Turned Green.
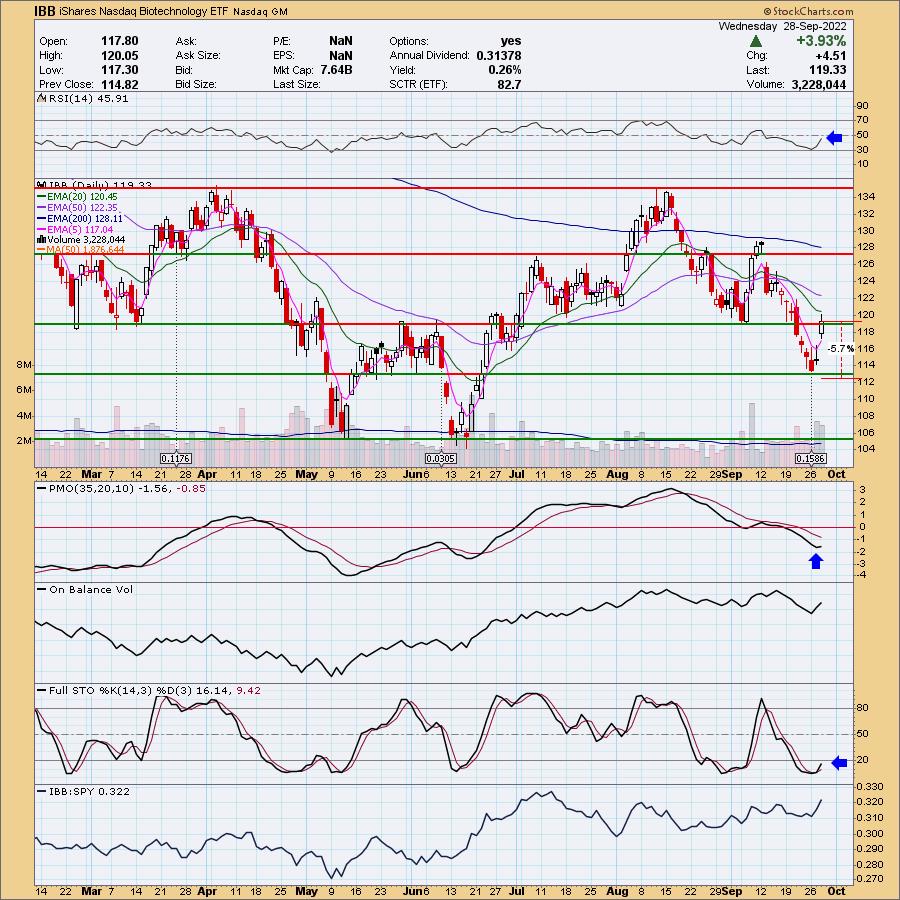
IBB is up +0.06% in after hours trading. It picked a great place to bottom, right at the late May early June lows. More importantly it recaptured support at the March low. The RSI is nearing positive territory and rising. The PMO has turned back up and Stochastics are rising. It is starting to increase its outperformance. The stop can be set thinly at 5.7% around $128.53.
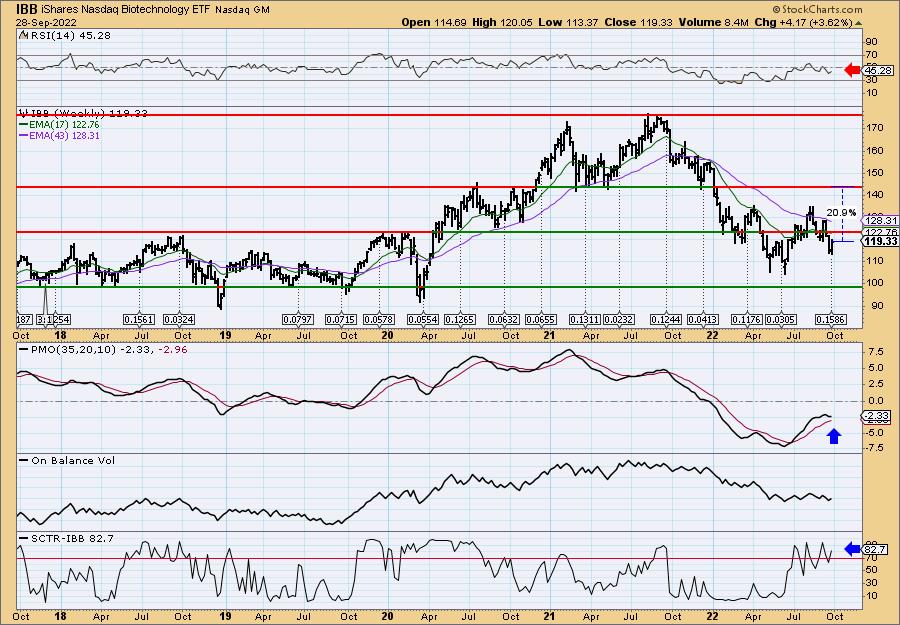
The weekly chart is trying to improve. The weekly RSI is rising, but still in negative territory. The weekly PMO is beginning to rise again. A PMO bottom above the signal line is especially bullish. I've put upside target around 21%, but there is a chance it will hit $135 and retrace. That would be a mild 13% gain which is acceptable given our stop is only 5.7%.
Teucrium Wheat Fund (WEAT)
EARNINGS: N/A
WEAT tracks an index of wheat futures contracts. It reflects the performance of wheat by holding Chicago Board of Trade wheat futures contracts with three different expiration dates. Click HERE for more information.
Predefined Scans Triggered: Elder Bar Turned Green, New CCI Buy Signals and P&F Double Bottom Breakout.
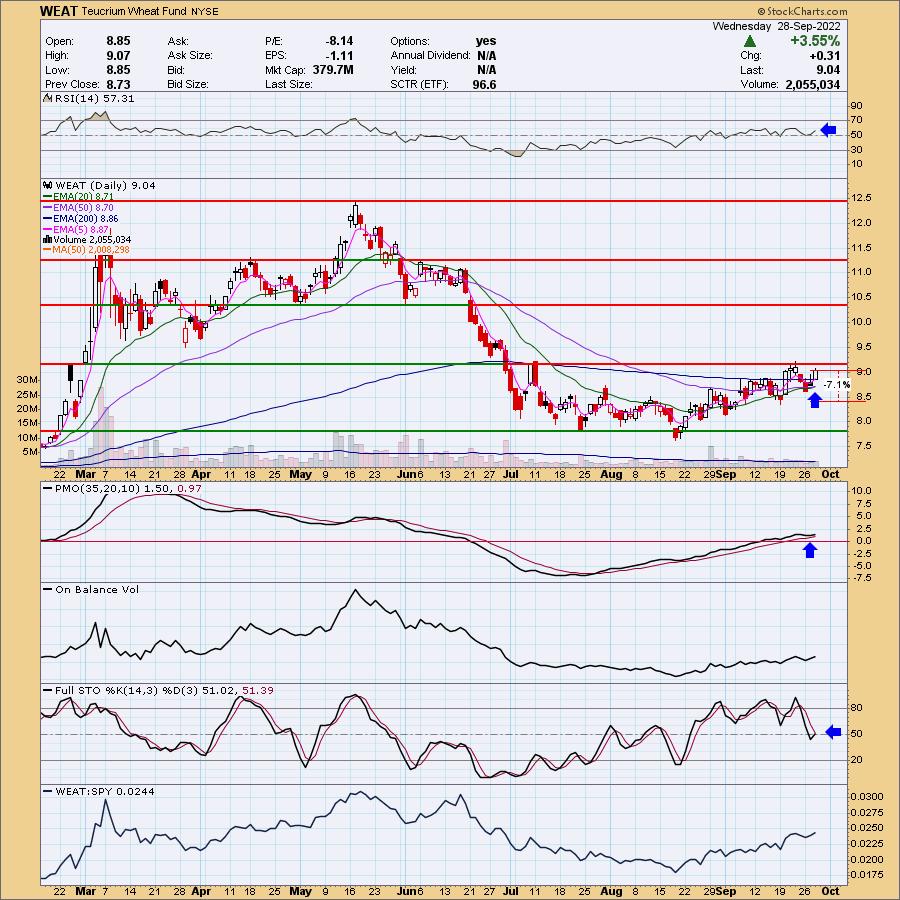
WEAT is up +0.33% in after hours trading. My first thought was, "Wow! I wish I'd gotten in at the end of August!". Well, I saw that I actually presented this one on August 24th 2022! It's up over 9% since. In this market, I'll take a 9% gain. I think it has further to go, but before I personally would enter, I would want the breakout above resistance. The RSI has been positive since we originally selected it. The PMO had turned down, but has since bottomed above the signal line which is especially bullish. The 20-day EMA crossed above the 50-day EMA (a "Silver Cross") triggering an IT Trend Model "Silver Cross" BUY signal. The OBV is confirming with rising bottoms. Stochastics tipped upward and are back above 50. The stop is set below the 9/19 closing low at 7.1% around $8.40.
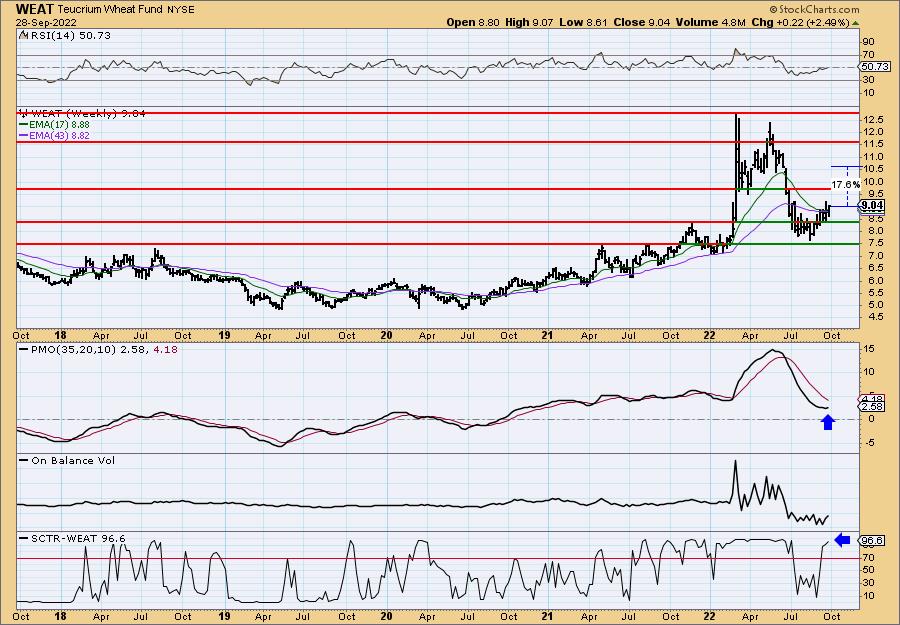
I like how price is hooking back up on the weekly chart. The weekly RSI just hit positive territory and the weekly PMO is turning back up. The SCTR is an excellent 96.6%, telling us it is in the top 4% of all ETFs as far as relative performance and trend analysis.
Don't forget, on Thursdays I look at reader-requested symbols, click HERE to send me an email. I read every email I receive and try to answer them all!
Current Market Outlook:
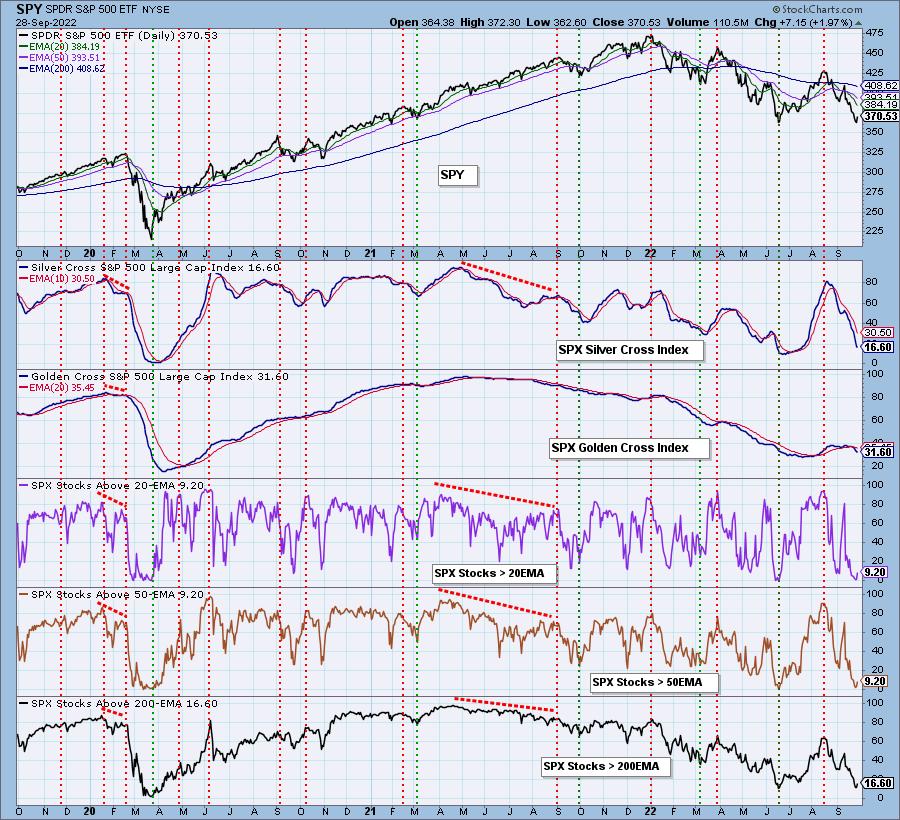
Market Environment: It is important to consider the odds for success by assessing the market tides. The following chart uses different methodologies for objectively showing the depth and trend of participation for intermediate- and long-term time frames.
- The Silver Cross Index (SCI) shows the percentage of SPX stocks on IT Trend Model BUY signals (20-EMA > 50-EMA)
- The Golden Cross Index (GCI) shows the percentage of SPX stocks on LT Trend Model BUY signals (50-EMA > 200-EMA)
Don't forget that as a "Diamonds" member, you have access to our GCI/SCI curated ChartList on DecisionPoint.com. You'll find it under "Members Only" links on the left side on the Blogs and Links Page.
Here is the current chart:
Full Disclosure: I am 10% exposed with 5% hedge.
I'm required to disclose if I currently own a stock I mention and/or may buy/short it within the next 72 hours.
"Technical Analysis is a windsock, not a crystal ball." - Carl Swenlin
(c) Copyright 2022 DecisionPoint.com
Watch the latest episode of DecisionPoint with Carl & Erin Swenlin on Mondays 7:00p EST or on the DecisionPoint playlist on the StockCharts TV YouTube channel here!
NOTE: The stocks reported herein are from mechanical trading model scans that are based upon moving average relationships, momentum and volume. DecisionPoint analysis is then applied to get five selections from the scans. The selections given should prompt readers to do a chart review using their own analysis process. This letter is not a call for a specific action to buy, sell or short any of the stocks provided. There are NO sure things or guaranteed returns on the daily selection of "Diamonds in the Rough."
Regarding BUY/SELL Signals: The signal status reported herein is based upon mechanical trading model signals and crossovers. They define the implied bias of the price index/stock based upon moving average relationships and momentum, but they do not necessarily call for a specific action. They are information flags that should prompt chart review. Further, they do not call for continuous buying or selling during the life of the signal. For example, a BUY signal will probably (but not necessarily) return the best results if action is taken soon after the signal is generated. Additional opportunities for buying may be found as price zigzags higher, but the trader must look for optimum entry points. Conversely, exit points to preserve gains (or minimize losses) may be evident before the model mechanically closes the signal.
Helpful DecisionPoint Links:
DecisionPoint Shared ChartList and DecisionPoint Chart Gallery
Price Momentum Oscillator (PMO)
Swenlin Trading Oscillators (STO-B and STO-V)
For more links, go to DecisionPoint.com