
I had a handful of great reader requests this week! Great job, everybody who submitted! I think most of these are ready for primetime. My main hesitation is the state of the market. It was supposed to finish higher and rally today... no such luck. Being on the buy side is very risky right now. I was ready to expand today, but with the weak open and trading, I just couldn't convince myself to pull the trigger.
The "Diamonds in the Rough" this week are all on my radar. I was explaining to my father that it is no fun sitting on the sidelines, but I further remarked that in this environment it's really no fun being in either. I'm pretty much over this bear market, unfortunately it isn't over. Will probably toss a hedge in if I expand.
Don't forget to sign up for the Diamond Mine trading room. Looking forward to seeing how the market responds to today's lackluster performance.
Good Luck & Good Trading!
Erin
Today's "Diamonds in the Rough": ADTN, FGEN and INST
Runners Up: INBX, PBF, KNSA, SILK and KNX.

RECORDING LINK (9/23/2022):
Topic: DecisionPoint Diamond Mine (9/23/2022) LIVE Trading Room
Start Time: Sept 23, 2022 09:00 AM
Passcode: Sept*23rd
REGISTRATION For Friday 9/30 Diamond Mine:
When: Sep 30, 2022 09:00 AM Pacific Time (US and Canada)
Topic: DecisionPoint Diamond Mine (9/30/2022) LIVE Trading Room
Register in advance for this webinar HERE
Save the registration confirmation email with login instructions in case Zoom doesn't notify you in time.
*** NO DIAMOND MINE ON 10/7 ***
I will be at ChartCon 2022 on Friday and unable to hold the trading room. I'm planning on doing the Recap, but that is tentative. You will receive your ten picks for the week including ETF Day and Reader Request Day.
I'll be running trading rooms with Dave Landry so you might want to sign up to attend ChartCon 2022! I'll also be debating my friend, Tom Bowley point/counterpoint style bear v. bull! The event will not be like it was in the past. It is more of a television production with entertaining segments that will make education fun! Here is the link.

Here is the Monday 9/26 recording:
Welcome to DecisionPoint Diamonds, wherein I highlight ten "Diamonds in the Rough" per week. These are selected from the results of my DecisionPoint Scans, which search for stocks that could benefit from the trend and condition of the market. Remember, these are not recommendations to buy or sell, but are the most interesting of the stocks that surfaced in my scans. My objective is to save you the work of the initial, tedious culling process, but you need to apply your own analysis to see if these stocks pique your interest as well. There are no guaranteed winners here!
"Predefined Scans Triggered" are taken from StockCharts.com using the "Symbol Summary" option instead of a "SharpChart" on the workbench.
A10 Networks, Inc. (ATEN)
EARNINGS: 11/1/2022 (AMC)
A10 Networks, Inc. engages in the provision of application networking solutions that help organizations ensure that their data center applications and networks remain available, accelerated, and secure. It offers cloud storage, enterprise solutions, security products, data center, application delivery, load balancing, and distributed denial of service protection. The company was founded by Lee Chen in 2004 and is headquartered in San Jose, CA.
Predefined Scans Triggered: None.
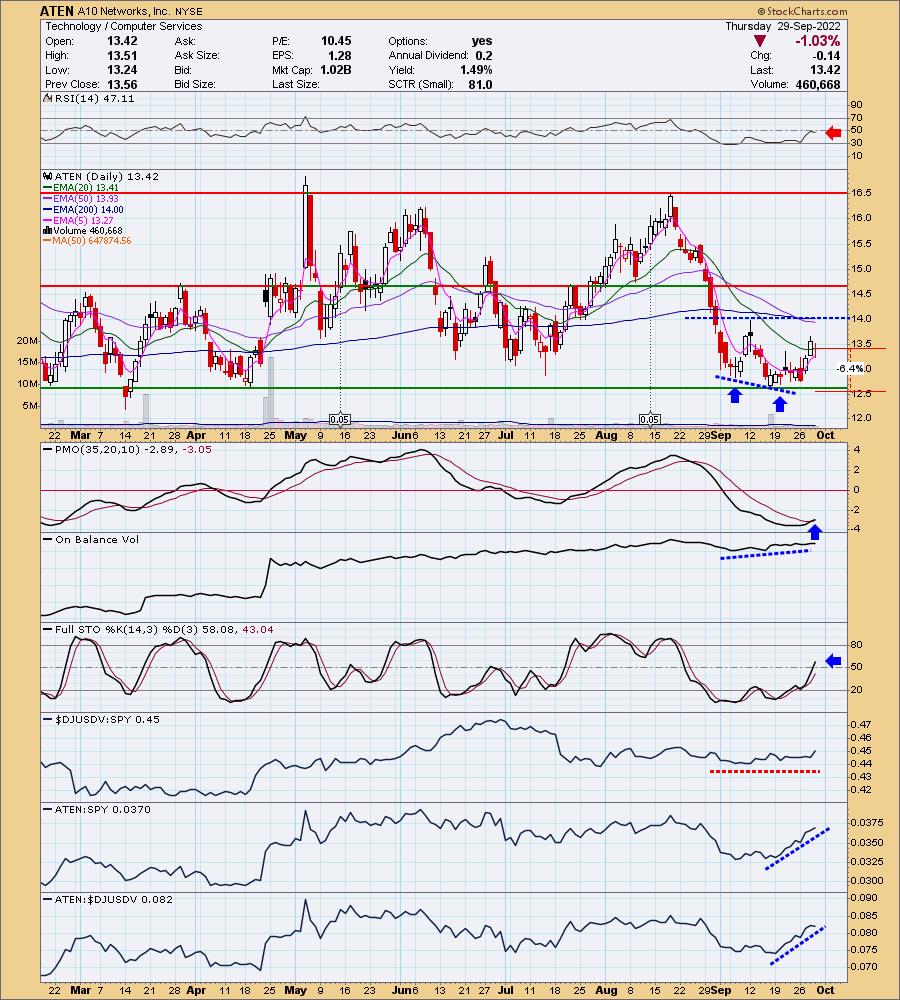
ATEN is up +1.12% in after hours trading. I believe this reader is on the right track--lots going for this chart. There is a double-bottom developing (it isn't a double-bottom until the confirmation line is broken. The minimum upside target of the pattern is about $15.25 or the late June top. There is only one thing bad about this chart and it is forgivable--a falling and negative RSI. This should correct itself on the next up day. There is a positive OBV divergence between OBV bottoms and price bottoms. The PMO just triggered a crossover BUY signal. Stochastics are rising strongly. I'm not happy with the underperformance of the group. It is performing inline with the SPY and that is not good given the losses on the SPY. However, ATEN outshines the group and the SPY. The stop is set at 6.4% around at $12.56.
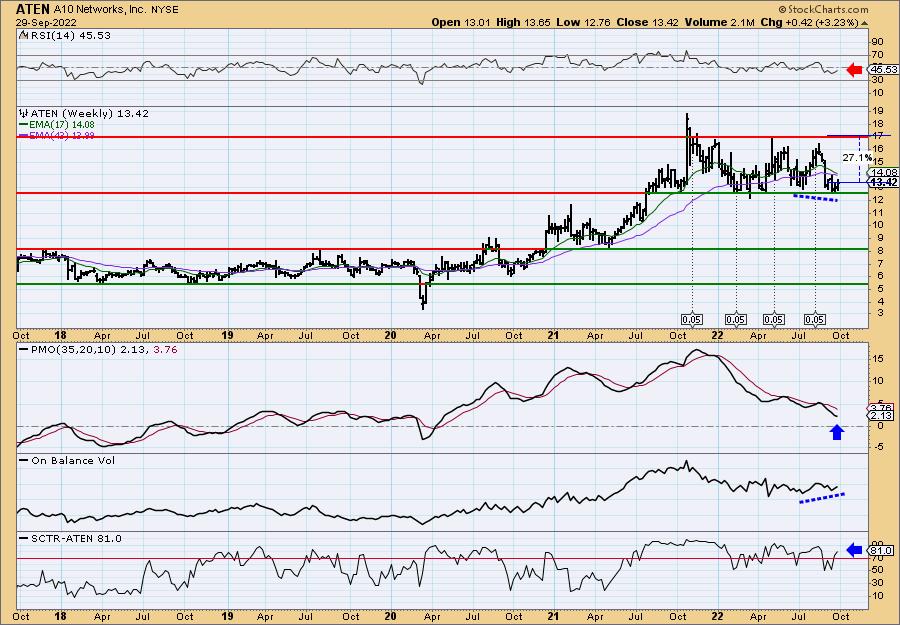
This one likes to travel in trading ranges which is great given price is at the bottom of the range right now. The weekly RSI is negative, but rising a bit. The PMO is decelerating and trying to turn up. The OBV divergence is clearer on the weekly chart. The SCTR is 81%, above our 70% bullish threshold.
Peabody Energy Corp. (BTU)
EARNINGS: 10/27/2022 (BMO)
Peabody Energy Corp. engages in the business of coal mining. It operates through the following business segments: Powder River Basin, Midwestern U.S., Western U.S., Seaborne Metallurgical, Seaborne Thermal Mining and Corporate and Other. The Powder River Basin Mining segment consists of its mines in Wyoming. The Midwestern U.S. includes Illinois and Indiana mining operations. The Western U.S. reflects the aggregation of its New Mexico, Arizona and Colorado mining operations. The Seaborne Metallurgical covers mines in Queensland, Australia. The Seaborne Thermal Mining handles operations in New South Wales, Australia. The Corporate and Other segment includes selling and administrative expenses, results from equity affiliates, corporate hedging activities and trading and brokerage activities. The company was founded by Francis S. Peabody in 1883 and is headquartered in St. Louis, MO.
Predefined Scans Triggered: Hollow Red Candles and P&F Low Pole.
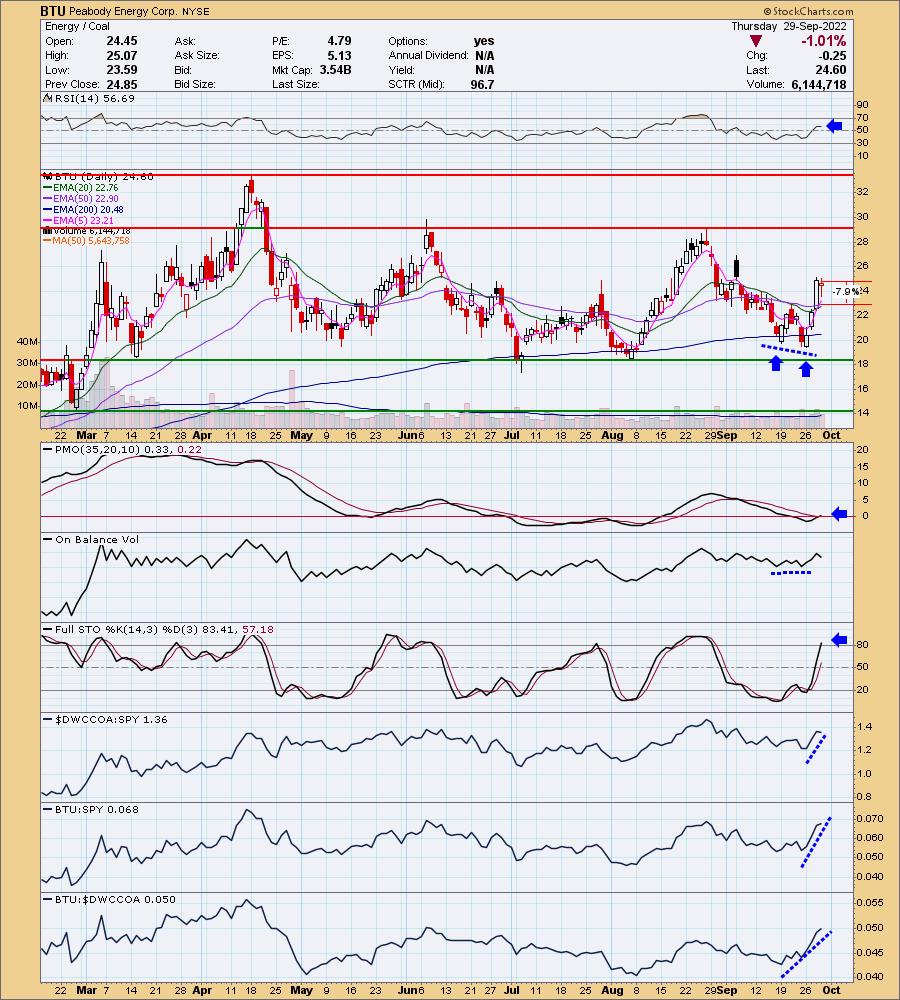
BTU is down -0.41% in after hours trading. The Energy sector is coming back to life and I believe Coal will benefit, particularly as we head into winter months. The double-bottom has been confirmed with the minimum upside target nearing quickly at about $27. The chart is beginning to gel with a positive RSI, new PMO BUY signal in oversold territory, OBV positive divergence and Stochastics above 80. The group is surging this week. I had Warrior Met Coal (METC) come up in a scan yesterday and today, but BTU has better relative performance (and it was requested) so I opted to include it. The stop is set at the 50-day EMA or a 7.9% stop around $22.65.
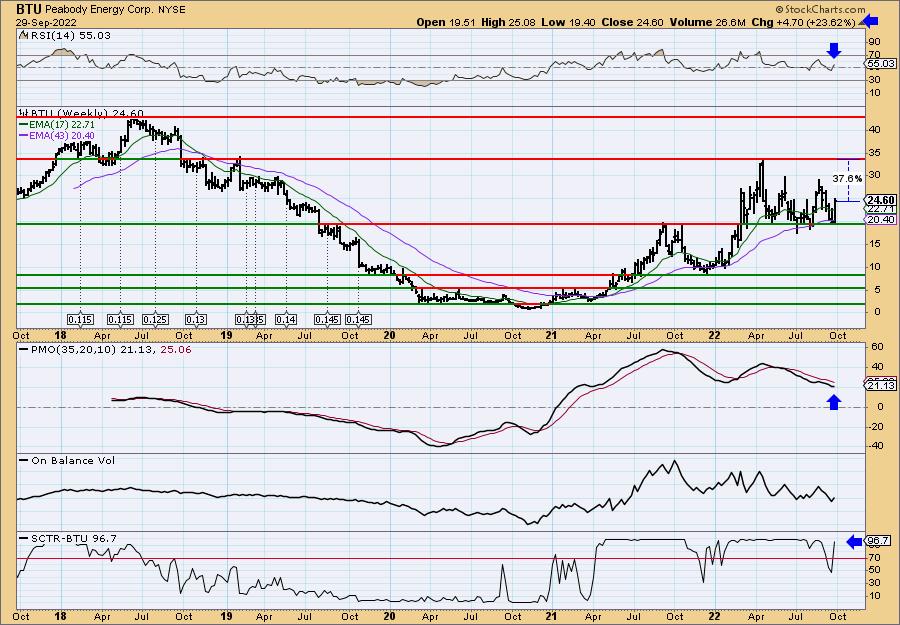
It's in the middle of its current trading range but still has excellent upside potential. The weekly RSI is positive and the weekly PMO is turning up. The SCTR is an excellent 96.7%. I do note that it is up over 23% this week, so it is vulnerable to a pullback.
Clearfield Inc. (CLFD)
EARNINGS: 11/3/2022 (AMC)
Clearfield, Inc. designs, manufactures, and distributes fiber optic management, protection and delivery products for communications networks. The firm's products include fiber cabinets, patch cards, assemblies, cassettes, frames, panels, microduct, terminals, vaults, wall boxes, and box enclosures. It offers its products under the Clearview brand. The company was founded in 1979 and is headquartered in Brooklyn Park, MN.
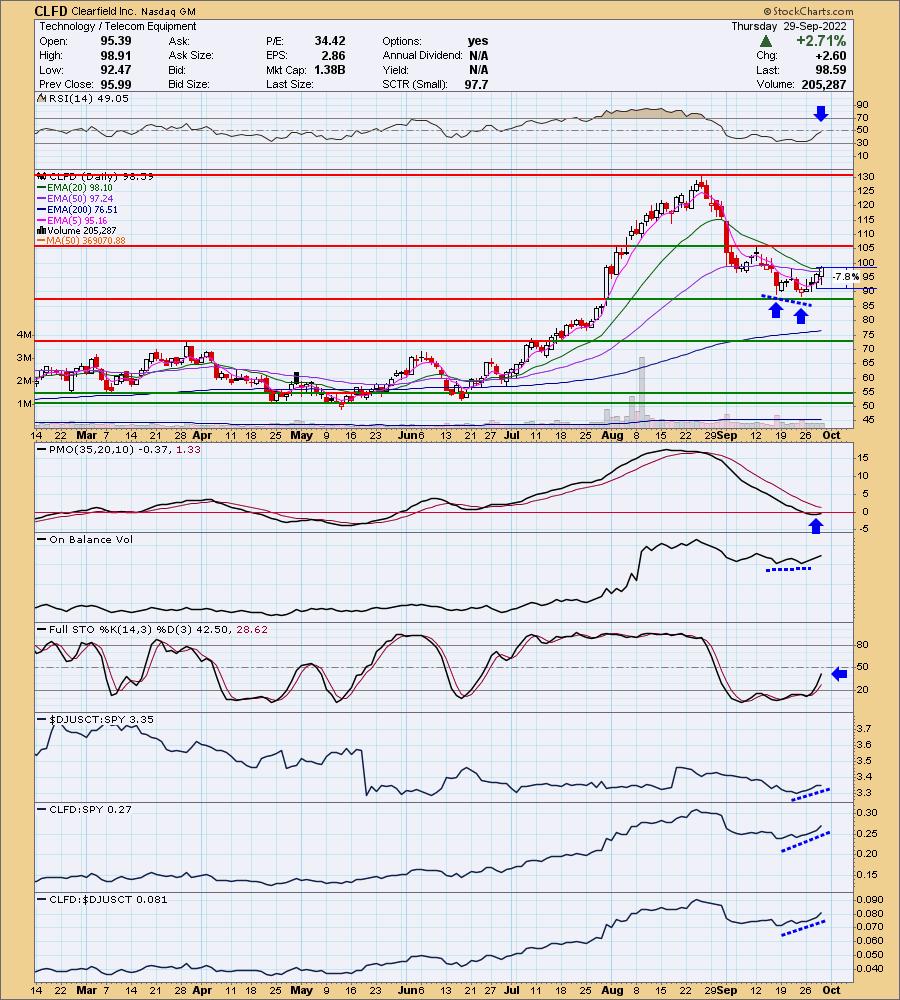
Predefined Scans Triggered: P&F Double Top Breakout.
CLFD is down -2.5% in after hours trading. I hate that. I pick a chart that I love, mark it up and then find it is tanking in after hours trading. One benefit is a better entry, but it can also spoil the chart. We'll see. Price did close above the 20/50-day EMAs which is one of the reasons I selected it. There is a double-bottom with a positive OBV divergence. The RSI is rising, albeit still negative. The PMO is angling upward. Stochastics are still in negative territory, but rising strongly. Relative performance is mediocre across the board, but is still increasing. The stop is set at 7.8% around $90.90.
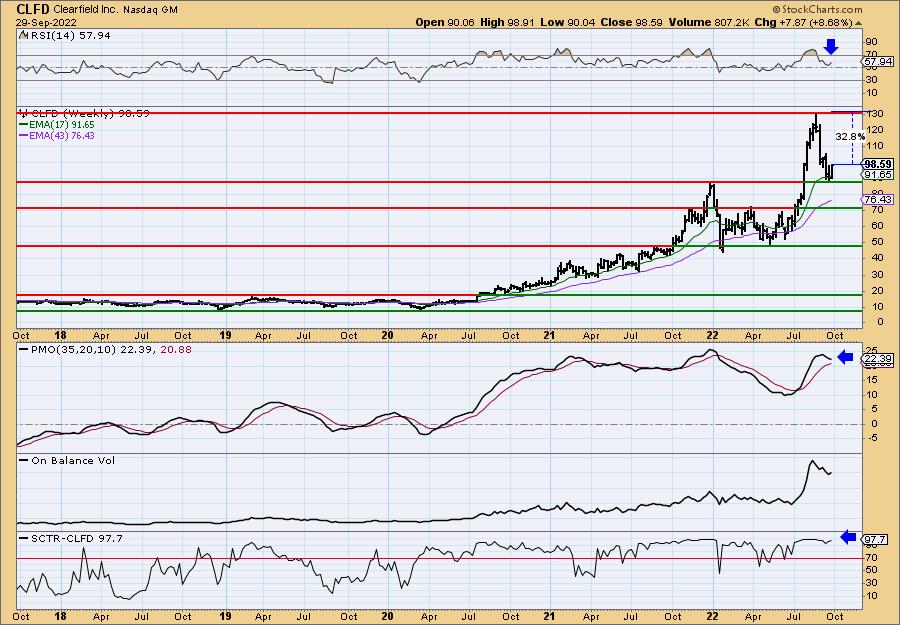
The weekly RSI is positive, rising and isn't overbought. The weekly PMO is decelerating its decline. The SCTR is a strong 97.7%. Upside potential, should it reach all-time highs, would be over 32%.
Kiniksa Pharmaceuticals, Ltd (KNSA)
EARNINGS: 10/31/2022 (BMO)
Kiniksa Pharmaceuticals Ltd. is a biopharmaceutical company, which engages in discovering, acquiring, developing, and commercializing therapeutic medicines for patients suffering from debilitating diseases with significant unmet medical need. Its products include Rilonacept, Mavrilimumab, Vixarelimab, and KPL-404. The company was founded by Sanj K. Patel, Stephen Frank Mahoney, Krisha S. Mahoney, Thomas W. Beetham, Christopher Heberlig, Carsten Boess, Rasmus Holm-Jorgensen, Gregory Alex Grabowksi, Aaron Isadore Young, Eben P. Tessari, Jennifer Lynne Mason and Mickenzie Elizabeth Gallagher in July 2015 and is headquartered in Lexington, MA.
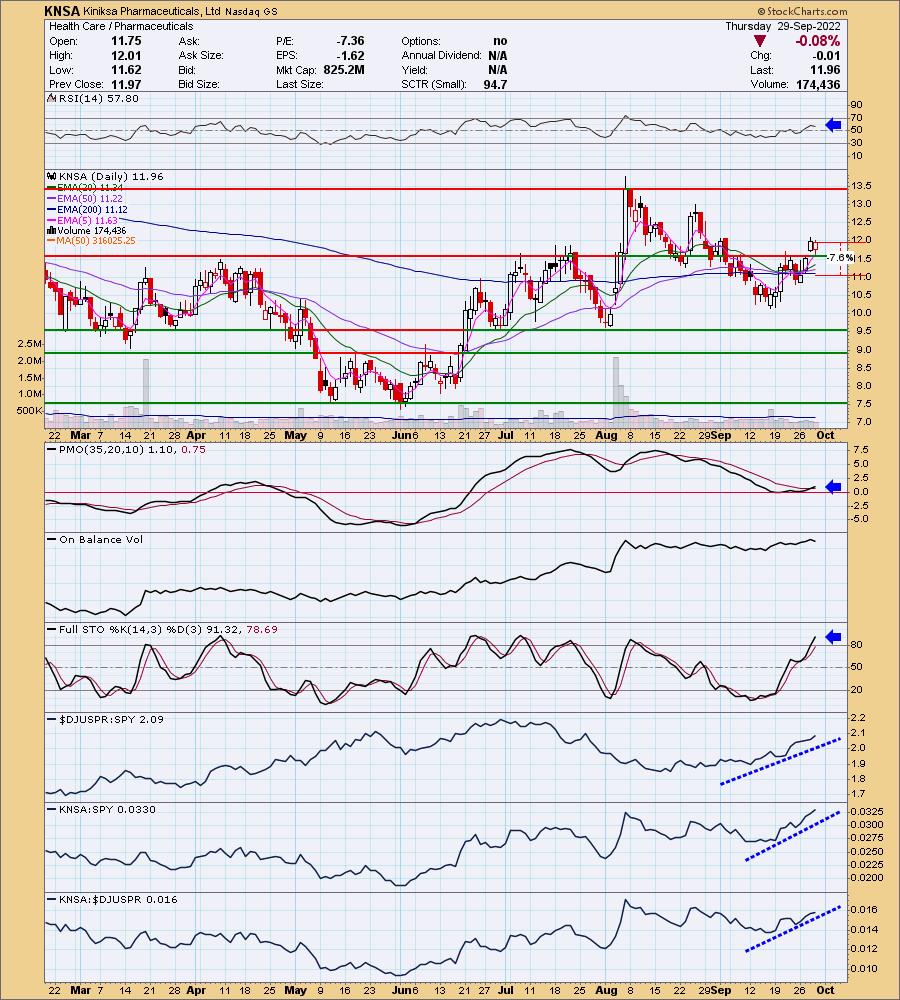
Predefined Scans Triggered: Hollow Red Candles and Moved Above Ichimoku Cloud.
KNSA is unchanged in after hours trading. I like yesterday's breakout move and today's bullish hollow red candlestick. This rally looks legit. The RSI is positive and the PMO just triggered a crossover BUY signal. Stochastics are above 80 and rising strongly. Relative strength is excellent across the board. I've set a reasonable stop below all three EMAs at 7.6% or around $11.05.
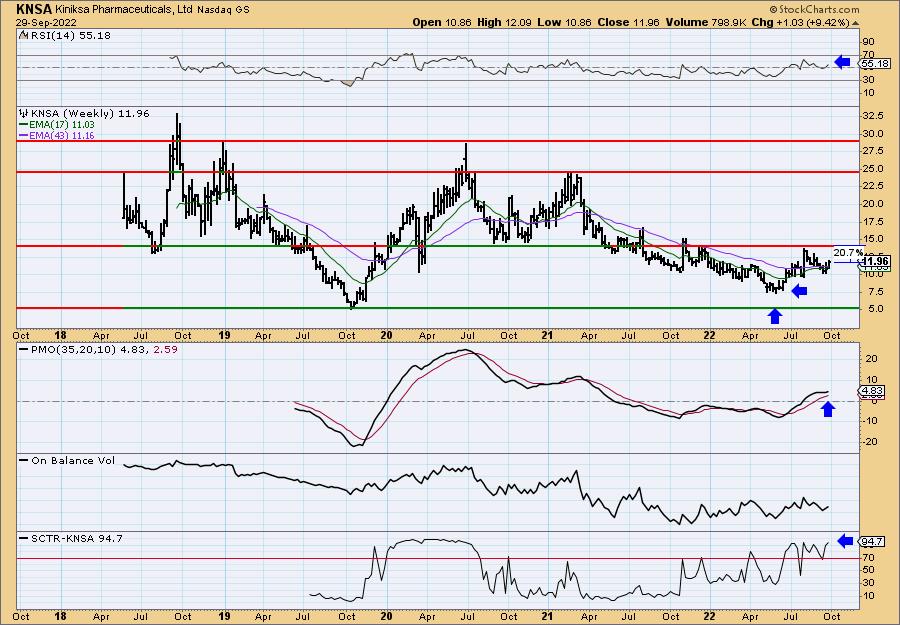
The weekly RSI is positive and rising. The weekly PMO bottomed above its signal line which is especially bullish in the intermediate term. It is close to overhead resistance visually, but really if it can hit the next resistance level it would be a 20.7% gain.
Don't forget, on Thursdays I look at reader-requested symbols, click HERE to send me an email. I read every email I receive and try to answer them all!
Current Market Outlook:
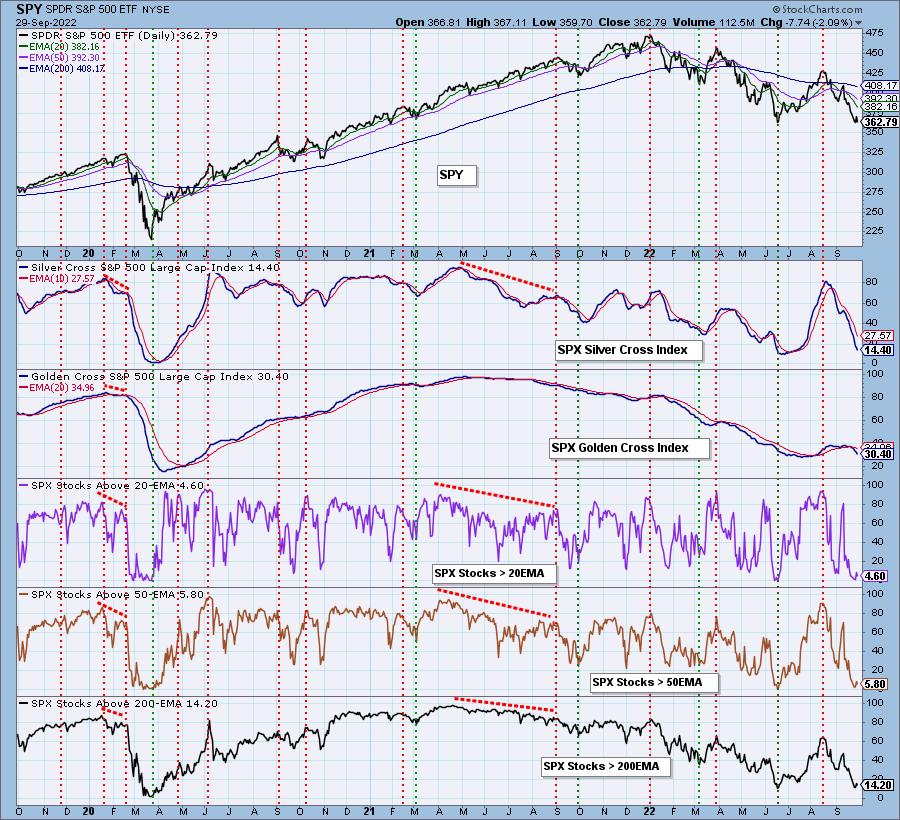
Market Environment: It is important to consider the odds for success by assessing the market tides. The following chart uses different methodologies for objectively showing the depth and trend of participation for intermediate- and long-term time frames.
- The Silver Cross Index (SCI) shows the percentage of SPX stocks on IT Trend Model BUY signals (20-EMA > 50-EMA)
- The Golden Cross Index (GCI) shows the percentage of SPX stocks on LT Trend Model BUY signals (50-EMA > 200-EMA)
Don't forget that as a "Diamonds" member, you have access to our GCI/SCI curated ChartList on DecisionPoint.com. You'll find it under "Members Only" links on the left side on the Blogs and Links Page.
Here is the current chart:
Full Disclosure: I am 10% exposed with 5% hedges.
I'm required to disclose if I currently own a stock I mention and/or may buy/short it within the next 72 hours.
"Technical Analysis is a windsock, not a crystal ball." - Carl Swenlin
(c) Copyright 2022 DecisionPoint.com
Watch the latest episode of DecisionPoint with Carl & Erin Swenlin on Mondays 7:00p EST or on the DecisionPoint playlist on the StockCharts TV YouTube channel here!
NOTE: The stocks reported herein are from mechanical trading model scans that are based upon moving average relationships, momentum and volume. DecisionPoint analysis is then applied to get five selections from the scans. The selections given should prompt readers to do a chart review using their own analysis process. This letter is not a call for a specific action to buy, sell or short any of the stocks provided. There are NO sure things or guaranteed returns on the daily selection of "Diamonds in the Rough."
Regarding BUY/SELL Signals: The signal status reported herein is based upon mechanical trading model signals and crossovers. They define the implied bias of the price index/stock based upon moving average relationships and momentum, but they do not necessarily call for a specific action. They are information flags that should prompt chart review. Further, they do not call for continuous buying or selling during the life of the signal. For example, a BUY signal will probably (but not necessarily) return the best results if action is taken soon after the signal is generated. Additional opportunities for buying may be found as price zigzags higher, but the trader must look for optimum entry points. Conversely, exit points to preserve gains (or minimize losses) may be evident before the model mechanically closes the signal.
Helpful DecisionPoint Links:
DecisionPoint Shared ChartList and DecisionPoint Chart Gallery
Price Momentum Oscillator (PMO)
Swenlin Trading Oscillators (STO-B and STO-V)
For more links, go to DecisionPoint.com