
The market managed a positive close today, but based on my review of all of the industry groups that StockCharts covers, I doubt it will see much follow-through. Every single one of the industry groups that I looked at showed a declining PMO. Let that sink in.. if I counted right, there are 104 industry groups and zero have rising momentum. Since using industry group analysis, this is the worst I've ever seen.
Not surprisingly only one brave soul sent me a handful of requests. He described his ChartList as "short, sad, risky". I hear you! My scans have produced nothing unless I manipulate them to not count certain EMA configurations and have a PMO rising for only one or two days rather than three. Even then I get a handful of basically ugly or mediocre charts.
What does an analyst do? I looked at two industry groups that seem to have a PMO that is at least decelerating and flattening: Biotechnology and Pharmaceuticals. I also note that these two groups are far from homogenous, meaning they can have very bullish stocks and very bearish stocks regardless of the market's direction. They are beginning to see some relative strength. Although I take that with a grain of salt given the SPY has been terrible and those groups have just been less terrible.
I pared back my exposure significantly and added a hedge (two if you count PFIX as a hedge). My exposure is now 15%. For Diamond subscribers, I will share that I have two Utilities, PFIX and an inverse ETF. It's ugly out there. So while I provide "Diamonds in the Rough", I will tell you that I'm not interested in expanding exposure until I see more industry groups turn around.
Let's see if the rally continues tomorrow in the Diamond Mine trading room. Registration links are below the diamonds logo below.
Good Luck & Good Trading!
Erin
Today's "Diamonds in the Rough": BHC, DCPH, GILD and MIST.
"Runners-up": ATNM, XENE and CTIC. (PFIX was also requested but I covered it recently).

TODAY'S RECORDING LINK (8/26/2022):
Topic: DecisionPoint Diamond Mine (8/26/2022) LIVE Trading Room
Start Time: Aug 26, 2022 09:00 AM
Meeting Recording Link
Access Passcode: August*26
REGISTRATION For Friday 9/2 Diamond Mine:
When: Sep 2, 2022 09:00 AM Pacific Time (US and Canada)
Topic: DecisionPoint Diamond Mine (9/2/2022) LIVE Trading Room
Register in advance for this webinar HERE
Save the registration confirmation email with login instructions in case Zoom doesn't notify you in time.

Last Monday's Recording:
Welcome to DecisionPoint Daily Diamonds, wherein I highlight ten "Diamonds in the Rough" per week. These are selected from the results of my DecisionPoint Scans, which search for stocks that could benefit from the trend and condition of the market. Remember, these are not recommendations to buy or sell, but are the most interesting of the stocks that surfaced in my scans. My objective is to save you the work of the initial, tedious culling process, but you need to apply your own analysis to see if these stocks pique your interest as well. There are no guaranteed winners here!
"Predefined Scans Triggered" are taken from StockCharts.com using the "Symbol Summary" option instead of a "SharpChart" on the workbench.
Bausch Health Cos. Inc. (BHC)
EARNINGS: 11/8/2022 (BMO)
Bausch Health Cos., Inc. engages in the development, manufacture and market of a range of branded, generic and branded generic pharmaceuticals, medical devices and over-the-counter products. It operates through the following segments: The Bausch + Lomb/International, Salix, Ortho Dermatologics and Diversified Products. The Bausch + Lomb/International segment consists of the sale of pharmaceutical products, over-the-counter products, and medical devices products. The Salix segment consists of sales in the U.S. of GI products. The Ortho Dermatologics segment consists of sales in the U.S. of Ortho Dermatologics (dermatological) products and global sales of Solta medical aesthetic devices. The Diversified Products segment consists of sales in the U.S. of pharmaceutical products in the areas of neurology and certain other therapeutic classes, in the U.S. of generic products, in the U.S. of dentistry products. The company was founded on March 29, 1994 and is headquartered in Laval, Canada.
Predefined Scans Triggered: New CCI Buy Signals and Moved Above Upper Bollinger Band.
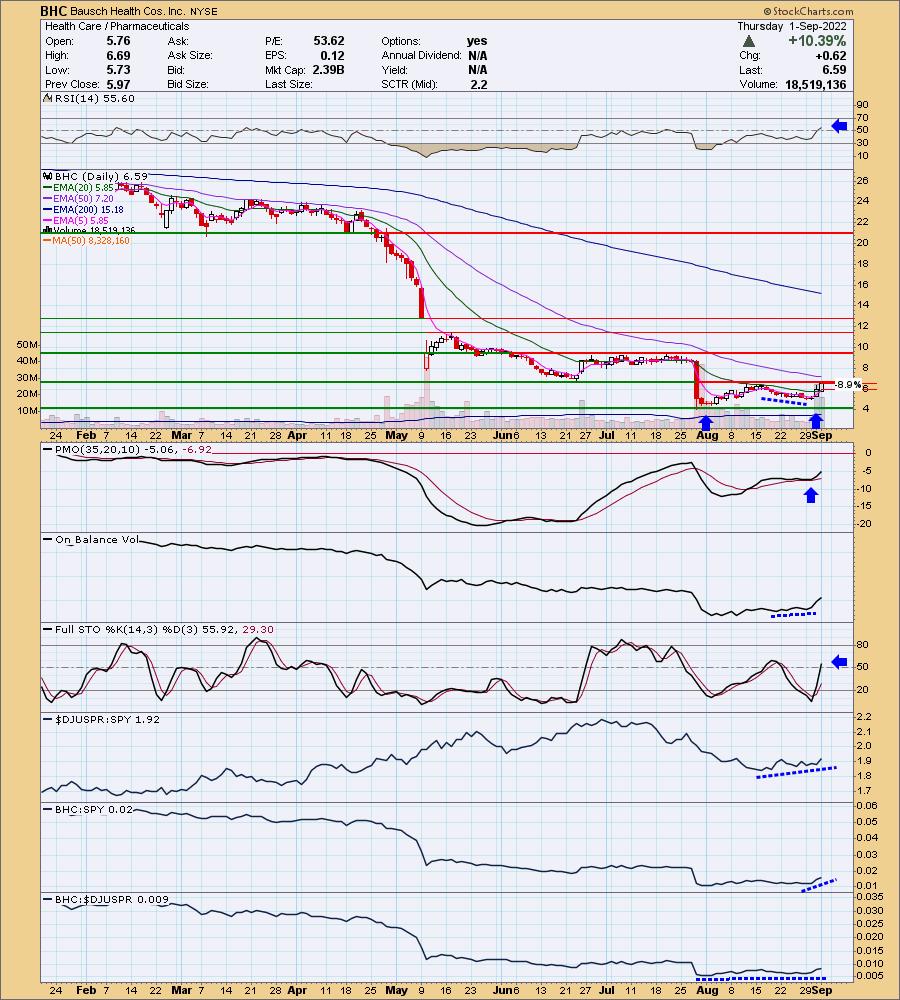
BHC is down -0.30% in after hours trading. I covered it twice in 2020. Here is the link to the last time on June 4th 2020. This stock is really beat down. It's last attempt at a rally was foiled. This time could be the same, but there are subtle differences this time. The RSI is in positive territory and the PMO is accelerating higher after bottoming above the signal line. Volume is coming in as there is a slight OBV positive divergence with price lows. As noted in the opening, Pharma is seeing a bit of relative strength. Stochastics are above net neutral (50), but that happened before and it failed. BHC performs in line with the group and since it is beginning to outperform a bit, so is BHC. The stop was really difficult to set given today's gain was much higher than I would use for a stop. Therefore, I set it around the 20-day EMA at about $6.00. It is priced low so position size wisely if you take this one on.
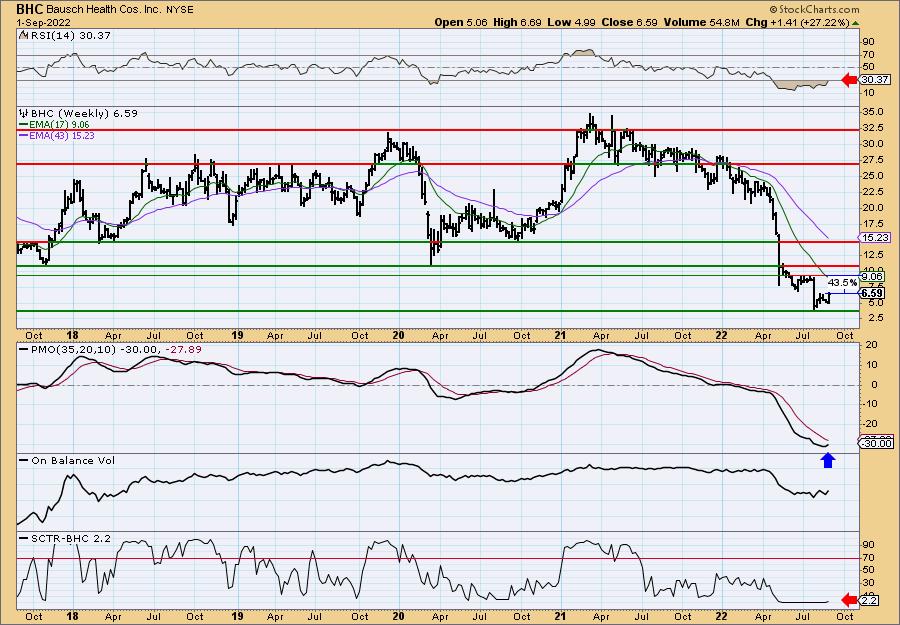
The weekly chart has me slightly more confident given the weekly PMO is rising again and the RSI is rising out of oversold territory. Still, the RSI is in negative territory and the SCTR is beyond awful at 2.2%. If it can just reach July highs, that would be a big 43.5%. In this market... eh, we'll see.
Deciphera Pharmaceuticals, Inc. (DCPH)
EARNINGS: 11/1/2022 (BMO)
Deciphera Pharmaceuticals, Inc. engages in discovering, developing, and delivering important new medicines to patients for the treatment of cancer. The firm designs a drug candidate, DCC-2618, to inhibit the full spectrum of mutant or amplified KIT and PDGFRa kinases that drive cancers such as gastrointestinal stromal tumors (GIST), advanced systemic mastocytosis (ASM), gliomas, and other solid tumors. It also develops two other clinical-stage drug candidates, DCC-3014 and rebastinib, as immuno-oncology kinase, inhibitors targeting the kinases CSF1R, and TIE2 kinas. The company was founded by Peter A. Petillo and Daniel L. Flynn in November 2003 and is headquartered in Waltham, MA.
Predefined Scans Triggered: Parabolic SAR Buy Signals.
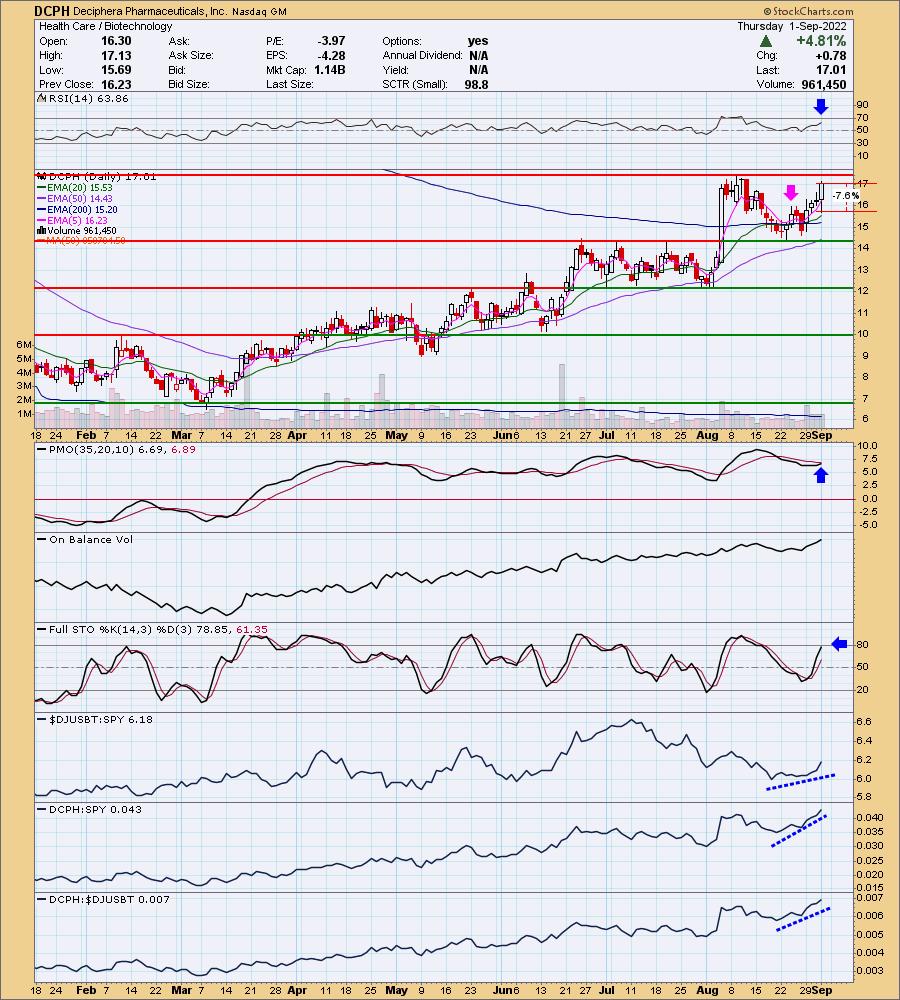
DCPH is down -1.00% in after hours trading. I covered it on March 4th 2020. This one is recuperating after a big decline earlier in August. The RSI is positive and the PMO is nearing a crossover BUY signal. Stochastics are rising and should reach above 80 shortly. Relative strength is improving against the group and the SPY. The stop is set below the annotated top at 7.6% or $15.72.
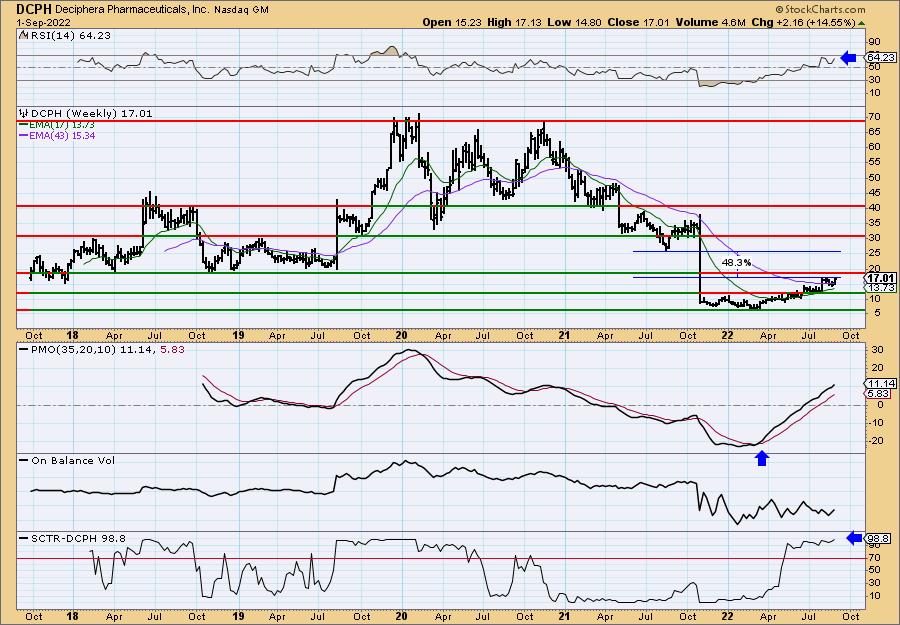
The weekly PMO has been rising most of 2022 and we know how bad it's been for the market during that time. The weekly RSI is positive and the SCTR is top notch at 98.8%.
Gilead Sciences, Inc. (GILD)
EARNINGS: 10/27/2022 (AMC)
Gilead Sciences, Inc. is a biopharmaceutical company, which engages in the research, development, and commercialization of medicines in areas of unmet medical need. The firm's primary areas of focus include human immunodeficiency virus, acquired immunodeficiency syndrome, liver diseases, hematology, oncology, and inflammation and respiratory diseases. It offers antiviral products under Harvoni, Genvoya, Epclusa, Truvada, Atripla, Descovy, Stribild, Viread, Odefsey, Complera/Eviplera, Sovaldi, and Vosevi brands. The company was founded by Michael L. Riordan on June 22, 1987 and is headquartered in Foster City, CA.
Predefined Scans Triggered: Improving Chaikin Money Flow.
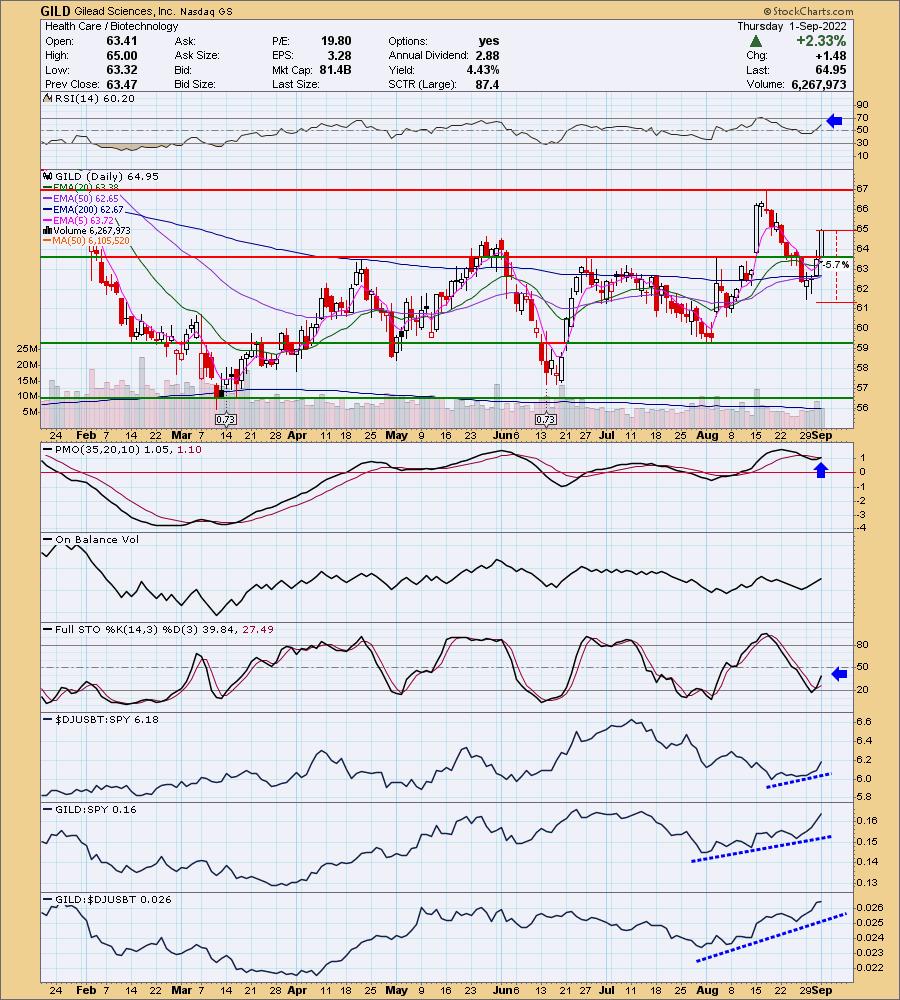
GILD is up +0.06% in after hours trading. It's basically been range bound which I generally avoid, but with the strength possibly returning to Biotechnology, this is a stalwart in the group and a solid out-performer. The RSI is positive and rising. The PMO is nearing a crossover BUY signal. We also have an LT Trend Model "Golden Cross" BUY signal lining up as the 50-day EMA is about to cross above the 200-day EMA. Stochastics are rising, but are in negative territory. I was also happy that you can set a slim stop at 5.7% or around $61.25.
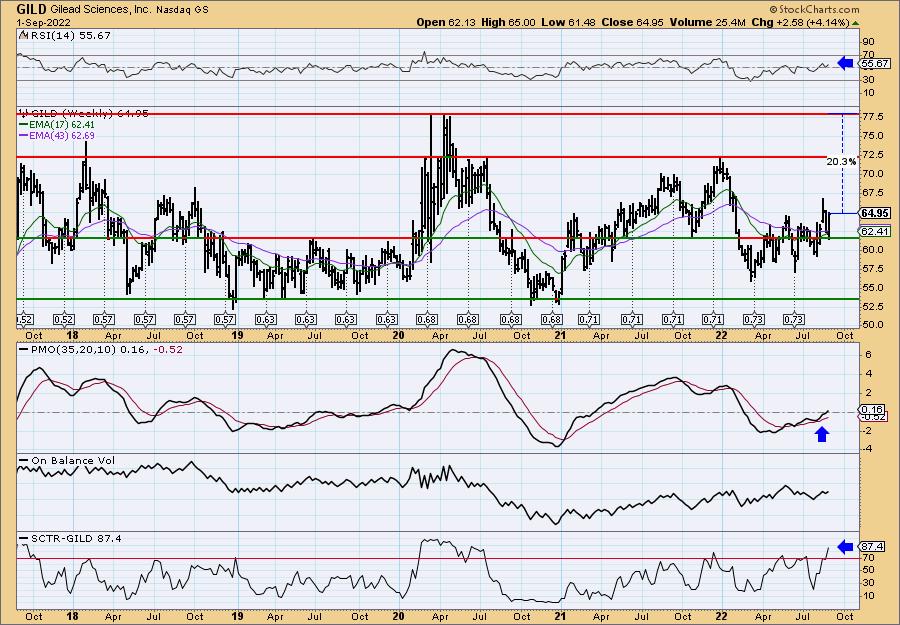
I love the indicators on this chart. The weekly RSI is positive, rising and not overbought. The weekly PMO is on a BUY signal and just moved above the zero line. The SCTR is very healthy at 87.4%.
Milestone Pharmaceuticals Inc. (MIST)
EARNINGS: 11/10/2022 (AMC)
Milestone Pharmaceuticals, Inc. engages in the development and commercialization of cardiovascular medicines. Its lead product candidate etripamil, is a novel, potent and short-acting calcium channel blocker that is designed as a rapid-onset nasal spray to be self-administered by patients. It develops etripamil to treat paroxysmal supraventricular tachycardia, atrial fibrillation, rapid ventricular rate, and other cardiovascular indications. The company was founded by Philippe Douville and Philippe Lamarre in 2003 and is headquartered in Montreal, Canada.
Predefined Scans Triggered: New 52-Week Highs and P&F Double Top Breakout.
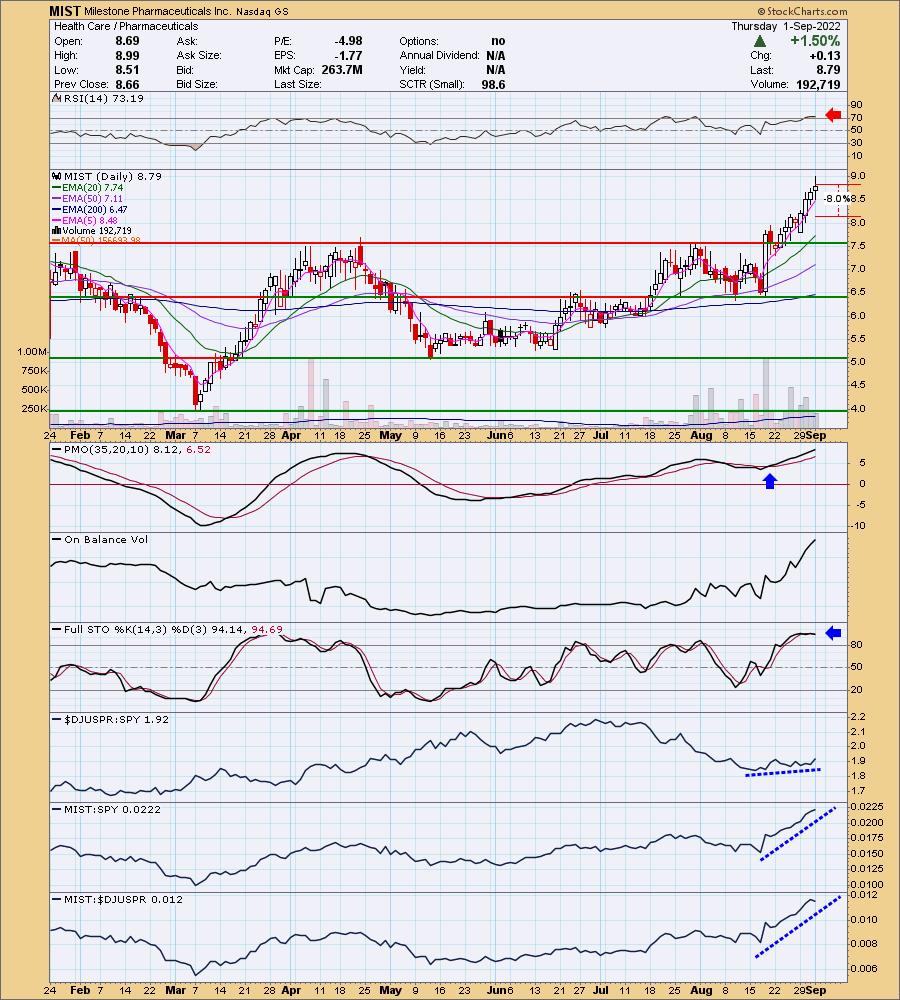
MIST is up +2.39% in after hours trading. I covered it on March 10th 2020. Let's file this one under "winners keep on winning". It is a very rare find right now to get a stock making new 52-week highs, but here we are. The RSI is overbought right now, but other than that, the chart is excellent. The PMO is on a BUY signal and not that overbought when you consider it has seen lows of -10. Stochastics are strong above 80 with no twitch. Relative strength is excellent against the group and the SPY. I used my typical 8% stop level as there really aren't any support levels nearby. 8% stop translates to $8.09. Low priced stock so position size wisely.
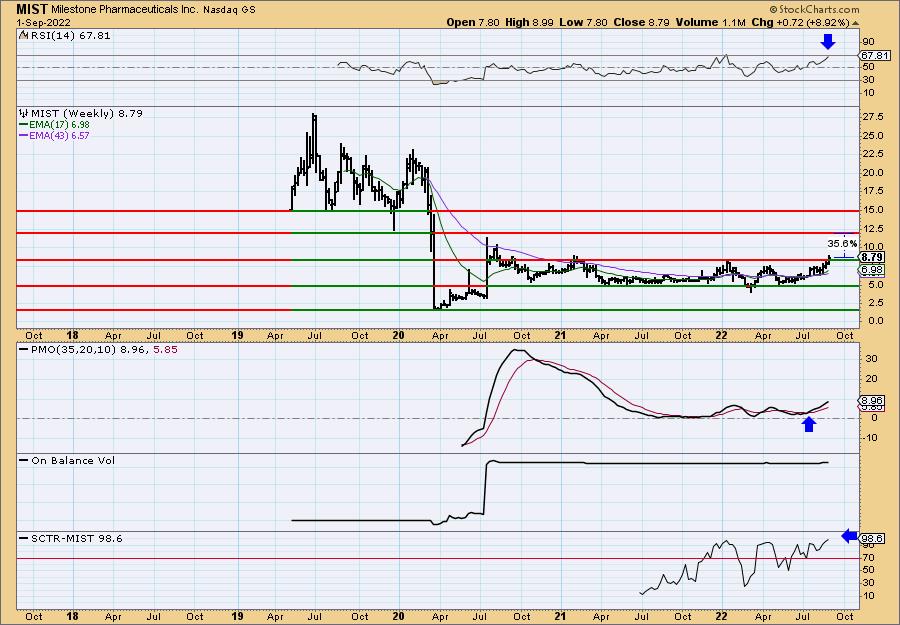
I really liked the breakout on the weekly chart. The weekly PMO is rising on a crossover BUY signal and is not overbought. The weekly RSI is positive and not overbought. The SCTR is an excellent 98.6%.
Don't forget, on Thursdays I look at reader-requested symbols, click HERE to send me an email. I read every email I receive and try to answer them all!
Current Market Outlook:
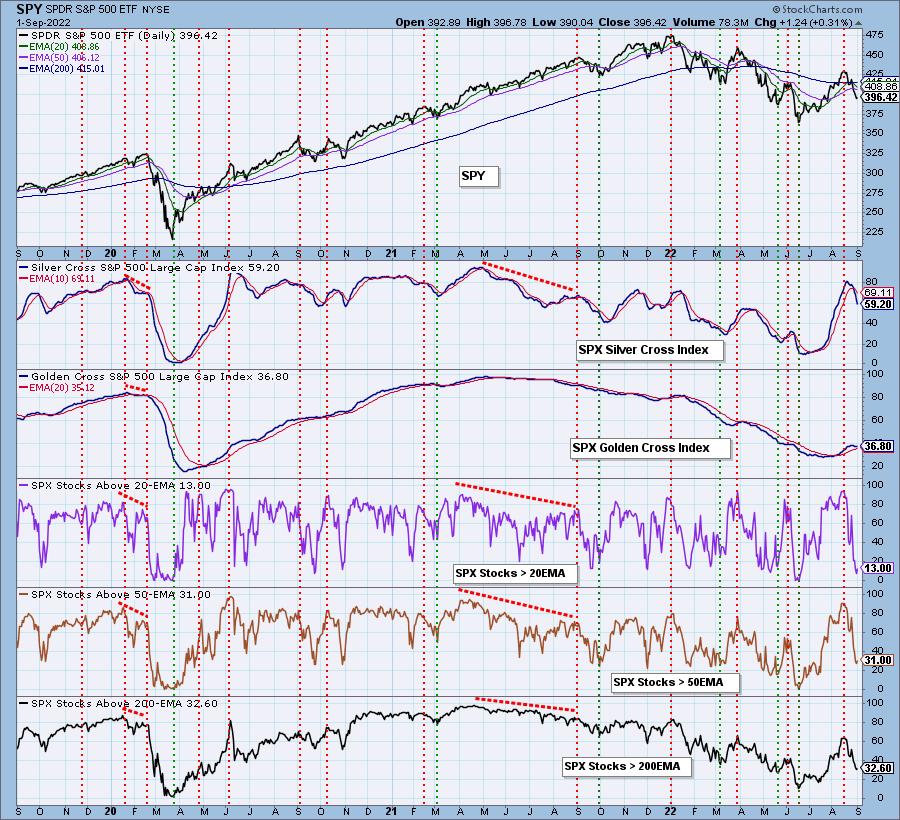
Market Environment: It is important to consider the odds for success by assessing the market tides. The following chart uses different methodologies for objectively showing the depth and trend of participation for intermediate- and long-term time frames.
- The Silver Cross Index (SCI) shows the percentage of SPX stocks on IT Trend Model BUY signals (20-EMA > 50-EMA)
- The Golden Cross Index (GCI) shows the percentage of SPX stocks on LT Trend Model BUY signals (50-EMA > 200-EMA)
Don't forget that as a "Diamonds" member, you have access to our GCI/SCI curated ChartList on DecisionPoint.com. You'll find it under "Members Only" links on the left side on the Blogs and Links Page.
Here is the current chart:
Full Disclosure: I am 15% exposed.
I'm required to disclose if I currently own a stock I mention and/or may buy/short it within the next 72 hours.
"Technical Analysis is a windsock, not a crystal ball." - Carl Swenlin
(c) Copyright 2022 DecisionPoint.com
Watch the latest episode of DecisionPoint with Carl & Erin Swenlin on Mondays 7:00p EST or on the DecisionPoint playlist on the StockCharts TV YouTube channel here!
NOTE: The stocks reported herein are from mechanical trading model scans that are based upon moving average relationships, momentum and volume. DecisionPoint analysis is then applied to get five selections from the scans. The selections given should prompt readers to do a chart review using their own analysis process. This letter is not a call for a specific action to buy, sell or short any of the stocks provided. There are NO sure things or guaranteed returns on the daily selection of "Diamonds in the Rough."
Regarding BUY/SELL Signals: The signal status reported herein is based upon mechanical trading model signals and crossovers. They define the implied bias of the price index/stock based upon moving average relationships and momentum, but they do not necessarily call for a specific action. They are information flags that should prompt chart review. Further, they do not call for continuous buying or selling during the life of the signal. For example, a BUY signal will probably (but not necessarily) return the best results if action is taken soon after the signal is generated. Additional opportunities for buying may be found as price zigzags higher, but the trader must look for optimum entry points. Conversely, exit points to preserve gains (or minimize losses) may be evident before the model mechanically closes the signal.
Helpful DecisionPoint Links:
DecisionPoint Shared ChartList and DecisionPoint Chart Gallery
Price Momentum Oscillator (PMO)
Swenlin Trading Oscillators (STO-B and STO-V)
For more links, go to DecisionPoint.com