
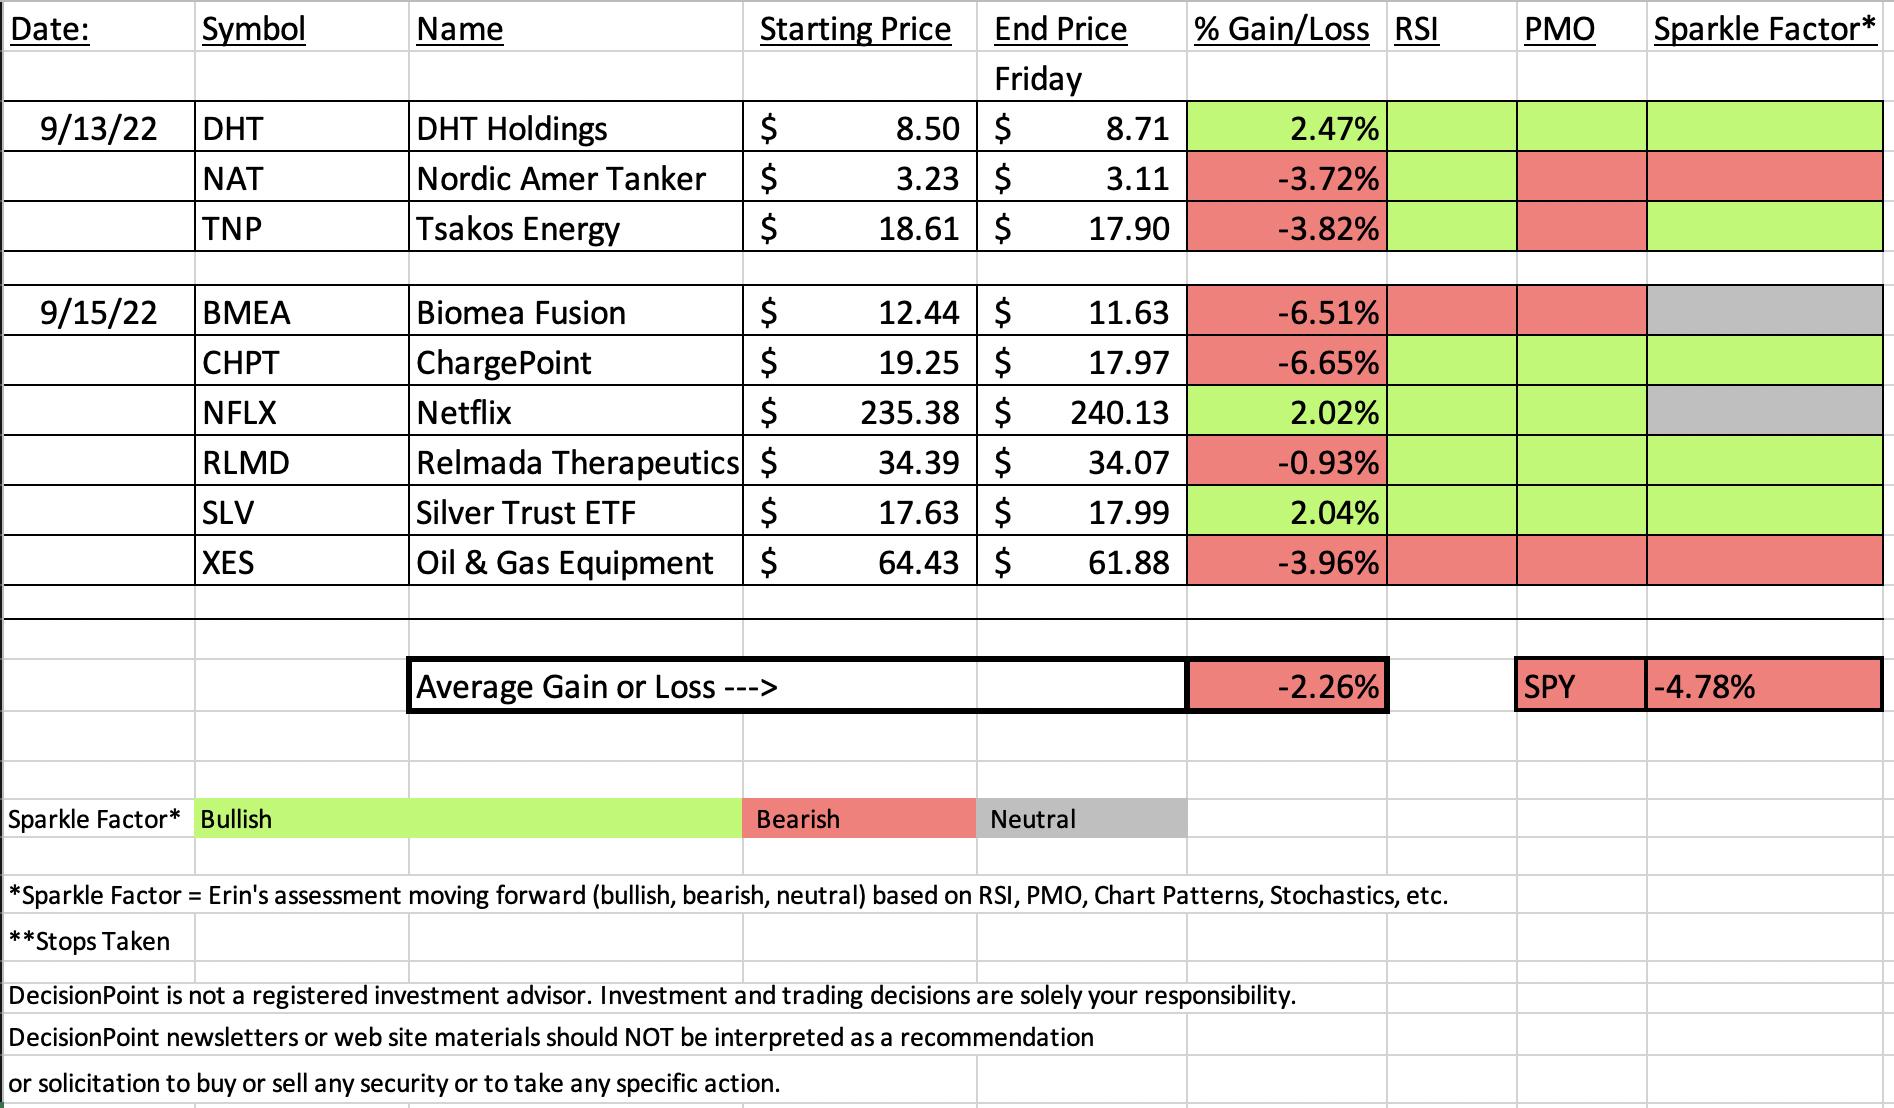
The market crashed this week down -4.78%. Many of this week's nine "Diamonds in the Rough" turned out to be 'rough'. However the three that were up all finished with a 2% gain or more.
Diamond Mine attendees won't be surprised at my selections for "Sector to Watch" and "Industry Group to Watch" as I stayed with my selections from this morning. I also have three symbols to share from that industry group.
I'm exhausted so I'm going to let the charts and commentary speak for itself.
Have a great weekend!
Good Luck & Good Trading,
Erin

TODAY'S RECORDING LINK (9/16/2022):
Topic: DecisionPoint Diamond Mine (9/16/2022) LIVE Trading Room
Start Time: Sept 9, 2022 09:00 AM
Passcode: Sept*16th
REGISTRATION For Friday 9/23 Diamond Mine:
When: Sep 23, 2022 09:00 AM Pacific Time (US and Canada)
Topic: DecisionPoint Diamond Mine (9/23/2022) LIVE Trading Room
Register in advance for this webinar HERE
Save the registration confirmation email with login instructions in case Zoom doesn't notify you in time.

Our latest DecisionPoint Trading Room recording:
A few items about the spreadsheet: I've put on the spreadsheet whether the RSI is positive (green) or negative (red). The PMO column tells you if it is rising (green) or falling (red). Finally I've added my own "Sparkle Factor" that gives you my assessment going forward, bullish (green), bearish (red) or neutral (gray). The Sparkle Factor is basically my thoughts on whether I expect it to rise or fall. A neutral means it could really go either way so it could be added to a watch list. If you're in a stock I consider "neutral" going forward, the ball is in your court.
Darling:
DHT Holdings Inc. (DHT)
EARNINGS: 10/31/2022 (AMC)
DHT Holdings, Inc. engages in the operation of a fleet of crude oil tankers. It operates through its integrated management companies in Monaco, Singapore, and Oslo, Norway. The company was founded in 2005 and is headquartered in Hamilton, Bermuda.
Predefined Scans Triggered: P&F Double Top Breakout and P&F Bullish Triangle.
Below are the commentary and chart from Tuesday (9/13):
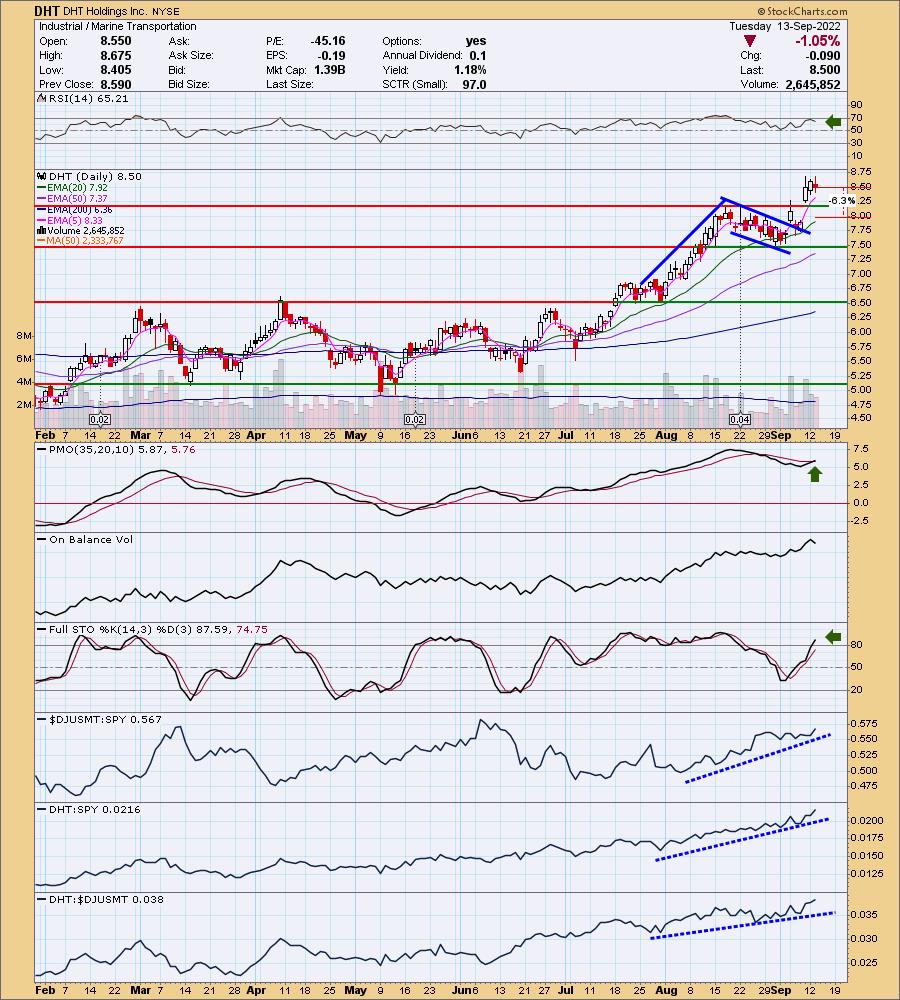
"DHT is unchanged in after hours trading. I covered DHT on June 9th 2020 (position is closed). I was impressed with this chart given the very bullish configuration of the EMAs and the breakout last week. This breakout came from a bull flag formation. The minimum upside target of the flag would be around $10. Based on the monthly chart (not included), that is an excellent place to look for price to go.
The RSI is falling, but is still positive. The PMO triggered a crossover BUY signal today. The OBV broke out with price and is thus confirming the breakout. Stochastics just moved above 80 and relative strength is excellent. The group is on fire and DHT is a top performer in that group. The stop is set right around the 20-day EMA at $7.96."
Here is today's chart:
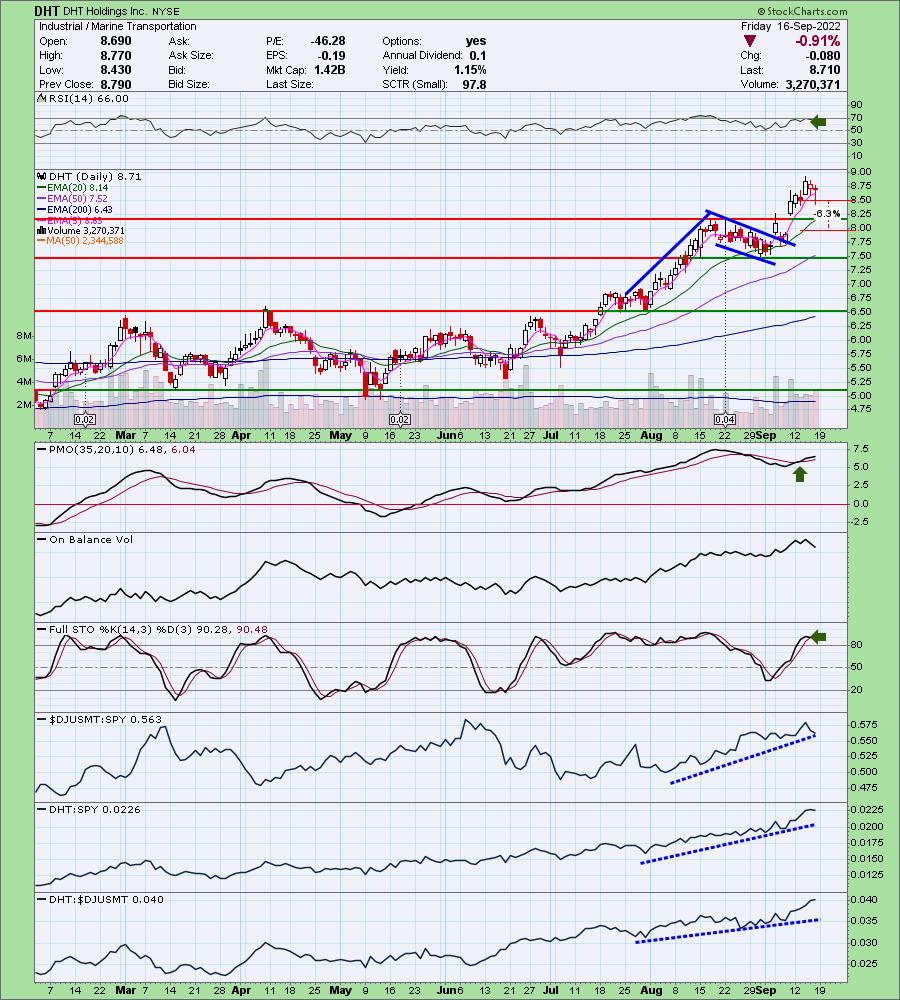
DHT is still holding its rising trend and though it finished lower today, there was a long tail on the today's candlestick. This formed a hammer and that is bullish. They usually appear at bottoms. The indicators are all healthy so I think this one has further to go.
Don't forget, on Thursdays I look at reader-requested symbols, so shoot me an email at erin@decisionpoint.com. I read every email I receive and try to answer them all!
Dud:
ChargePoint Holdings, Inc. (CHPT)
EARNINGS: 12/7/2022 (AMC)
ChargePoint Holdings, Inc. operates as an electric vehicle charging network provider. It designs, develops and markets networked electric vehicle charging system infrastructure and its Cloud Services enable consumers the ability to locate, reserve, authenticate and transact electric vehicle charging sessions. The firm provides an open platform providing real-time information about charging sessions and control, support and management of the networked charging systems. This network provides multiple web-based portals for charging system owners, fleet managers, drivers and utilities. The company was founded in 2007 and is headquartered in Campbell, CA.
Predefined Scans Triggered: Stocks in a New Uptrend (ADX), Moved Above Upper Bollinger Band, Stocks in a New Uptrend (Aroon), Moved Above Upper Price Channel, P&F Ascending Triple Top Breakout and P&F Double Top Breakout.
Here are the commentary and chart from yesterday (9/15):
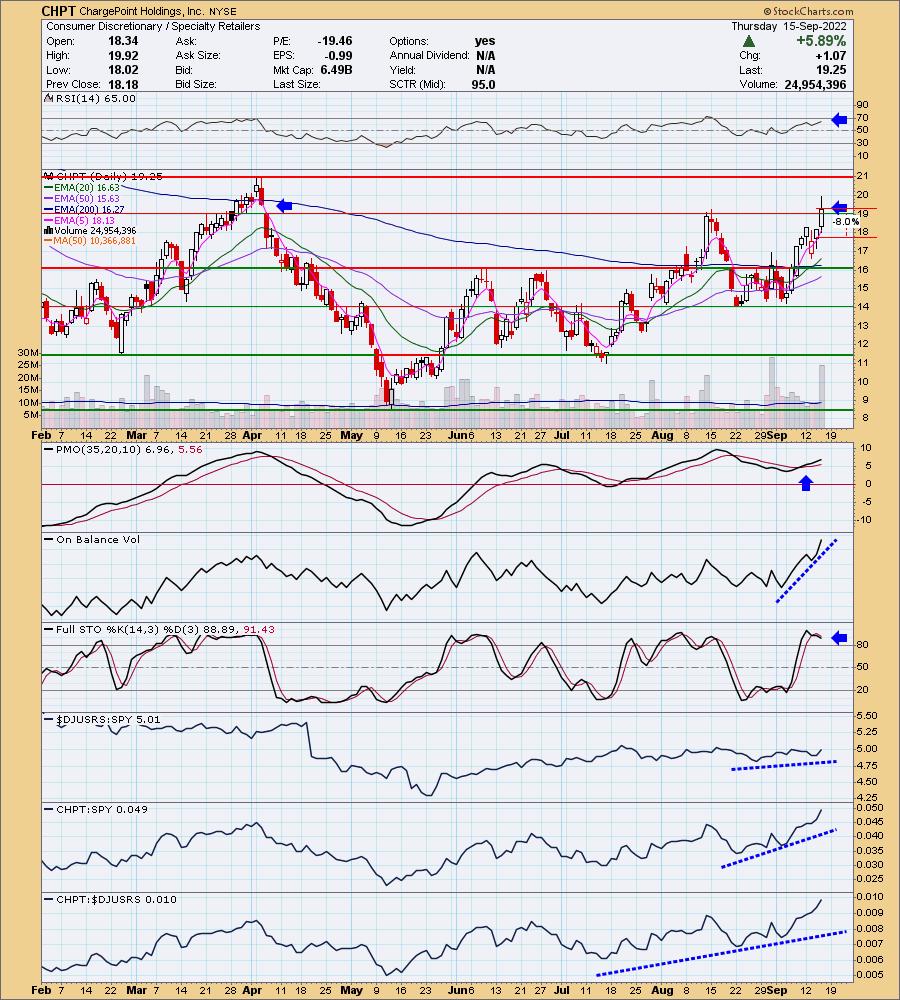
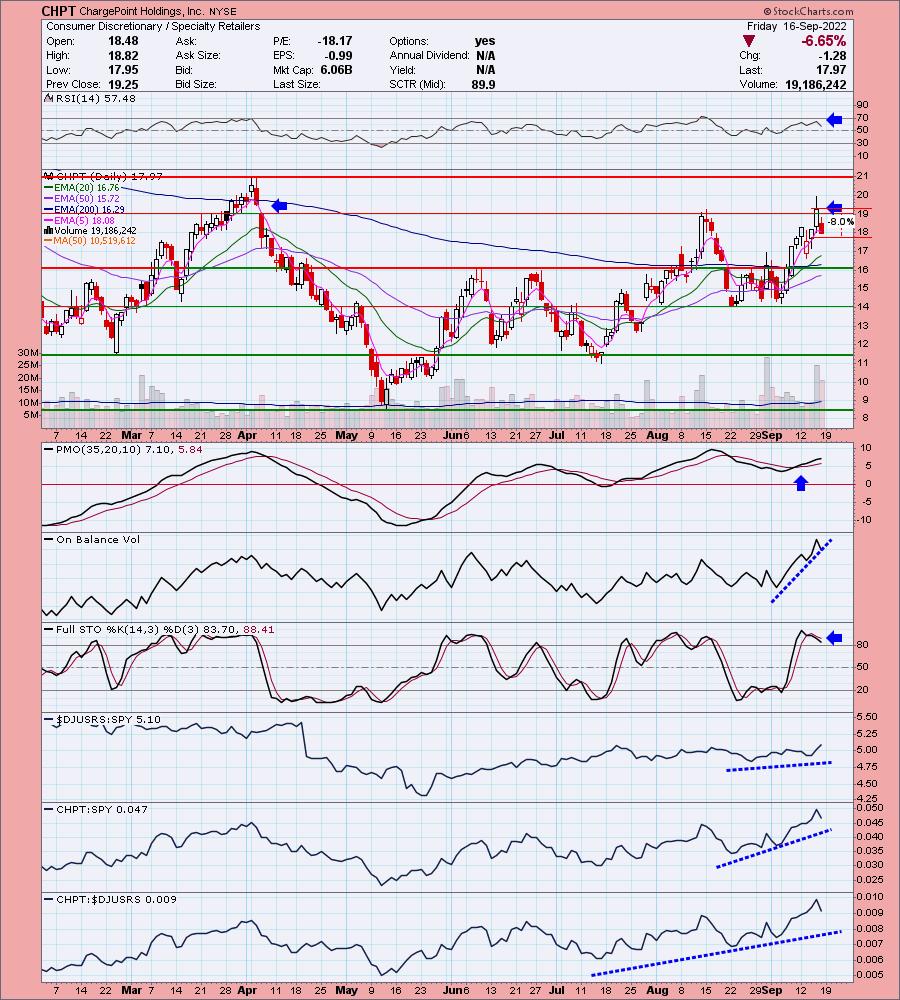
"CHPT is down -1.04% in after hours trading. I like this breakout, but I don't like that it is so far down in after hours trading. I covered it last on August 11th 2022. This breakout was good, but we really need the breakout above the April high. Given the indicators, I believe we will. The RSI is positive and not overbought. The PMO is on a crossover SELL signal. Volume is coming in like crazy! The group isn't performing, but CHPT is doing fairly well. They build charging stations so this one will be a good long-term hold when we recover from this bear market. I set the stop around 8% or $17.71."
Here is today's chart:
Today's decline was harsh to say the least. The decline means we have a failed breakout. However, the indicators aren't terrible. It just had a really bad day. It was up +5.89% yesterday so that also explains why the depth of the decline didn't really harm the indicators. The short-term rising trend is still intact and overall relative performance is still good.
(Full Disclosure: I own it.)
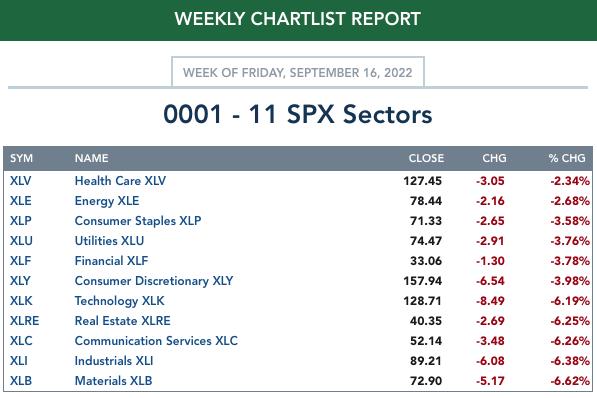
THIS WEEK's Sector Performance:
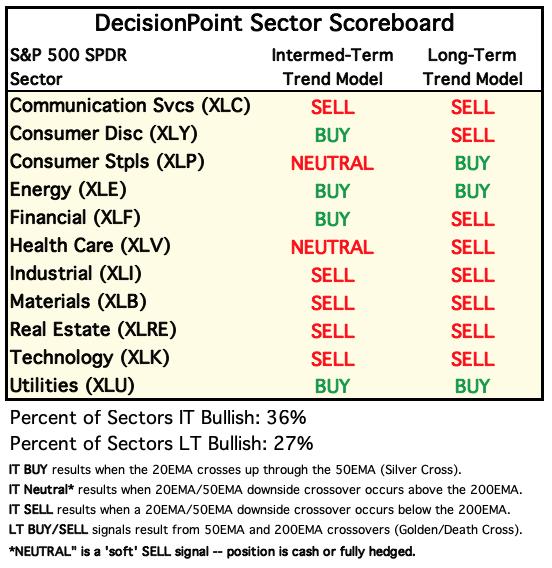
DecisionPoint Sector Scoreboard (Mechanical Trend Model Signals):
Click Here to view Carl's annotated Sector ChartList!
RRG® Daily Chart ($ONE Benchmark):
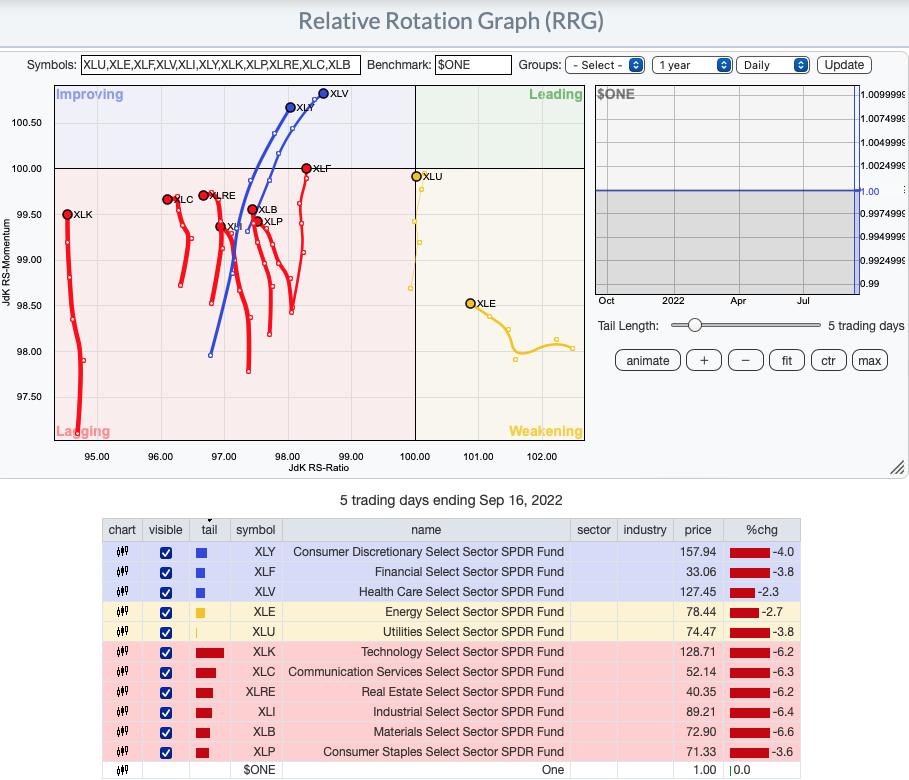
A rough week meant a bearish change on the daily RRG. We now have bearish southwest headings on XLC and XLRE. Even XLU has reversed into a bearish southwest heading. It could hit the Lagging quadrant next week instead of moving into Leading. The most bullish would have to be XLV and XLY with XLF not far behind as it gets reading to join the other two in the Improving quadrant. The rest have northward components to their headings and could still move into the Improving quadrant.
RRG® Weekly Chart ($ONE Benchmark):
The intermediate-term RRG is still mostly bullish given all but XLE are in either Leadings or Improving quadrants. As with the daily RRG, we have some headings that have switched into a bearish southwest direction: XLP and XLV. XLRE and XLC are about ready to change into that bearish heading. They are already on their way back into the Lagging quadrant. All others still have an opportunity to reach the Leading quadrant and join the strongest of the sectors, XLU. XLE has a strong bullish northeast heading that should get it to the Leading quadrant soon.
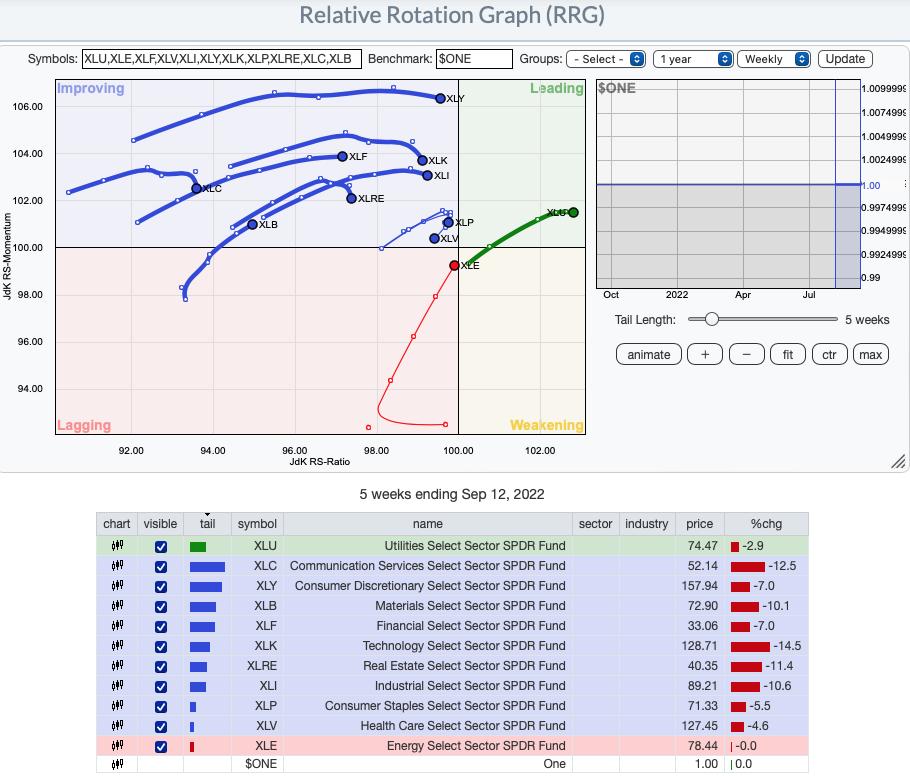
RRG® charts show you the relative strength and momentum for a group of stocks. Stocks with strong relative strength and momentum appear in the green Leading quadrant. As relative momentum fades, they typically move into the yellow Weakening quadrant. If relative strength then fades, they move into the red Lagging quadrant. Finally, when momentum starts to pick up again, they shift into the blue Improving quadrant.
CLICK HERE for an animated version of the RRG charts.
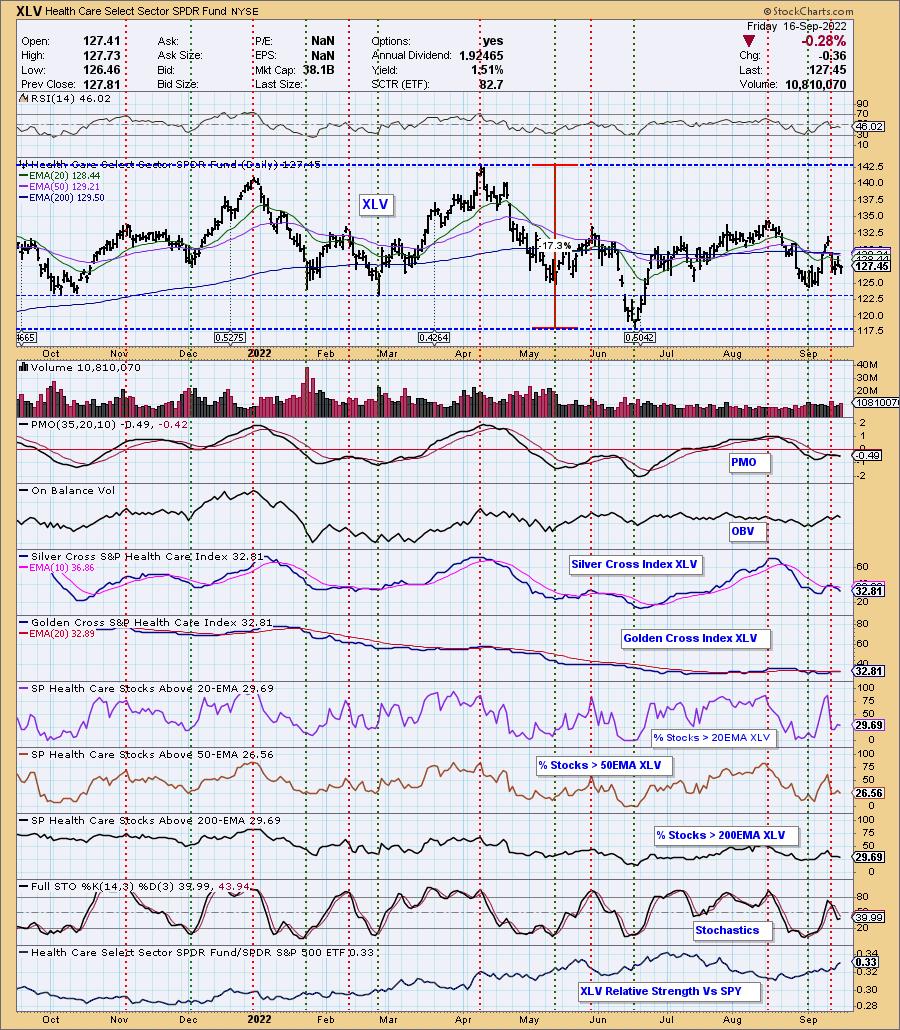
Sector to Watch: Healthcare (XLV)
While XLV hasn't had an easy time, none of the sectors have. Choosing the Sector to Watch was challenging given none of the sectors carry positive momentum. It came down to outperformance against the SPY and participation readings not deteriorating further today. Not surprisingly, there are problems on this chart. The RSI is negative and has topped. The PMO topped and moved into a whipsaw SELL signal. It hasn't been able to recapture the signal line, but at least the margin is very thin. Stochastics actually twitched up. %Stocks indicators are lower than the Silver Cross Index (SCI) and Golden Cross Index (GCI), meaning this is far from an improving chart. Most of the industry groups aren't fairing well, but one does have some promise...
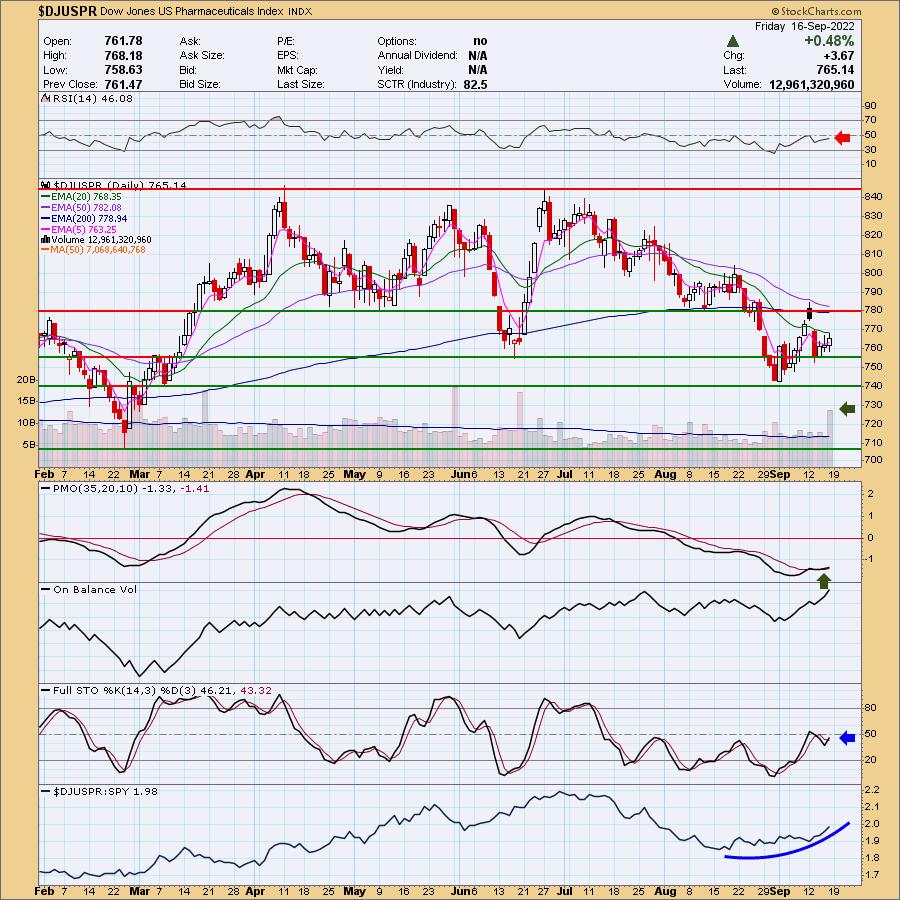
Industry Group to Watch: Pharmaceuticals ($DJUSPR)
Not a pretty chart either, but it does have some bullish characteristics. The RSI is negative, but gently rising. The PMO is on a rather new crossover BUY signal. Stochastics have turned up and volume is coming in strong. It's increasing its outperformance of the SPY. It is in a declining trend still, but support is holding at the June low. I'm not suggesting you should buy, but there were a few symbols that I found interesting in the Diamond Mine this morning: Bristol-Meyers (BMY), Johnson & Johnson (JNJ) and Merck (MRK).
Go to our Sector ChartList on DecisionPoint.com to get an in-depth view of all the sectors. On StockCharts.com you can find the Industry Summary.
Have a great weekend! Good Luck & Good Trading!
- Erin
erin@decisionpoint.com
Full Disclosure: I'm 30% exposed with one hedge, PFIX. I changed up my portfolio, closed a position and halved another one so I could add CHPT and SLV.
Watch the latest episode of DecisionPoint with Carl & Erin Swenlin on Mondays 7:00p EST or on the DecisionPoint playlist on the StockCharts TV YouTube channel here!
Technical Analysis is a windsock, not a crystal ball. --Carl Swenlin
NOTE: The stocks reported herein are from mechanical trading model scans that are based upon moving average relationships, momentum and volume. DecisionPoint analysis is then applied to get five selections from the scans. The selections given should prompt readers to do a chart review using their own analysis process. This letter is not a call for a specific action to buy, sell or short any of the stocks provided. There are NO sure things or guaranteed returns on the daily selection of "diamonds in the rough."
Helpful DecisionPoint Links:
DecisionPoint Shared ChartList and DecisionPoint Chart Gallery
Price Momentum Oscillator (PMO)
Swenlin Trading Oscillators (STO-B and STO-V)
(c) Copyright 2022 DecisionPoint.com