
I hit the jury duty lottery today! My panel was excused right after lunch so I'm able to write from home rather than in an uncomfortable jury room.
There were lots of selections from my "Momentum Sleepers" scan so I used it exclusively to pick out today's "Diamonds in the Rough". The basic difference of the scan is that I speed up the parameters of the PMO. There are plenty of other conditions to this proprietary scan.
There were numerous filled black candlesticks on the scan results. These are bearish one day patterns so I opted not to include them. On the bright side, there were a ton of bullish double-bottoms and I even found a positive OBV divergence. The list of "Runner-ups" is long, but I think you'll want to review them.
I'm ready to expand my exposure and would have done so today if not for jury duty. Tomorrow I'll be searching 5-minute charts on today's "Diamonds in the Rough" as well as some from my own watch list if the timing is right.
YANG, the China hedge ETF is still in my portfolio and I will make a determination tomorrow whether keeping it makes sense (basically looking at the top ten holdings charts). It's been a fine hedge so far.
Good Luck & Good Trading!
Erin
Today's "Diamonds in the Rough": CLX, RBC and SBGI.
Runner-ups: AIF, ARGX, BDC, CASY, CBRL, CBT, CHE, HCCI, MTZ, OEC and SLGN.

We didn't have a Diamond Mine trading room last week due to my appearance at ChartCon so here is the prior link:
RECORDING LINK (10/14/2022):
Topic: DecisionPoint Diamond Mine (10/14/2022) LIVE Trading Room
Passcode: October#14
REGISTRATION LINK (10/21/2022):
When: Oct 21, 2022 09:00 AM Pacific Time (US and Canada)
Topic: DecisionPoint Diamond Mine (10/21/2022) LIVE Trading Room
Register in advance for this webinar HERE
After registering, you will receive a confirmation email containing information about joining the webinar.

Here is the Monday 10/17 recording:
Welcome to DecisionPoint Diamonds, wherein I highlight ten "Diamonds in the Rough" per week. These are selected from the results of my DecisionPoint Scans which search for stocks that could benefit from the trend and condition of the market. Remember, these are not recommendations to buy or sell, but are the most interesting of the stocks that surfaced in my scans. My objective is to save you the work of the initial, tedious culling process, but you need to apply your own analysis to see if these stocks pique your interest as well. There are no guaranteed winners here!
"Predefined Scans Triggered" are taken from StockCharts.com using the "Symbol Summary" option instead of a "SharpChart" on the workbench.
Clorox Co. (CLX)
EARNINGS: 11/1/2022 (AMC)
The Clorox Co. engages in the manufacture and marketing of consumer and professional products. It operates through the following business segments: Health and Wellness, Household, Lifestyle, and International. The Health and Wellness segment consists of cleaning products, professional products and vitamins, minerals and supplements mainly marketed and sold in the United States. The Household segments consists of bags and wraps, grilling products and cat litter marketed and sold in the United States. The Lifestyle segment refers to food, natural personal care products and water-filtration products marketed and sold in the United States. The International segment covers products sold outside the United States, excluding natural personal care products. The company was founded by Edward Hughes, Charles Husband, William Hussey, Rufus Myers, and Archibald Taft on May 3, 1913 and is headquartered in Oakland, CA.
Predefined Scans Triggered: None.
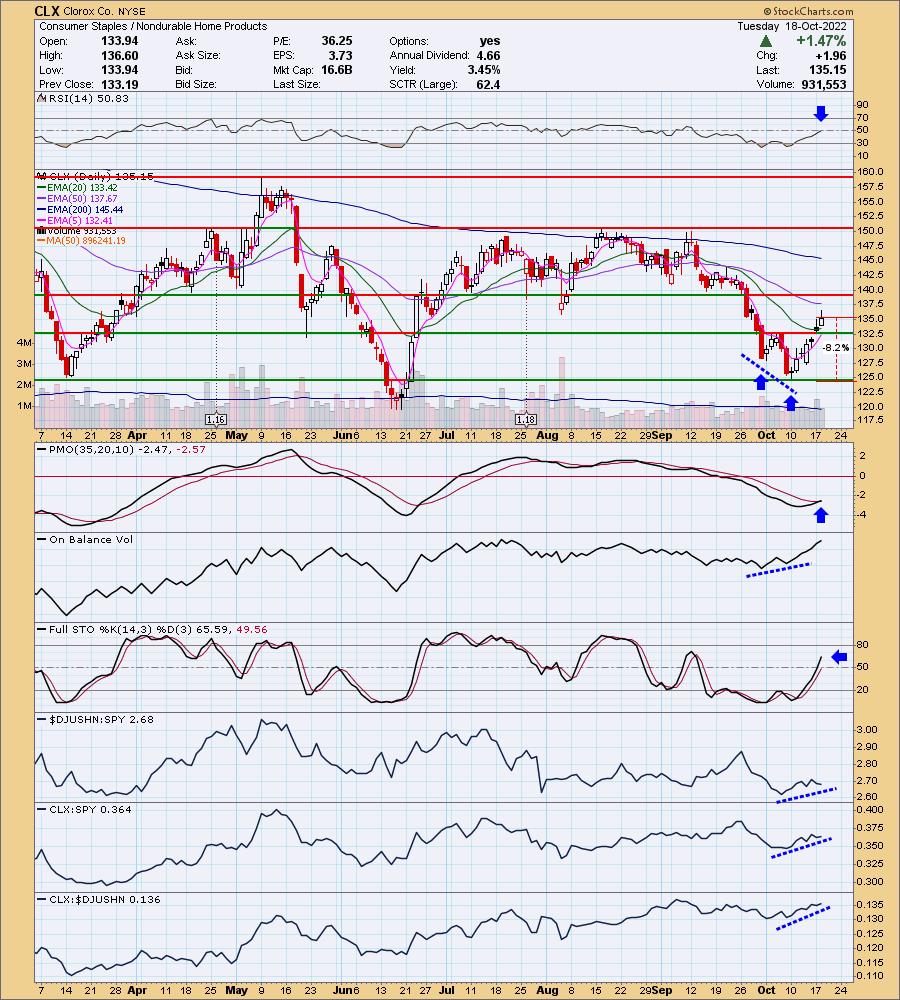
CLX is up +1.13% in after hours trading. One of the deciding factors on picking this one was the positive OBV divergence that led into this rally. Granted the rally has run hot already, but it is a stronger base with that divergence in my opinion. The PMO just triggered a crossover BUY signal and the RSI just moved above net neutral (50). Stochastics are rising strongly and relative strength is consistent across the board for the group and CLX. The stop is set just below support at about 8.2% around $124.07.
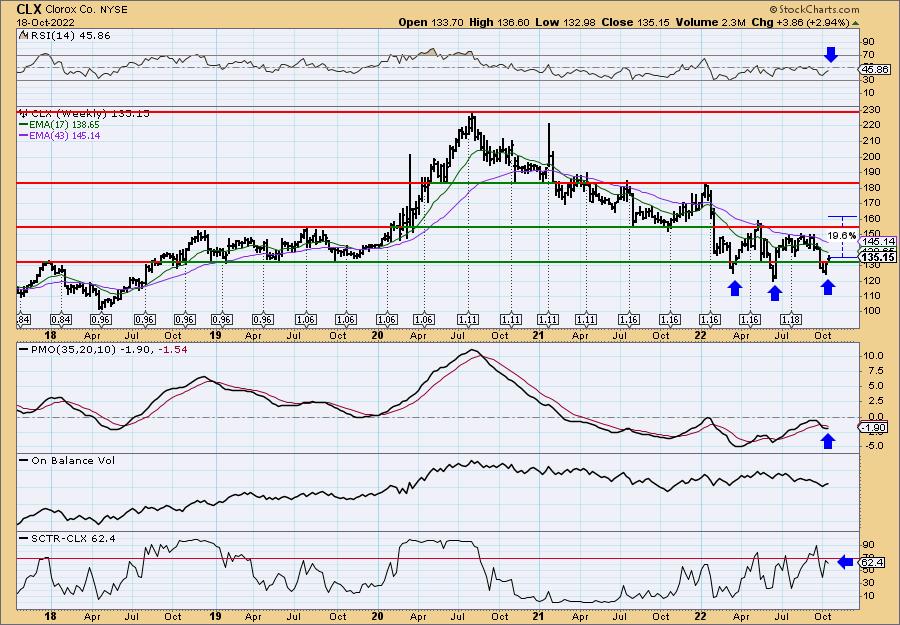
The weekly PMO is decelerating and should turn back up this week or next if the rally continues. The weekly RSI is negative, but rising. We appear to be forming a triple-bottom pattern. You don't see these too often so I can't speak for their success, but even if we are just looking at it as a trading range, price is near the bottom of the range and should at least move back to the top of it. If it can overcome resistance, the upside potential would be over 19%.
RBC Bearings Inc. (RBC)
EARNINGS: 11/10/2022 (BMO)
RBC Bearings, Inc. engages in the design, manufacture, and marketing of engineered precision bearings and products. It operates through the Aerospace and Defense, and Industrial segments. The Aerospace and Defense segment represents the end markets for the company's highly engineered bearings and precision components used in commercial aerospace, defense aerospace, and sea and ground defense applications. The Industrial segment refers to the end markets for the company's highly engineered bearings, gearings and precision components used in various industrial applications including power transmission, construction, mining, energy and specialized equipment manufacturing, semiconductor production equipment manufacturing, agricultural machinery, commercial truck and automotive manufacturing, and tool holding. The company was founded in 1919 and is headquartered in Oxford, CT.
Predefined Scans Triggered: New CCI Buy Signals, Parabolic SAR Buy Signals and Entered Ichimoku Cloud.
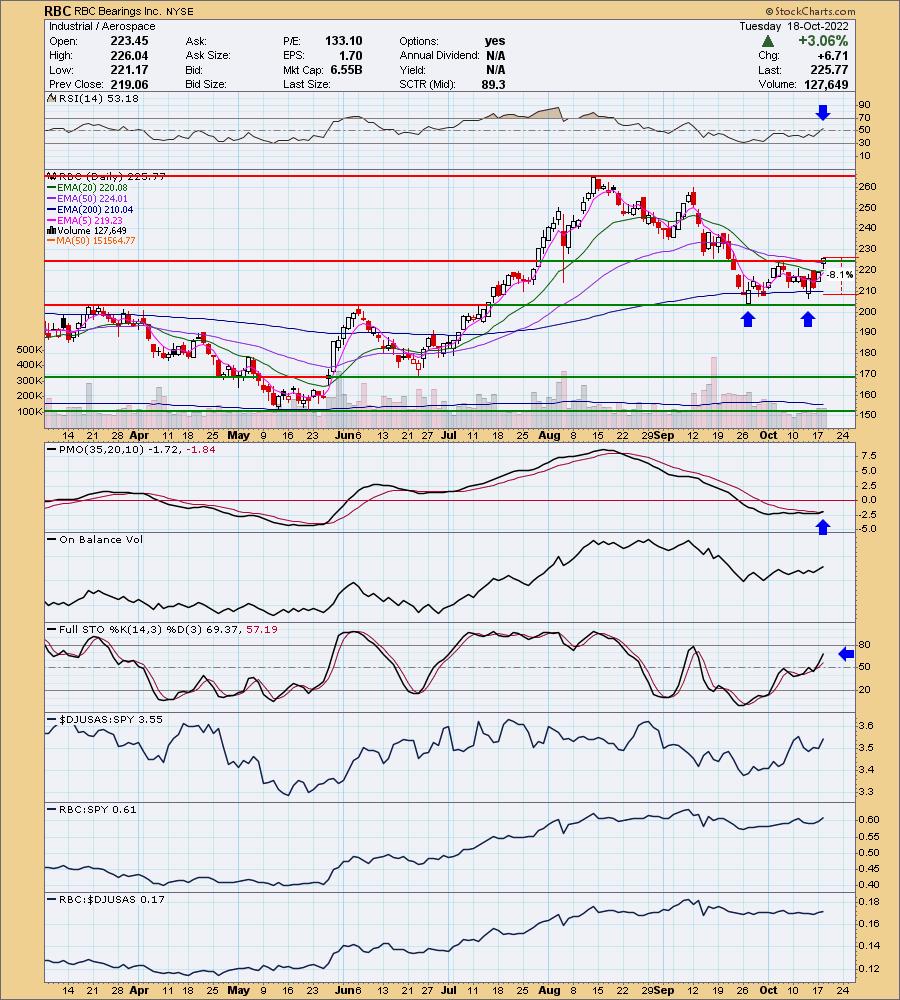
RBC is unchanged in after hours trading. Price has confirmed the bullish double-bottom with a breakout above the confirmation line. It also leapt above the 20/50-day EMAs in the process. The RSI just moved into positive territory and the PMO has triggered a crossover BUY signal today. Stochastics are rising nicely. Relative strength could be a bit better for RBC, but it is not underperforming. I set the stop below the 200-day EMA at 8.1% or around $207.48.
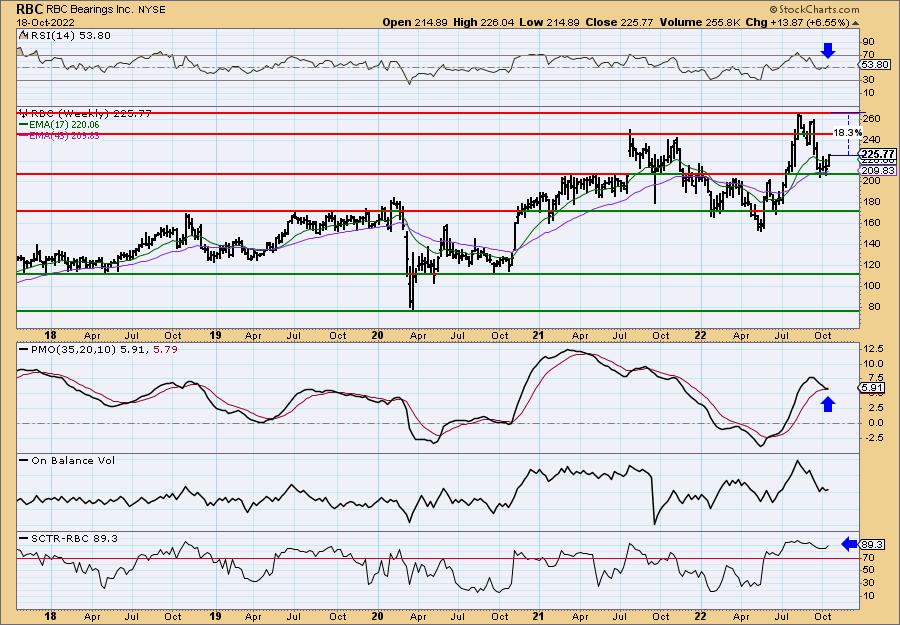
The weekly PMO is so far avoiding a negative crossover. If this rally is for real, it will turn back up above the signal line. The weekly RSI is rising in positive territory and RBC has a respectable SCTR of 89.3%. We also note that OBV bottoms are confirming the rally on the weekly chart.
Sinclair Broadcast Group, Inc. (SBGI)
EARNINGS: 11/2/2022 (BMO)
Sinclair Broadcast Group, Inc. is a media company engaged in the provision of local sports and news. It operates through the following segments: Broadcast, Local Sports, and Others. The Broadcast segment consists of television stations which offer programming and operating services, and sales and other non-programming operating services. The Local Sports segment consists of regional sports networks, the Marquee Sports Network, Yankee Entertainment, and Sports Network LLC. The company was founded by Julian Sinclair Smith in 1986 and is headquartered in Hunt Valley, MD.
Predefined Scans Triggered: Declining Chaikin Money Flow.
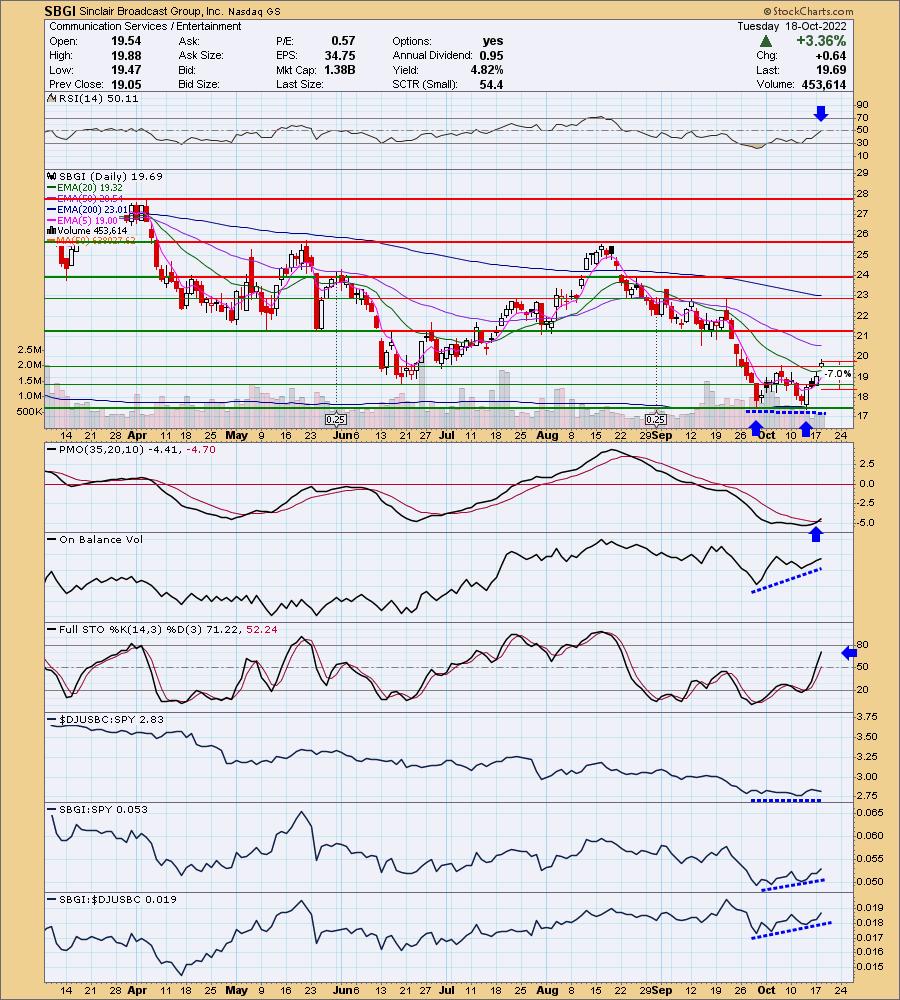
SBGI is down -0.91% in after hours trading. I picked this one for a few reasons. First we have a bullish double-bottom confirmed on a breakout above the confirmation line and the 20-day EMA. Second, there is an OBV positive divergence between price lows and OBV bottoms. Additionally, the PMO just triggered a crossover BUY signal and Stochastics are rising strongly. The rub is that the group isn't performing well. It is performing inline with the SPY right now which I don't like in a bear market, but with the market reversing, performing as well as the SPY will likely be a good thing. The stop is set at 7%, just below the June low, around $18.31.
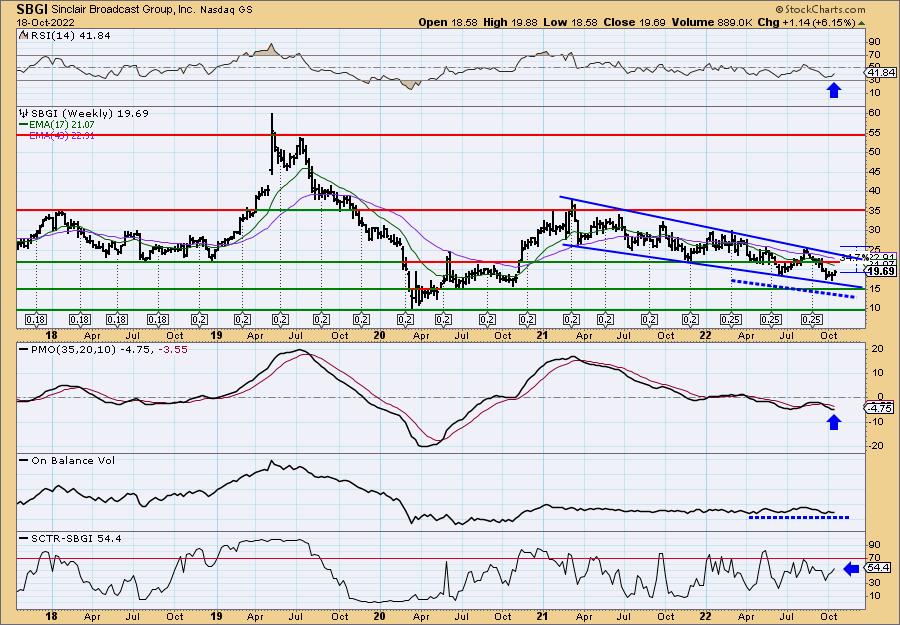
Upside potential also sold me on this "Diamond in the Rough". If it reaches the August top, that would be a hefty 34.7% rise. I consider the weekly OBV to have a positive divergence with price lows. The weekly PMO is turning back up. The weekly RSI is negative, but rising. There is a very large bullish falling wedge on the chart as well. The SCTR isn't great, but it is rising.
Don't forget, on Thursdays I look at reader-requested symbols, click HERE to send me an email. I read every email I receive and try to answer them all!
Current Market Outlook:
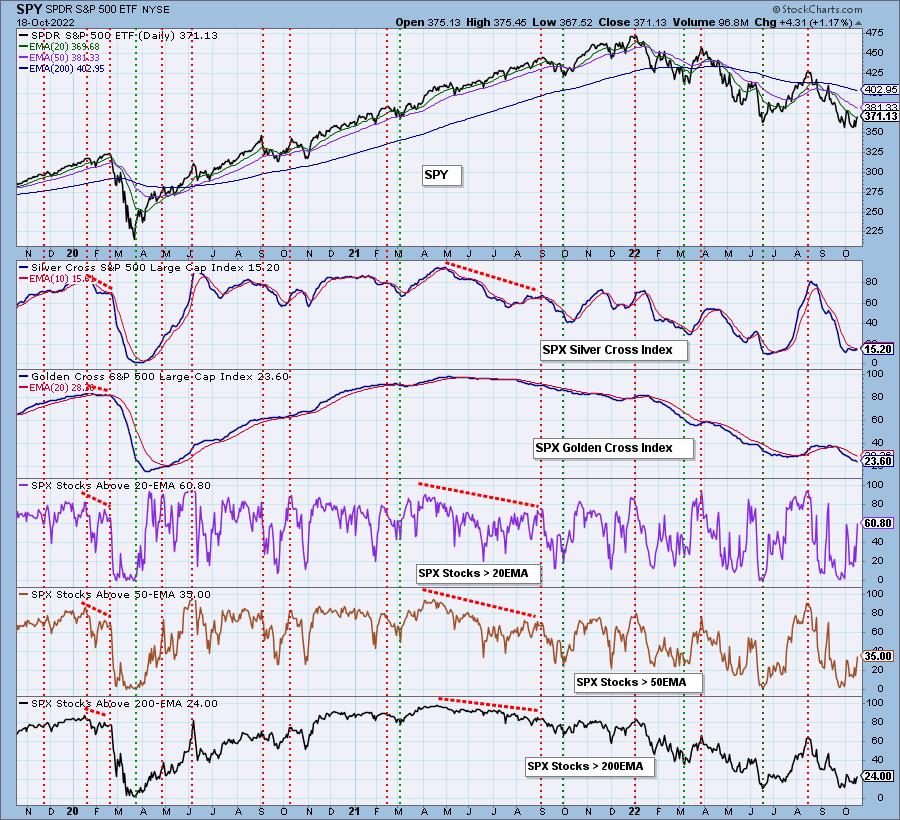
Market Environment: It is important to consider the odds for success by assessing the market tides. The following chart uses different methodologies for objectively showing the depth and trend of participation for intermediate- and long-term time frames.
- The Silver Cross Index (SCI) shows the percentage of SPX stocks on IT Trend Model BUY signals (20-EMA > 50-EMA)
- The Golden Cross Index (GCI) shows the percentage of SPX stocks on LT Trend Model BUY signals (50-EMA > 200-EMA)
Don't forget that as a "Diamonds" member, you have access to our GCI/SCI curated ChartList on DecisionPoint.com. You'll find it under "Members Only" links on the left side on the Blogs and Links Page.
Here is the current chart:
Full Disclosure: I am 10% exposed with a 5% hedge. I will be expanding my exposure tomorrow morning to reach 40% exposed with 5% hedge. Be careful out there!
I'm required to disclose if I currently own a stock I mention and/or may buy/short it within the next 72 hours.
"Technical Analysis is a windsock, not a crystal ball." - Carl Swenlin
(c) Copyright 2022 DecisionPoint.com
Watch the latest episode of DecisionPoint with Carl & Erin Swenlin on Mondays 7:00p EST or on the DecisionPoint playlist on the StockCharts TV YouTube channel here!
NOTE: The stocks reported herein are from mechanical trading model scans that are based upon moving average relationships, momentum and volume. DecisionPoint analysis is then applied to get five selections from the scans. The selections given should prompt readers to do a chart review using their own analysis process. This letter is not a call for a specific action to buy, sell or short any of the stocks provided. There are NO sure things or guaranteed returns on the daily selection of "Diamonds in the Rough."
Regarding BUY/SELL Signals: The signal status reported herein is based upon mechanical trading model signals and crossovers. They define the implied bias of the price index/stock based upon moving average relationships and momentum, but they do not necessarily call for a specific action. They are information flags that should prompt chart review. Further, they do not call for continuous buying or selling during the life of the signal. For example, a BUY signal will probably (but not necessarily) return the best results if action is taken soon after the signal is generated. Additional opportunities for buying may be found as price zigzags higher, but the trader must look for optimum entry points. Conversely, exit points to preserve gains (or minimize losses) may be evident before the model mechanically closes the signal.
Helpful DecisionPoint Links:
DecisionPoint Shared ChartList and DecisionPoint Chart Gallery
Price Momentum Oscillator (PMO)
Swenlin Trading Oscillators (STO-B and STO-V)
For more links, go to DecisionPoint.com