
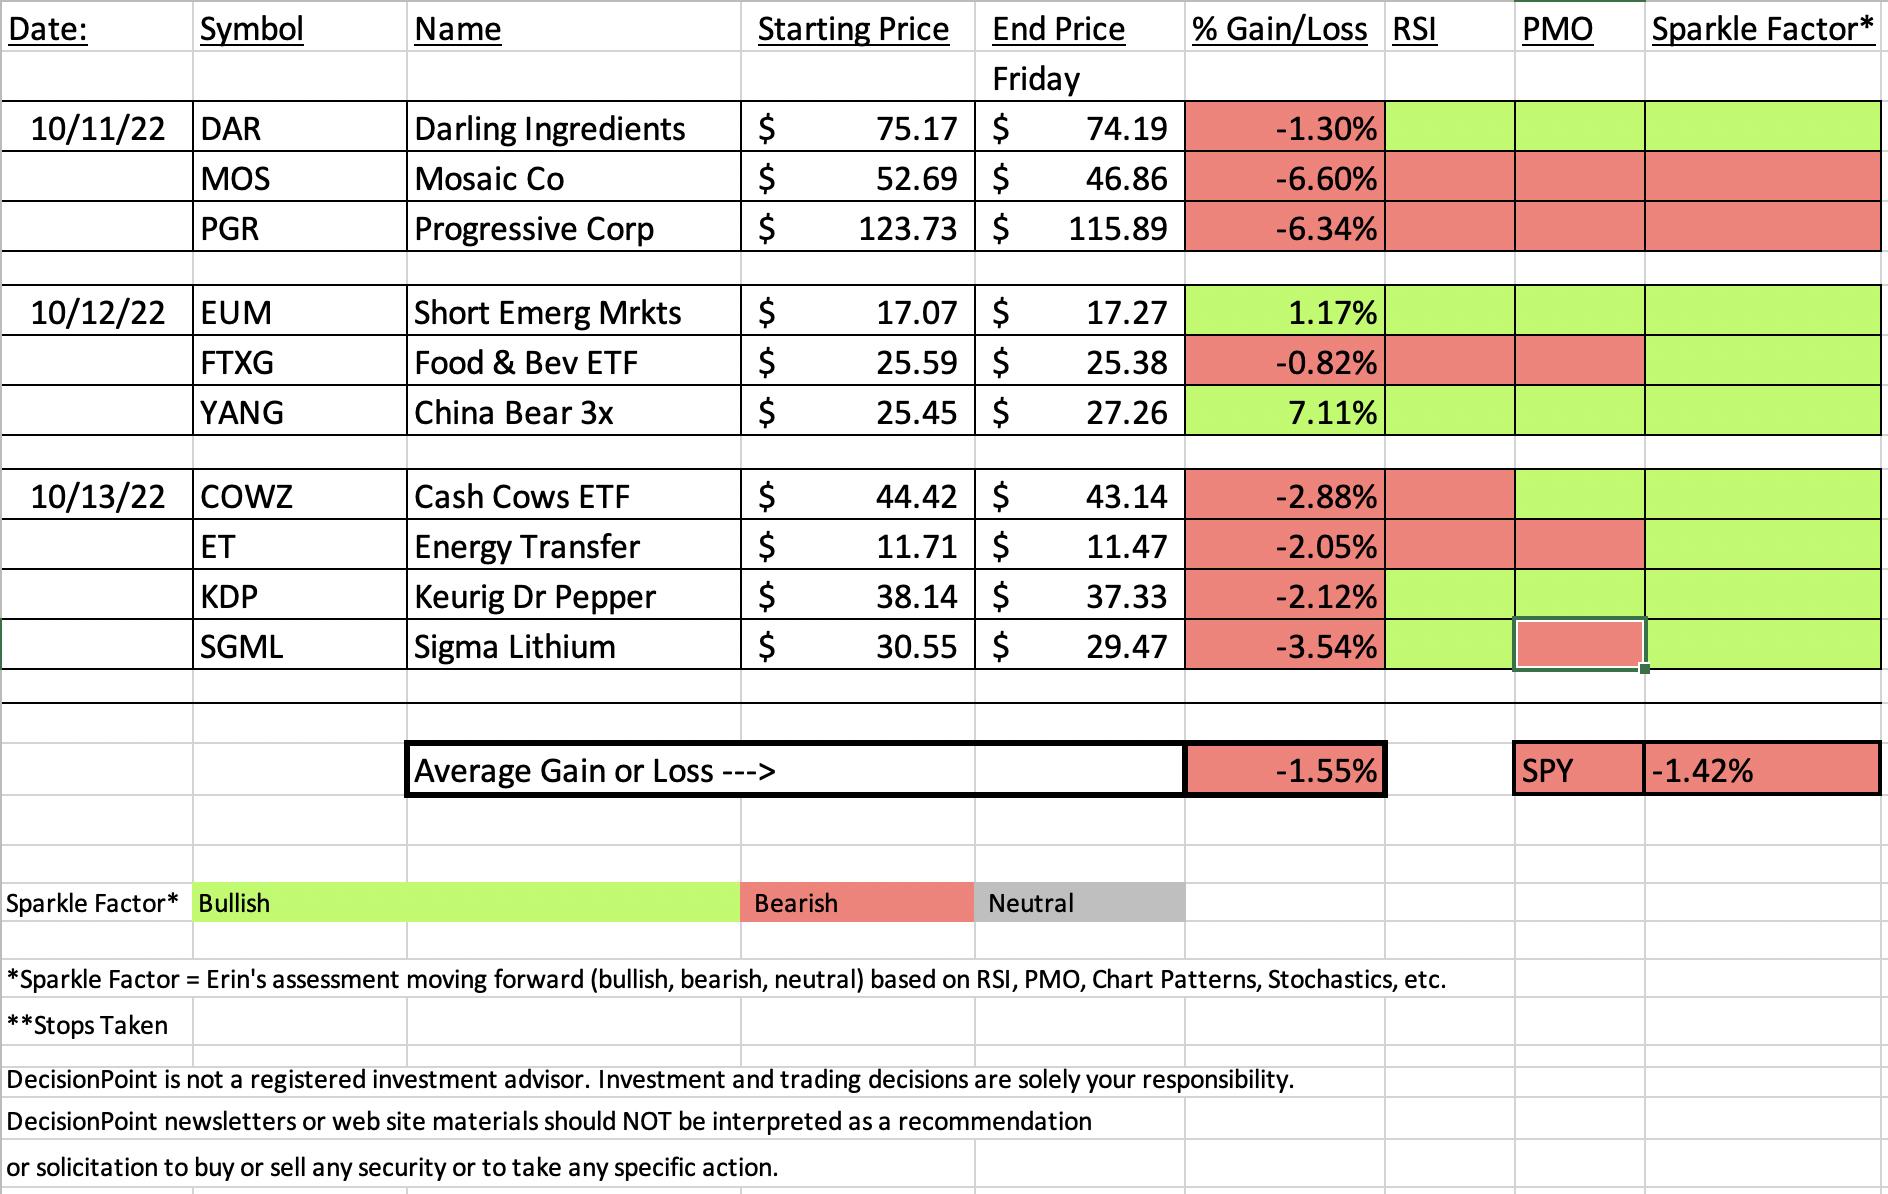
We saw a big snapback today that took back most of the gains from yesterday. "Diamonds in the Rough" struggled but ultimately finished about the same as the SPY.
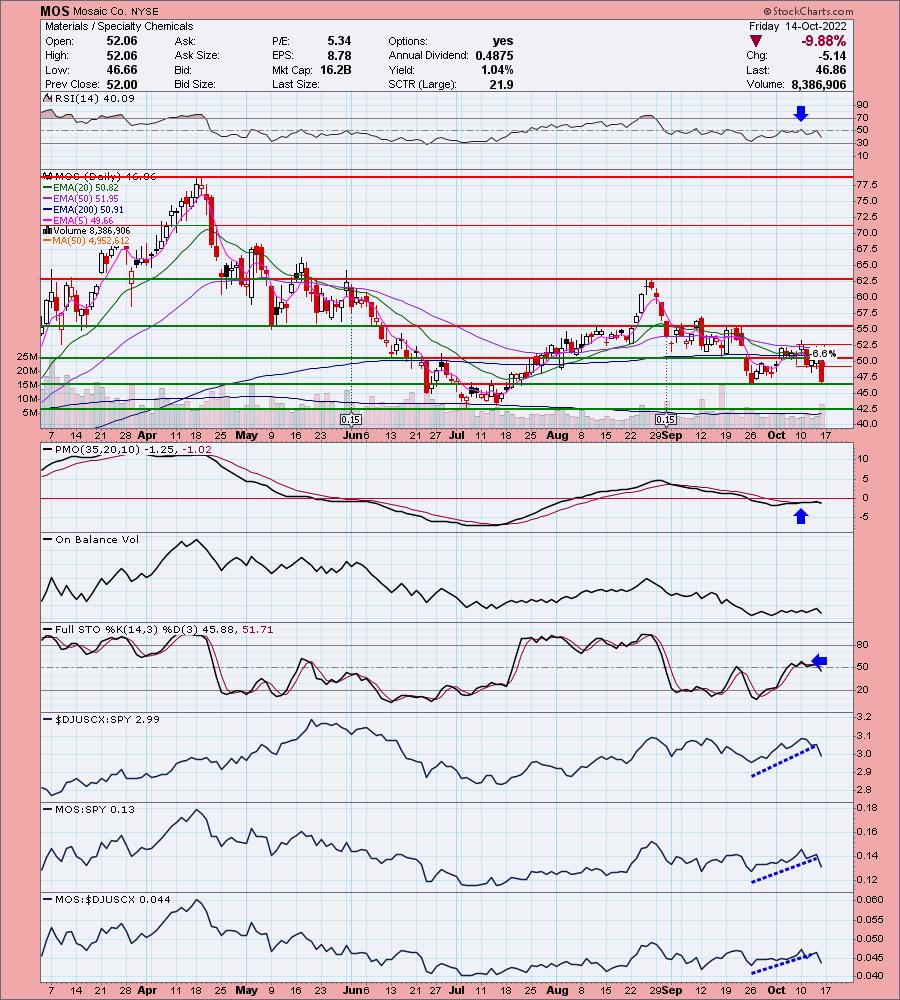
This week's "Darling" was the 3x Inverse of China (YANG). Not surprising that an inverse won the week given the rocky road that was this week's trading. This week's "Dud" would be Mosaic (MOS) which had a hard reversal after it was picked, triggering the 6.6% stop today. Ultimately it was down over 11% this week.
The bear market is in force and volatility is dizzying. Based on this week's stock/ETF picks, it seems wise to continue to limit exposure and put a hedge on if you must be invested.
I'm still at 10% exposed with a 5% hedge.
Have a great weekend!
Good Luck & Good Trading,
Erin

TODAY'S RECORDING LINK (9/30/2022):
Topic: DecisionPoint Diamond Mine (9/30/2022) LIVE Trading Room
Start Time: Sept 30, 2022 09:00 AM
Passcode: October#14
NEXT DIAMOND MINE Trading Room on October 21st
When: Oct 21, 2022 09:00 AM Pacific Time (US and Canada)
Topic: DecisionPoint Diamond Mine (10/21/2022) LIVE Trading Room
Register in advance for this webinar HERE
Save the registration confirmation email with login instructions in case Zoom doesn't notify you in time.

Our latest DecisionPoint Trading Room recording:
A few items about the spreadsheet: I've put on the spreadsheet whether the RSI is positive (green) or negative (red). The PMO column tells you if it is rising (green) or falling (red). Finally I've added my own "Sparkle Factor" that gives you my assessment going forward, bullish (green), bearish (red) or neutral (gray). The Sparkle Factor is basically my thoughts on whether I expect it to rise or fall. A neutral means it could really go either way so it could be added to a watch list. If you're in a stock I consider "neutral" going forward, the ball is in your court.
Darling:
Direxion Daily FTSE China Bear 3x Shares (YANG)
EARNINGS: N/A
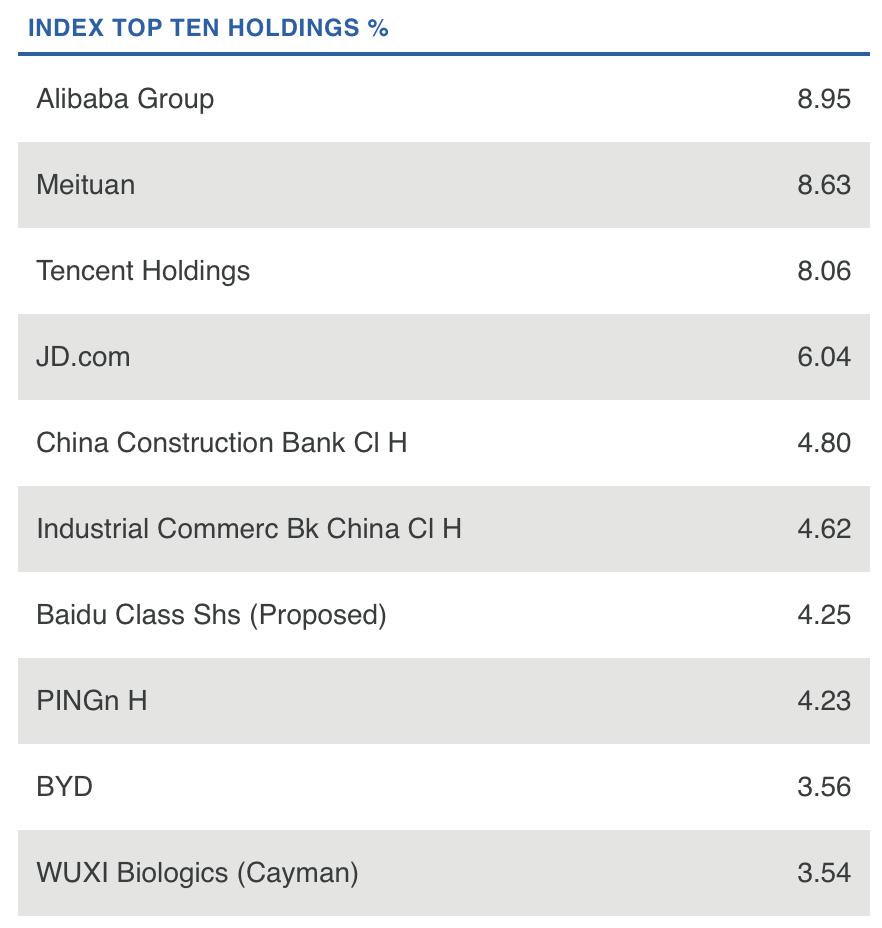
YANG provides daily 3x inverse leveraged exposure to a market-cap-weighted index of the 50 largest Chinese stocks traded in Hong Kong. Click HERE for more information.
Predefined Scans Triggered: Bullish MACD Crossovers and Moved Above Ichimoku Cloud.
Below are the commentary and chart from Wednesday:
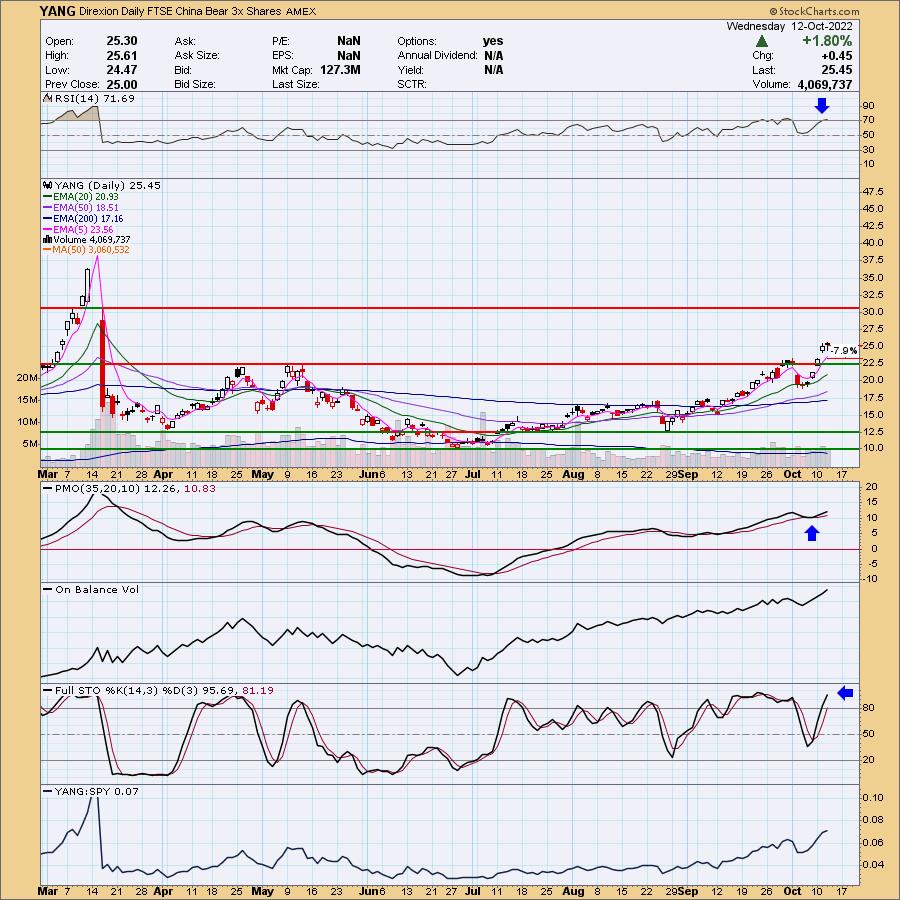
"YANG is up +0.04% in after hours trading. You'll notice that there is some overlap between this ETF and the short Emerging Markets ETF (EUM). If you have a higher risk appetite, you could certainly short some of these holdings yourself without having to be exposed to a 3x short ETF. The chart is enticing (this is on my buy list for tomorrow). The RSI is overbought, but we've seen similar in March. We just want to be careful should it reach the heights it did back then before the deep drop. The PMO has bottomed above its signal line (or whipsawed) which is especially bullish. Stochastics are rising strongly above 80. The OBV is confirming this rising trend and it is outperforming the SPY in a big way. The stop is set below gap support around 7.9% or $23.44."
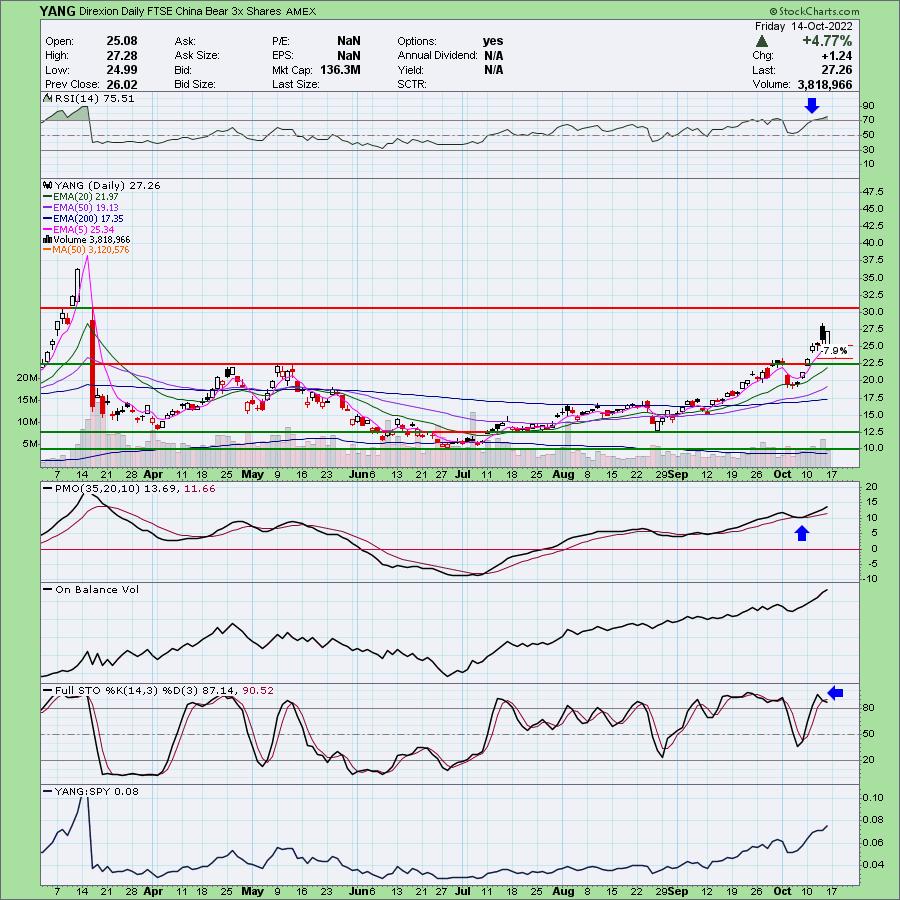
Here is today's chart:
Since picking YANG it was up over 7%. While we saw a bearish filled black candlestick yesterday, YANG finished up over 4.75%. We did see a lower high and lower low and the RSI is overbought, but I believe this one will move up to test overhead resistance at gap resistance from March. As far as hedges go, this is a good one. It trades with high volume and that volume based on the OBV is clearly confirming this current uptrend. Remember this is a 3x "juiced" ETF. I like it as a hedge not an "investment". Full Disclosure: I own it.
Don't forget, on Thursdays I look at reader-requested symbols, so shoot me an email at erin@decisionpoint.com. I read every email I receive and try to answer them all!
Dud:
Mosaic Co. (MOS)
EARNINGS: 10/31/2022 (AMC)
The Mosaic Co. engages in the production and marketing of concentrated phosphate and potash crop nutrients. The company operates its businesses through its wholly and majority owned subsidiaries. It operates through the following segments: Phosphates, Potash, and Mosaic Fertilizantes. The Phosphates segment owns and operates mines and production facilities in North America which produces concentrated phosphate crop nutrients and phosphate-based animal feed ingredients, and concentrated crop nutrients. The Potash segment owns and operates potash mines and production facilities in North America which produce potash-based crop nutrients, animal feed ingredients, and industrial products. The Mosaic Fertilizantes segment produces and sells phosphate and potash-based crop nutrients, and animal feed ingredients, in Brazil. The company was founded on October 22, 2004, and is headquartered in Plymouth, MN.
Predefined Scans Triggered: P&F Low Pole.
Below are commentary and chart from Monday:
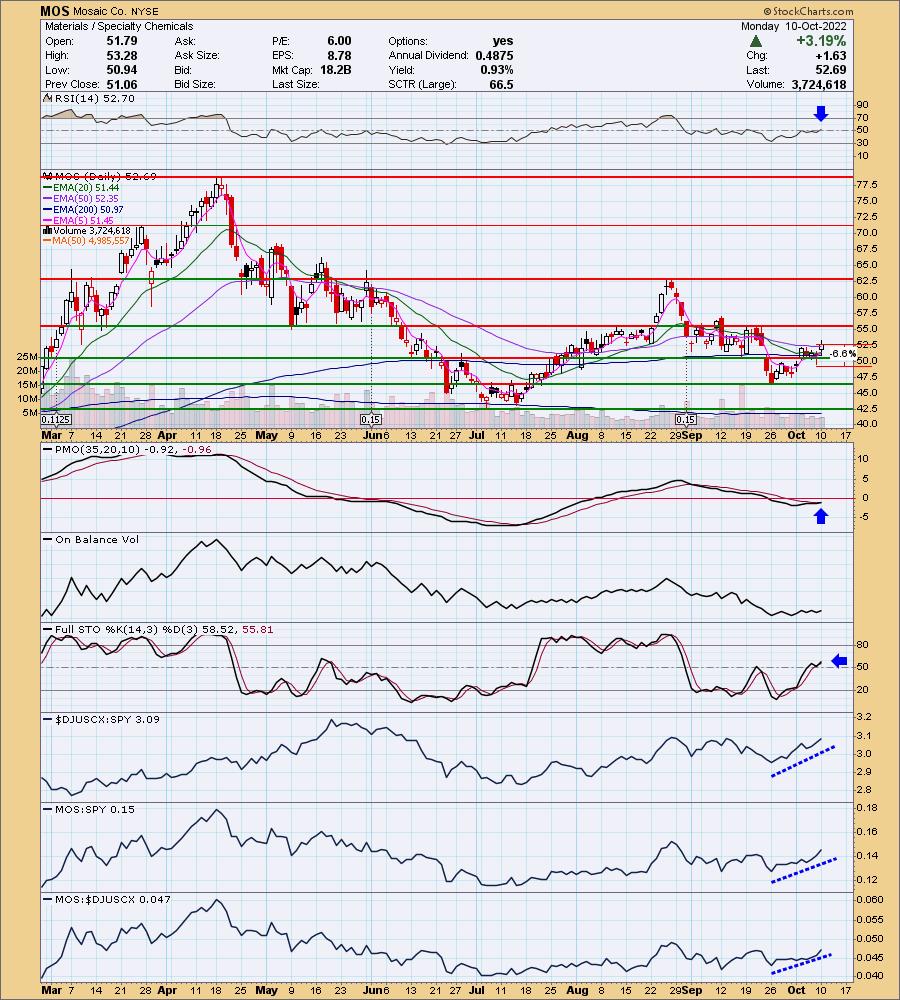
"MOS is down -0.59% in after hours trading. I've been stalking this chart and it is ready for action on today's strong breakout move. Price closed above the 50-day EMA and the PMO triggered a crossover BUY signal today. Stochastics are rising after a quick hiccup. The RSI has moved into positive territory and relative strength studies show outperformance against an already successful group and the SPY. I've set the stop at 6.6% around $49.21."
Here is today's chart:
When we reviewed this in today's Diamond Mine trading room, I tried to determine where this investment went wrong. I think I picked it too early. The RSI had only just moved above 50 and the PMO was mostly flat, not rising. Stochastics were enthusiastic at the time either. This is one reason I wait for so many confirmations before entering stocks. I don't think it was a terrible pick, just an example of what can happen when you get in too early. It did stop on support, so in all honesty it does look watch list worthy right now.
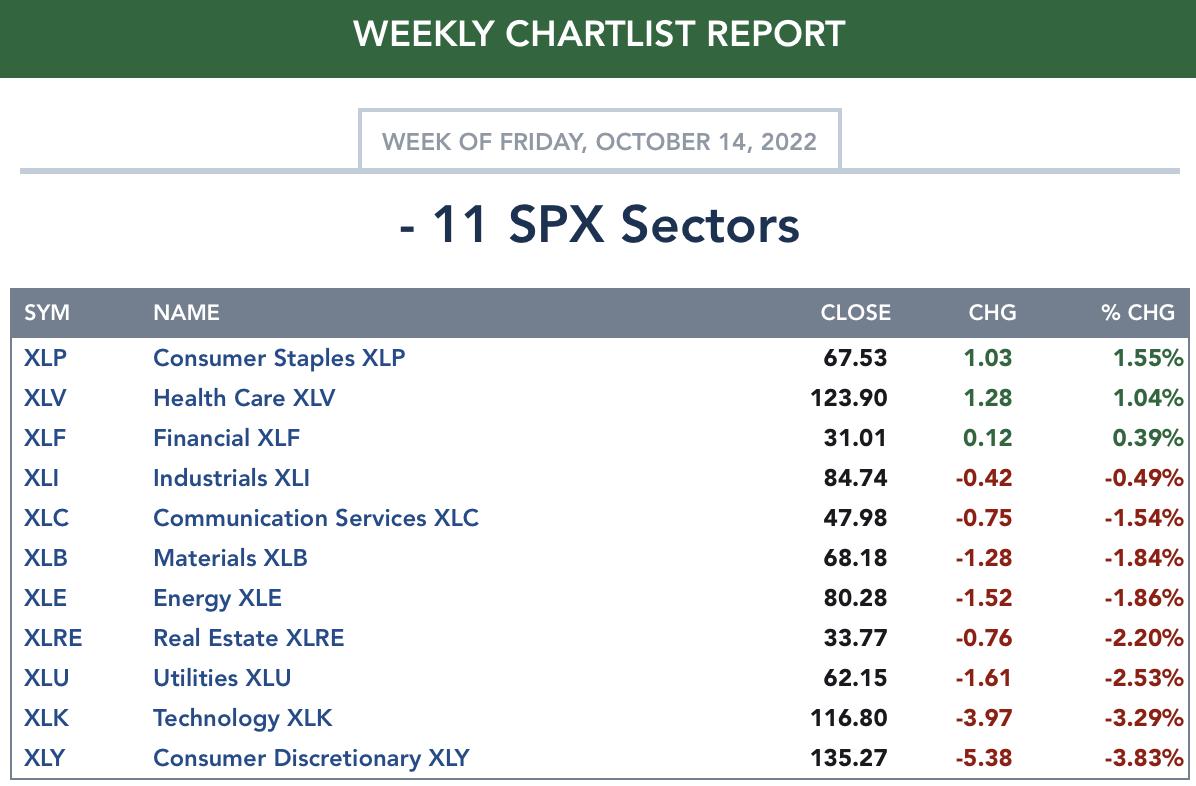
THIS WEEK's Sector Performance:
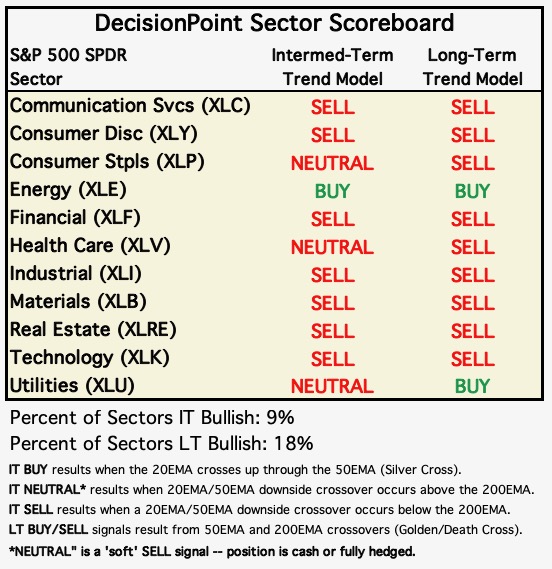
DecisionPoint Sector Scoreboard (Mechanical Trend Model Signals):
Click Here to view Carl's annotated Sector ChartList!
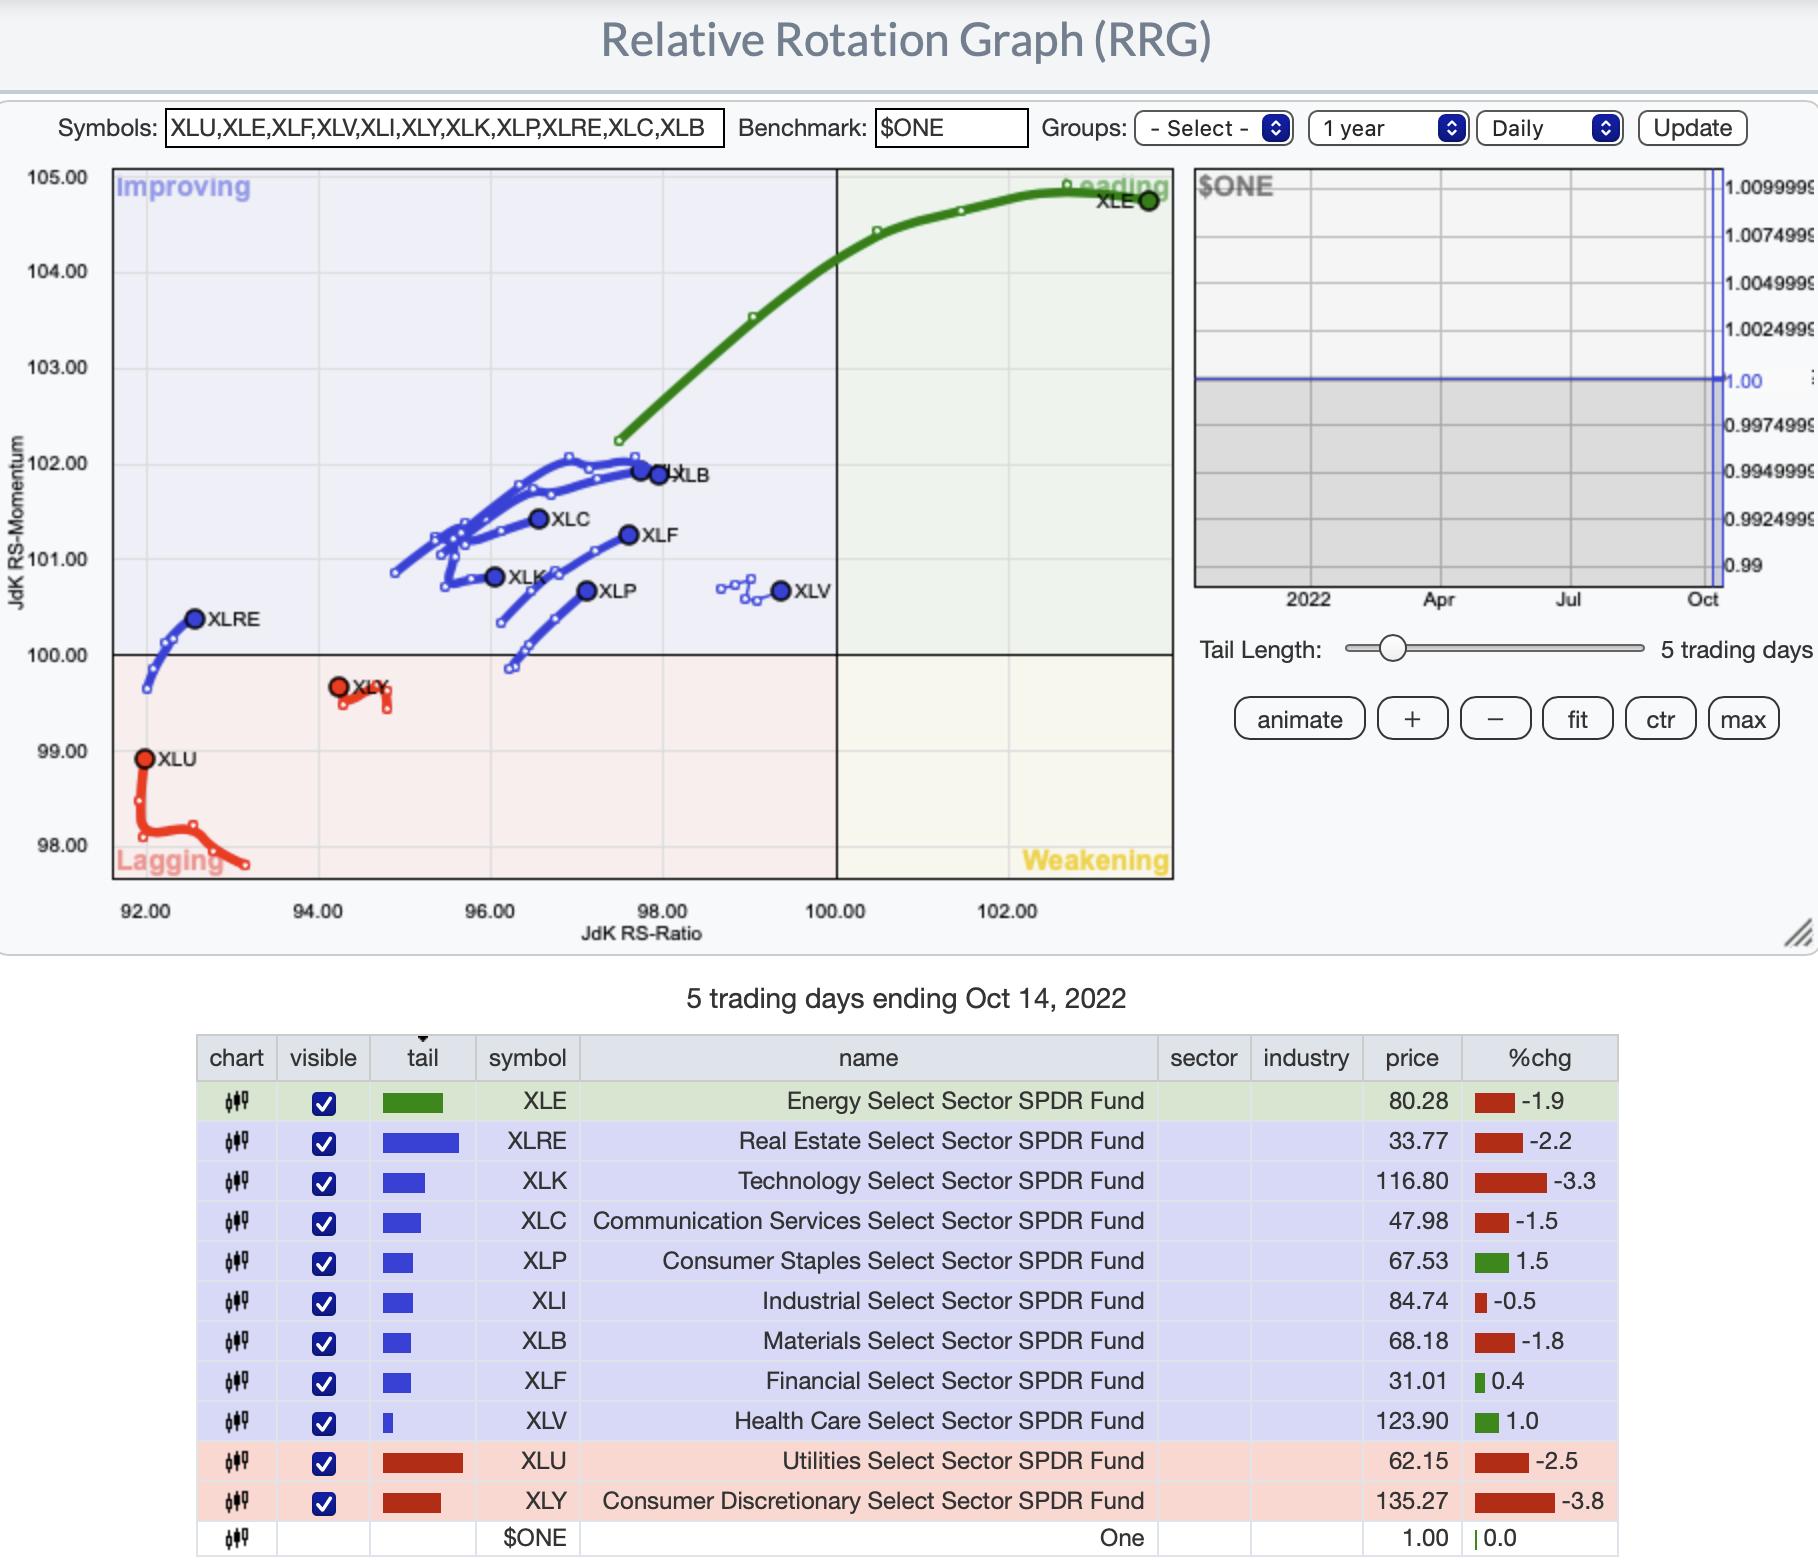
RRG® Daily Chart ($ONE Benchmark):
XLE is the clear winner on the RRG. It is the only one on the right half of the RRG (meaning it has a bullish configuration) and is well into the Leading quadrant.
Most bearish is XLY which is languishing in the Lagging quadrant. XLU is also Lagging but at least it is headed northward toward Improving.
With the exception of XLB, all of the sectors within the Improving quadrant have bullish northeast headings that could take them into the Leading quadrant. All is not lost for XLB as it still has an easterly component to its heading.
RRG® Weekly Chart ($ONE Benchmark):
The weekly RRG is not at all encouraging. XLE and XLU are on the right side of the RRG meaning a bullish configuration. However, XLU should find itself in the Lagging quadrant very soon. XLF and XLY are the only members of the Improving quadrant, but they too are very close to reaching the Lagging quadrant.
The remainder of sectors are in the Lagging quadrant holding bearish southwest headings that will take them deeper into the bearish Lagging quadrant.
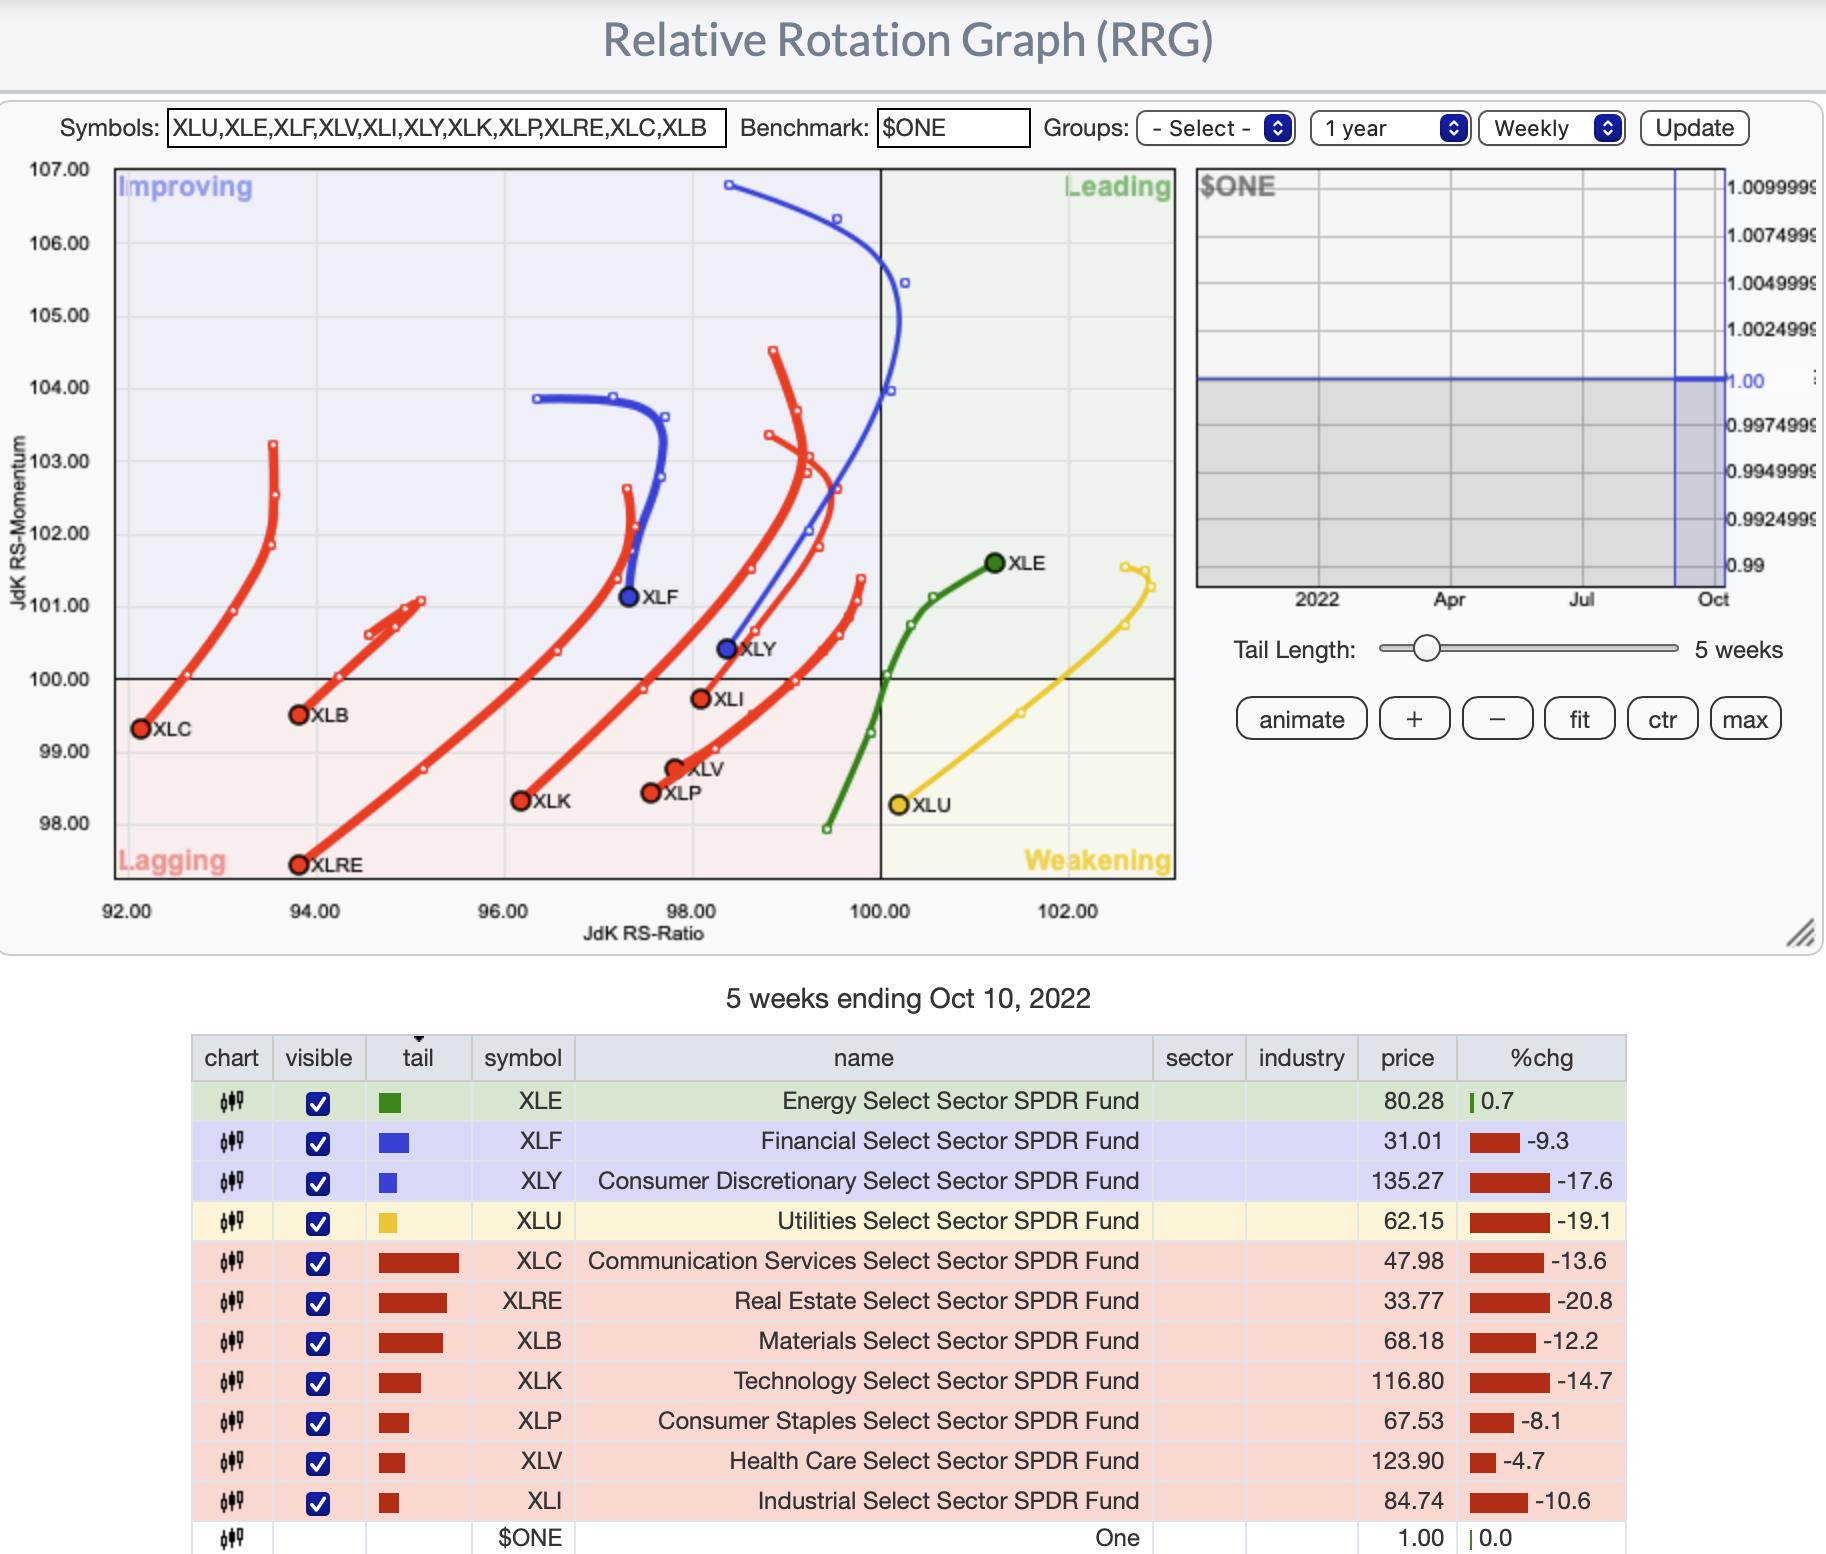
RRG® charts show you the relative strength and momentum for a group of stocks. Stocks with strong relative strength and momentum appear in the green Leading quadrant. As relative momentum fades, they typically move into the yellow Weakening quadrant. If relative strength then fades, they move into the red Lagging quadrant. Finally, when momentum starts to pick up again, they shift into the blue Improving quadrant.
CLICK HERE for an animated version of the RRG charts.
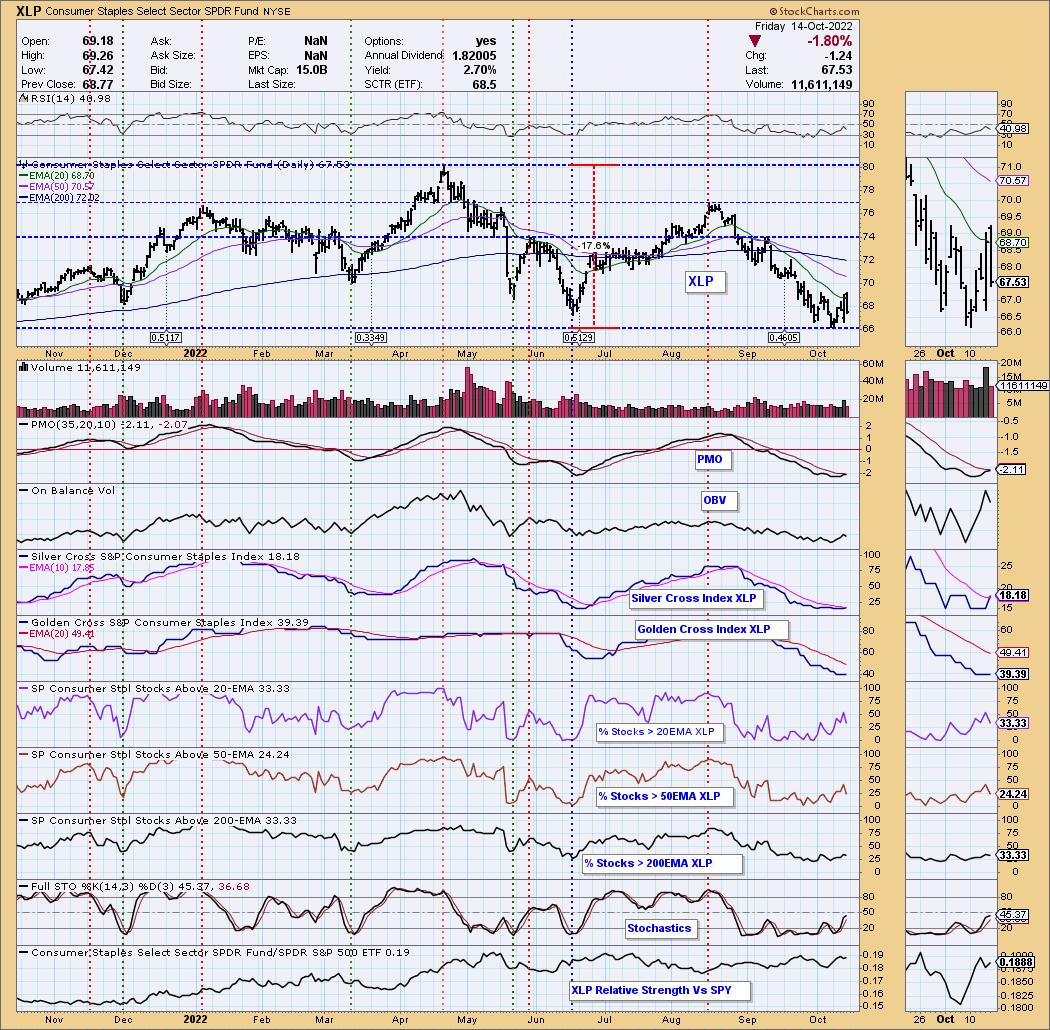
Sector to Watch: Consumer Staples (XLP)
Surprise Diamond Mine attendees! I changed my mind after reviewing participation indicators. I had planned on doing Financials (XLF), but the Silver Cross Index (SCI) turned down below its signal line today and that is definitely a no-go for me. XLP saw a positive cross above the signal line for its SCI so it was a no-brainer after all. The participation of stocks above their 20/50-day EMAs is still weak, but overall trending higher. The PMO is still rising and should trigger a crossover BUY signal next week unless this decline continues in earnest.
We have a nice price bottom and a break of the declining trend. The RSI is negative and falling unfortunately, but Stochastics are hanging in there. I'm not suggesting getting into XLP or anything for that matter given this volatile bear market, but if you're looking, I'd consider concentrating in XLP, XLF and XLE. XLE is still by far the strongest sector, but it topped at longer-term resistance so I opted not to include it. XLF is still an area of interest for me, particularly Banks. Keep an eye on them.
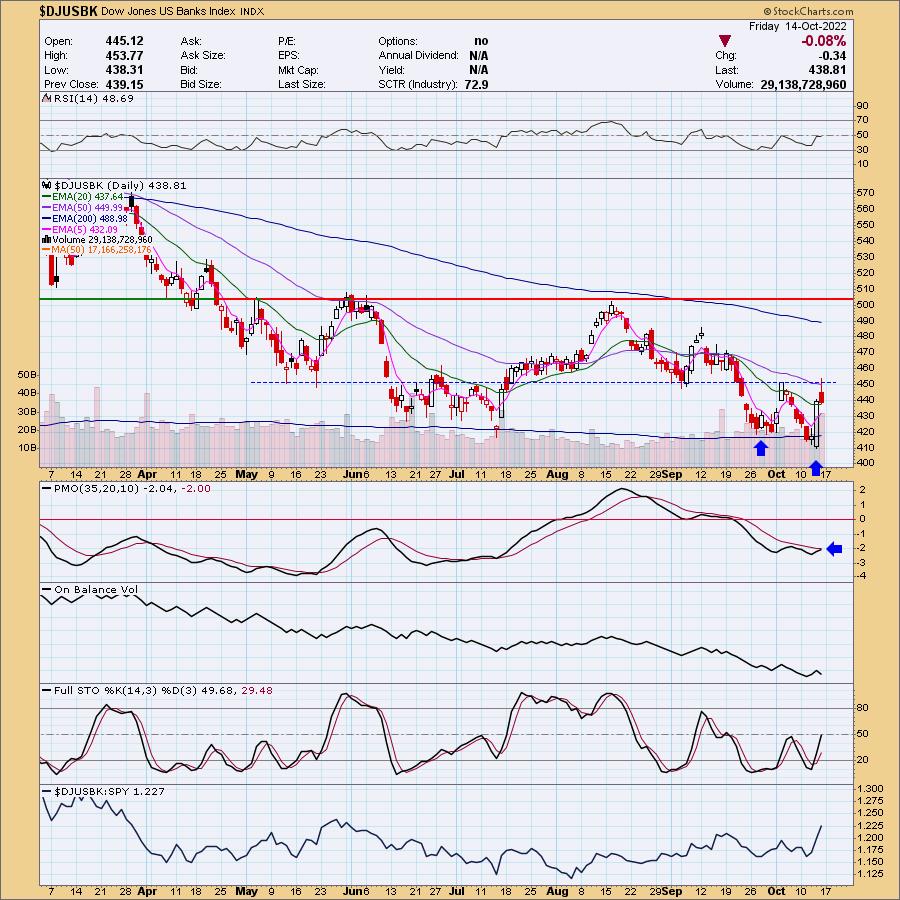
Industry Group to Watch: Banks ($DJUSBK)
I am still going with Banks which I selected this morning. There are plenty of industry groups to select from, I liked Banks, Soft Drinks, Tobacco and Paper. I don't know what it is about Banks, but I like that despite a pullback today, they were only down -0.08% unlike the other groups I mentioned which were down -2.19%, -1.95% and -1.85% respectively. There is a double-bottom pattern that was almost confirmed with the intraday breakout above the confirmation line and 50-day EMA. I've stretched the confirmation line out so you can see that it is actually a pretty strong resistance level. Not surprising it was turned away. Should the pattern be confirmed, the minimum upside target would take price to the next resistance level at the June/August tops. The RSI is negative and flat, but Stochastics are rising and the PMO is nearing a crossover BUY signal.
We bandied about with numerous possibilities in this group. My two favorites are HFWA and SSB. Other charts to consider: BANR, FBK, TRMK and AMAL.
Go to our Sector ChartList on DecisionPoint.com to get an in-depth view of all the sectors. On StockCharts.com you can find the Industry Summary.
Have a great weekend! Good Luck & Good Trading!
- Erin
erin@decisionpoint.com
Full Disclosure: I'm 10% exposed with a 5% hedge.
Watch the latest episode of DecisionPoint with Carl & Erin Swenlin on Mondays 7:00p EST or on the DecisionPoint playlist on the StockCharts TV YouTube channel here!
Technical Analysis is a windsock, not a crystal ball. --Carl Swenlin
NOTE: The stocks reported herein are from mechanical trading model scans that are based upon moving average relationships, momentum and volume. DecisionPoint analysis is then applied to get five selections from the scans. The selections given should prompt readers to do a chart review using their own analysis process. This letter is not a call for a specific action to buy, sell or short any of the stocks provided. There are NO sure things or guaranteed returns on the daily selection of "diamonds in the rough."
Helpful DecisionPoint Links:
DecisionPoint Shared ChartList and DecisionPoint Chart Gallery
Price Momentum Oscillator (PMO)
Swenlin Trading Oscillators (STO-B and STO-V)
(c) Copyright 2022 DecisionPoint.com