
Great Diamond Mine trading room today! The market is churning, but still showing excellent internal strength. The bear market rally appears ready to restart. As Markets & Mayhem @Mayhem4Markets recently noted on Twitter:
We just had a strong GDP reading and the markets are rallying into the Fed after a less than optimal earnings season.
The market has every reason to fail. Even the big mega-caps were on the ropes and the market held its ground. We still agree that this isn't the end of the bear market, but this is an excellent opportunity to take advantage of a short-term bullish bias.
My portfolio picks this week didn't perform as I would have liked them. Gold Miners decided to reverse so those positions are in jeopardy right now. Most "Diamonds in the Rough" still look good moving forward.
The link for today's Diamond Mine recording is below the diamonds logo.
Have a great weekend!
Good Luck & Good Trading,
Erin

TODAY'S RECORDING LINK (10/28/2022):
Topic: DecisionPoint Diamond Mine (10/28/2022) LIVE Trading Room
Start Time: Oct 28, 2022 09:00 AM
Passcode: Oct-28th
NEXT DIAMOND MINE Trading Room on October 28th
When: Nov 4, 2022 09:00 AM Pacific Time (US and Canada)
Topic: DecisionPoint Diamond Mine (11/4/2022) LIVE Trading Room
Register in advance for this webinar HERE.
Save the registration confirmation email with login instructions in case Zoom doesn't notify you in time.

Our latest DecisionPoint Trading Room recording:
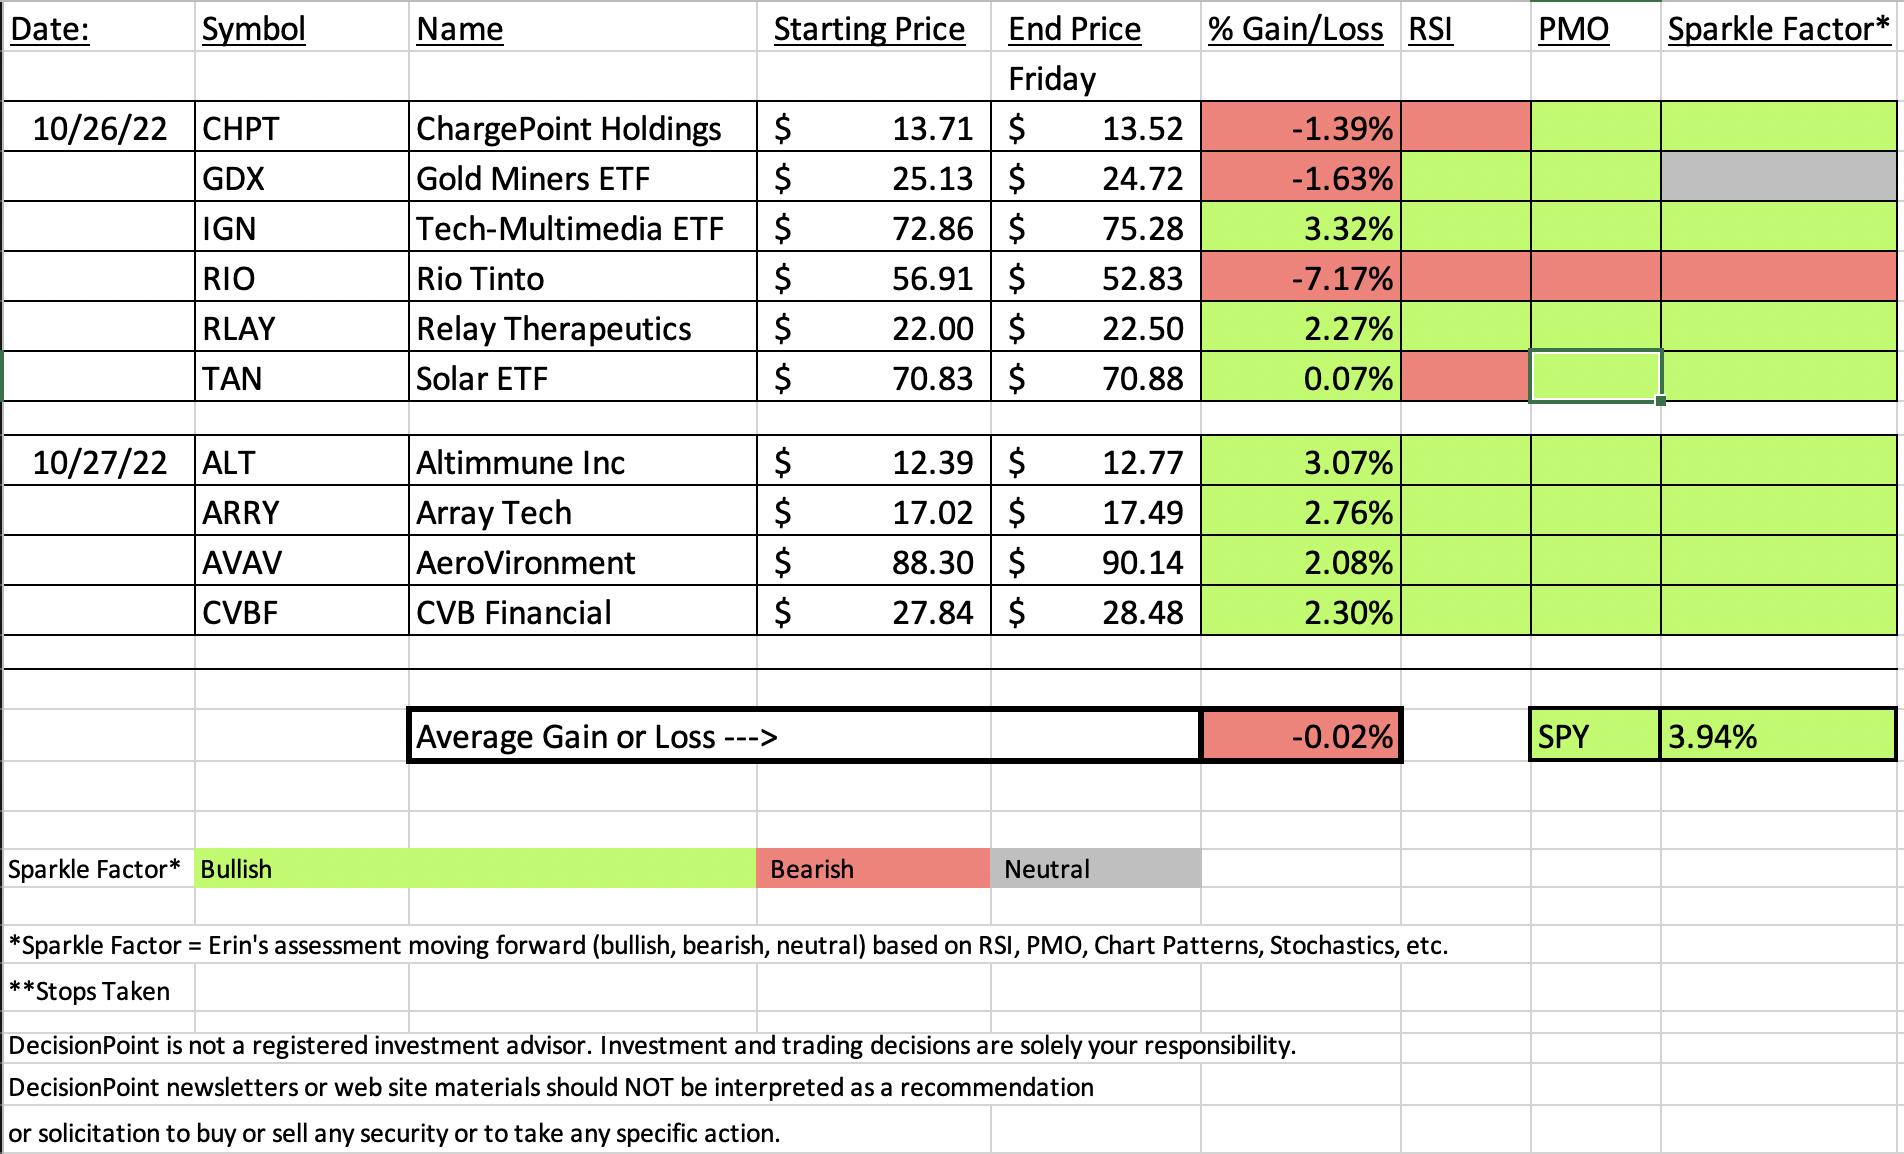
A few items about the spreadsheet: I've put on the spreadsheet whether the RSI is positive (green) or negative (red). The PMO column tells you if it is rising (green) or falling (red). Finally I've added my own "Sparkle Factor" that gives you my assessment going forward, bullish (green), bearish (red) or neutral (gray). The Sparkle Factor is basically my thoughts on whether I expect it to rise or fall. A neutral means it could really go either way so it could be added to a watch list. If you're in a stock I consider "neutral" going forward, the ball is in your court.
Darling:
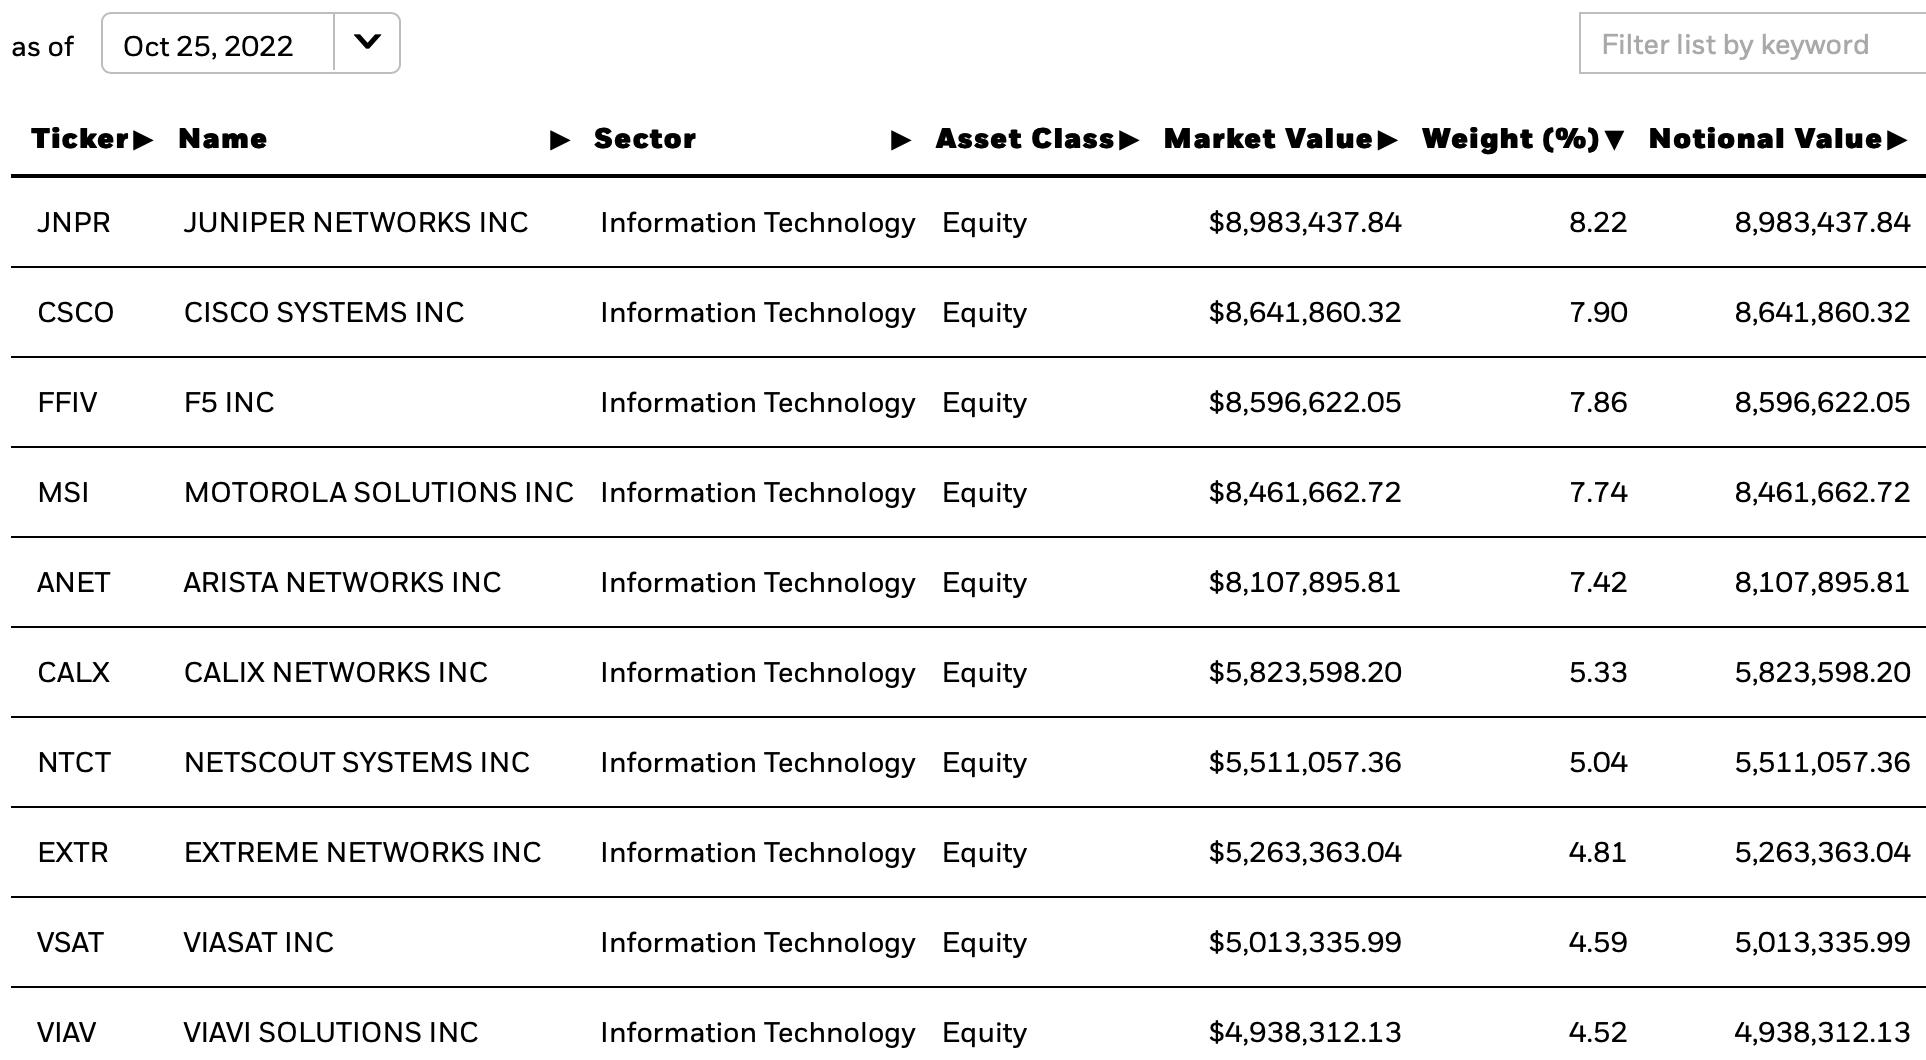
iShares North American Tech-Multimedia Networking ETF (IGN)
EARNINGS: N/A
IGN tracks a market-cap-weighted index of US and Canadian multimedia networking companies. Click HERE for more information.
Predefined Scans Triggered: None.
Below are the commentary and chart from 10/26:
"IGN is unchanged in after hours trading. We have a giant bullish double-bottom that was confirmed with yesterday's giant breakout. Considering today was a bad day for tech, this ETF didn't succumb. The RSI is positive and not overbought. The PMO is on an oversold BUY signal that occurred just below the zero line. We saw a "Silver Cross" BUY signal come in on yesterday's breakout. Stochastics are oscillating above 80 and I love the relative performance of this ETF. The stop is set at 7.4% around $67.46 below the 50-day EMA."
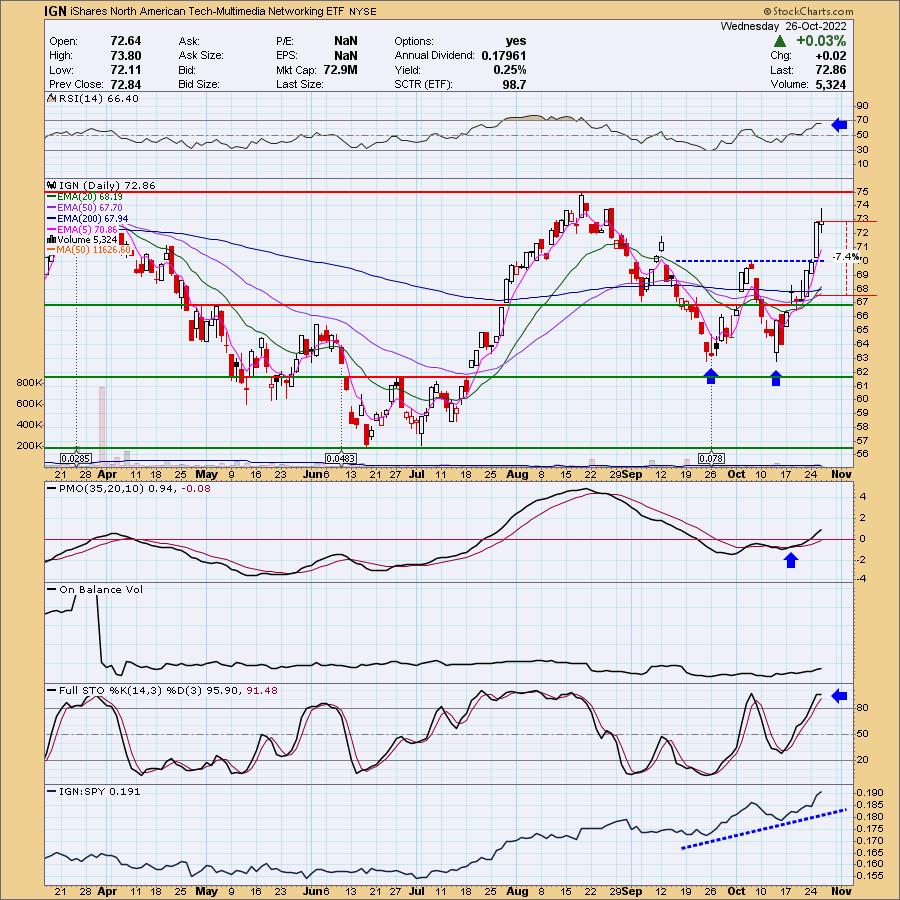
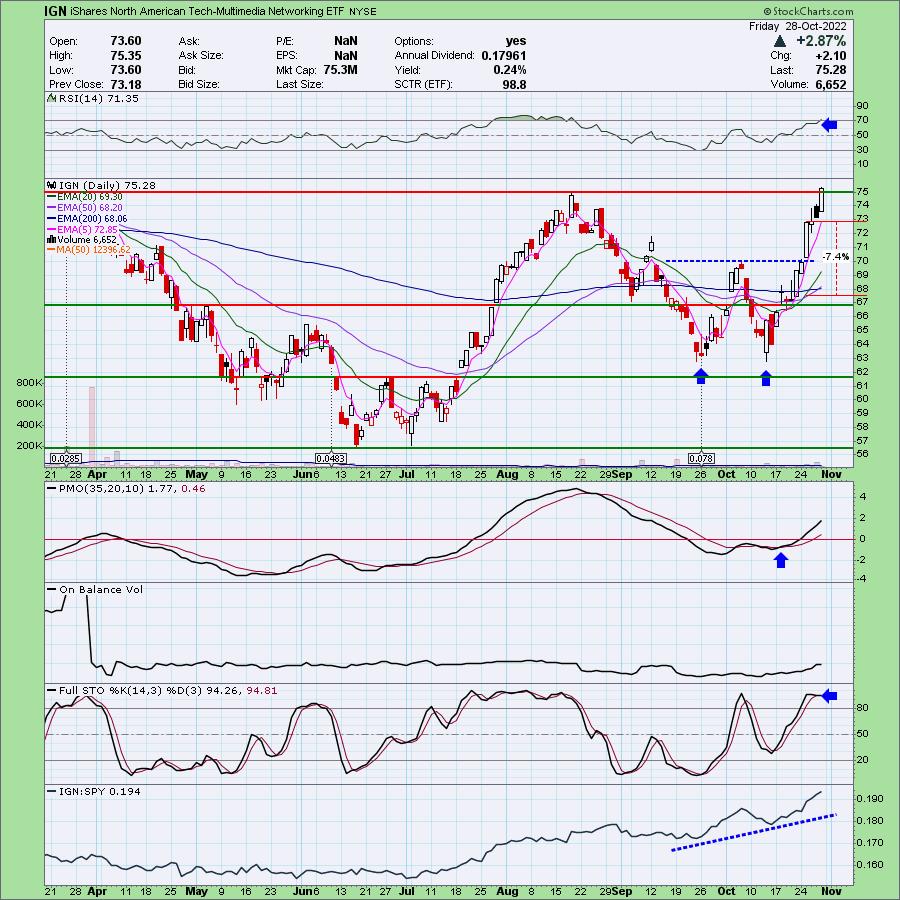
Here is today's chart:
It's been a great week for this thinly traded ETF. In all honesty, had I been paying attention, I would've left this one to the wayside based on its volume characteristics. Glad I didn't. Price has now broken above strong resistance at the August top and seems ready to continue to fly higher. The RSI is overbought now, but based on August, it can stay that way for weeks. The PMO is not overbought yet and Stochastics are comfortably above 80. This one is due for a bit of a pullback so I wouldn't be surprised if it paused the rally a bit. Although with the market showing such strength, I suspect it has further to fly.
Don't forget, on Thursdays I look at reader-requested symbols, so shoot me an email at erin@decisionpoint.com. I read every email I receive and try to answer them all!
Dud:
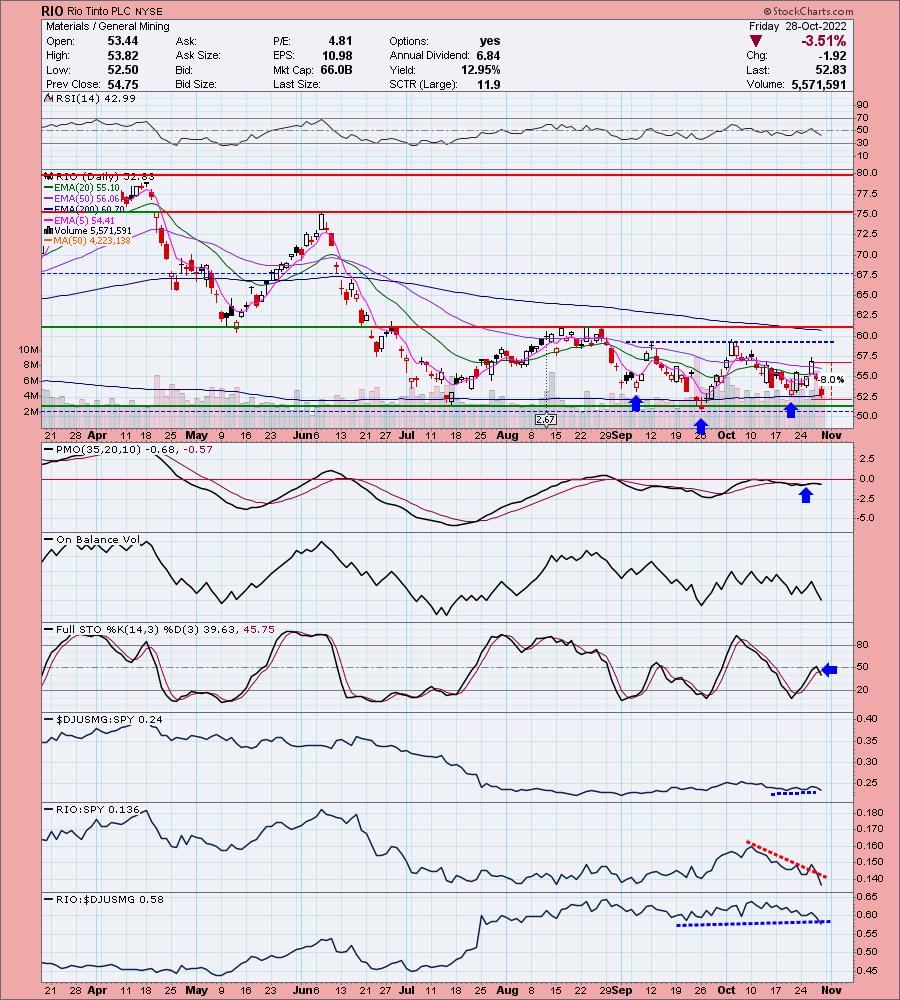
Rio Tinto PLC (RIO)
EARNINGS: 2/22/2023 (BMO)
Rio Tinto Plc engages in the exploration, mining, and processing of mineral resources. It operates through the following business segments: Iron Ore, Aluminium, Copper and Diamonds, Energy and Minerals, and Other Operations. The Iron Ore segment supplies global seaborne iron ore trade. The Aluminium segment produces bauxite, alumina and primary aluminum. The Copper and Diamonds segment offers gold, silver, molybdenum and other by-products. The Energy and Minerals includes businesses with products such as uranium, borates, salt and titanium dioxide feedstock together with coal operations. The Other Operations segment covers the the curtailed Gove alumina refinery and Rio Tinto Marine operations. Rio Tinto was founded in 1873 and is headquartered in London, the United Kingdom.
Predefined Scans Triggered: Bullish MACD Crossovers and Entered Ichimoku Cloud.
Below are the commentary and chart from 10/26:
"RIO is down -0.42% in after hours trading. This isn't a Gold Miner, but it is obviously in the mining business. The setup is similar to GDX with a reverse head and shoulders developing. A breakout from the neckline would imply a minimum upside target of $67.50. Price broke out above both the 20/50-day EMAs. The RSI just moved positive above net neutral (50). The PMO had a positive crossover today just below the zero line. Stochastics are rising quickly. Relative performance could be better. This one is a bottom fish so treat it accordingly (babysit). The stop is set beneath the October low at 8% around $52.35."

Here is today's chart:
Where did this one go wrong? Looking at the chart above, the one item that wasn't looking good was relative performance against the SPY. While RIO isn't technically a Gold Miner, we know that metals are not performing well right now and that likely contributed to its demise as well. I do still own this, but have adjusted my stop upward. Basically if it starts to break down further that stop will be triggered fairly quickly. I'll also have my eyes glued to the 5-minute candlestick chart on Monday. I think this actually has watch list potential as support is right here. If it rebounds, it could still pay off. At this point, there are better candidates.
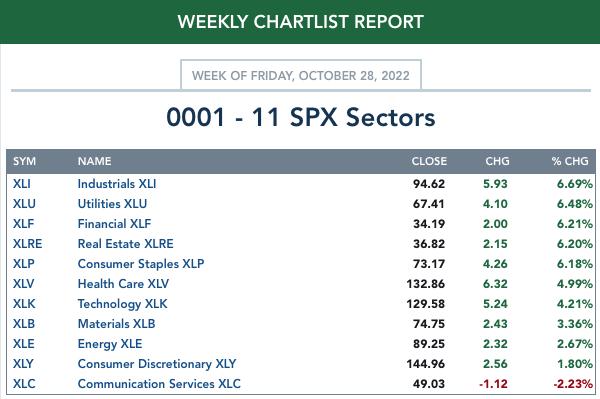
THIS WEEK's Sector Performance:
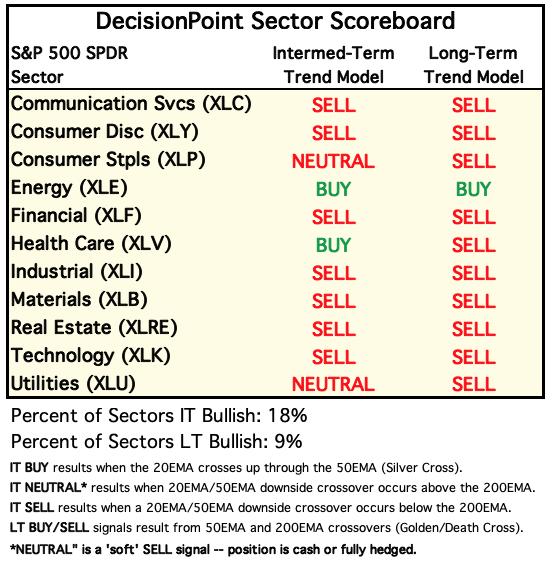
DecisionPoint Sector Scoreboard (Mechanical Trend Model Signals):
Click Here to view Carl's annotated Sector ChartList!
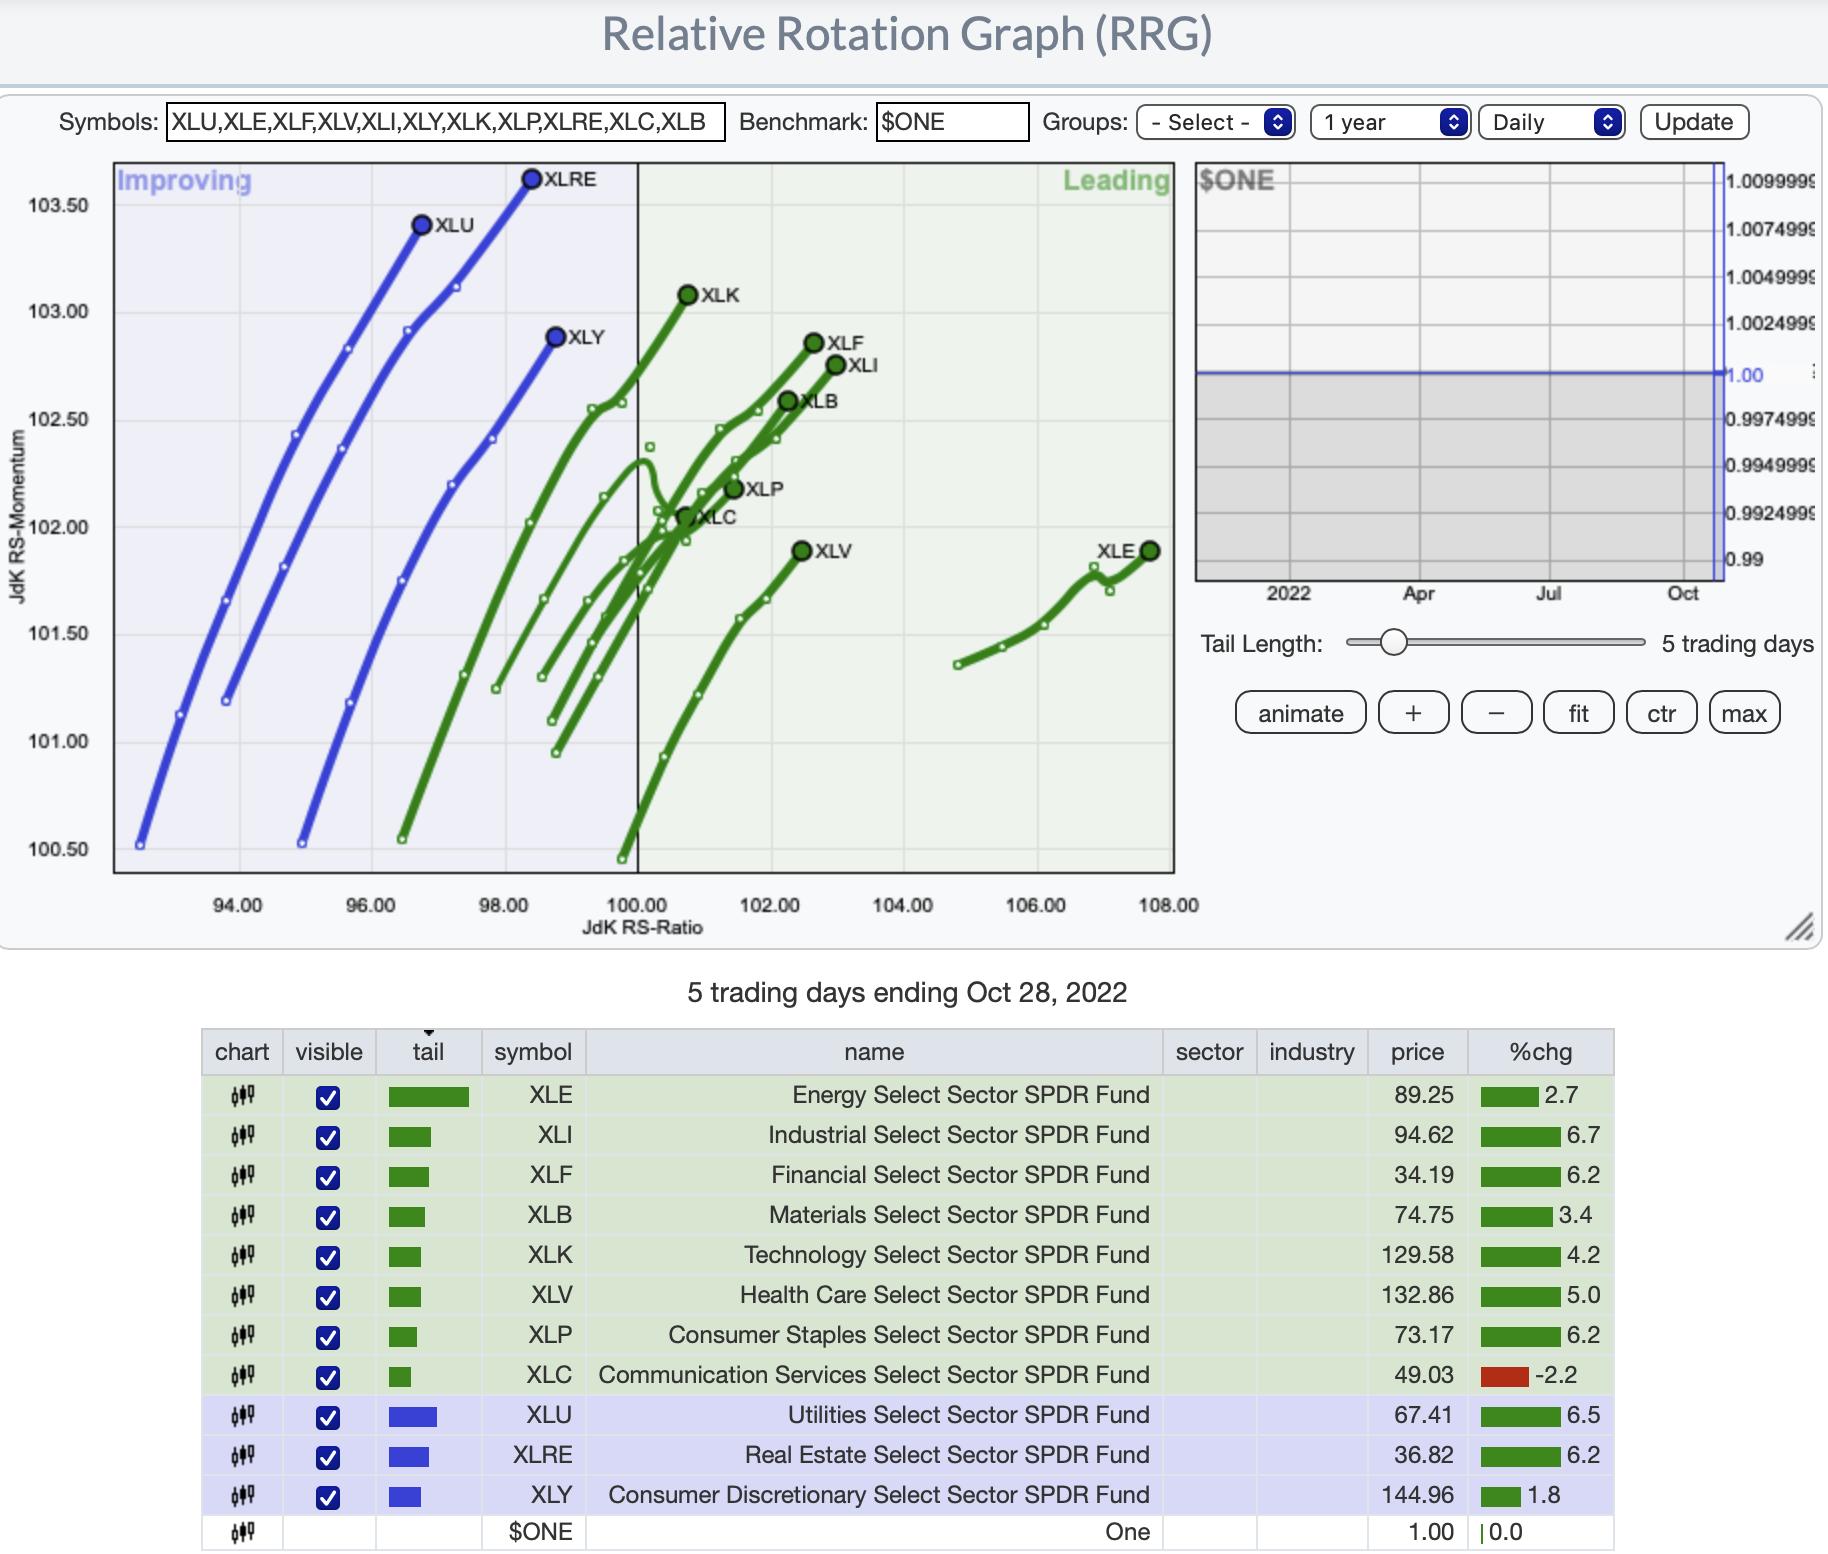
RRG® Daily Chart ($ONE Benchmark):
There is a clear short-term bullish bias based on absolute performance of these sectors. All of them but XLC have bullish northeast headings. XLC is still in the Leading quadrant so while the deterioration of its heading isn't a good thing, it isn't that bad either particularly given it has an eastward component to its heading.
RRG® Weekly Chart ($ONE Benchmark):
The intermediate-term picture shows there are still problems. It's hard to see, but XLV has made an about-face and has a new northeast heading. This is very good news for the sector. Might be time to throw a fishing line into this sector if you don't have exposure already. Biotechs and Pharma look excellent right now.
XLF is about to reach the Lagging quadrant, but it is trying to avoid it as it now has an eastward component. Nonetheless, we believe it will get caught in Lagging.
XLE is a clear intermediate-term winner; however, we note that rotation seems to be slipping somewhat.
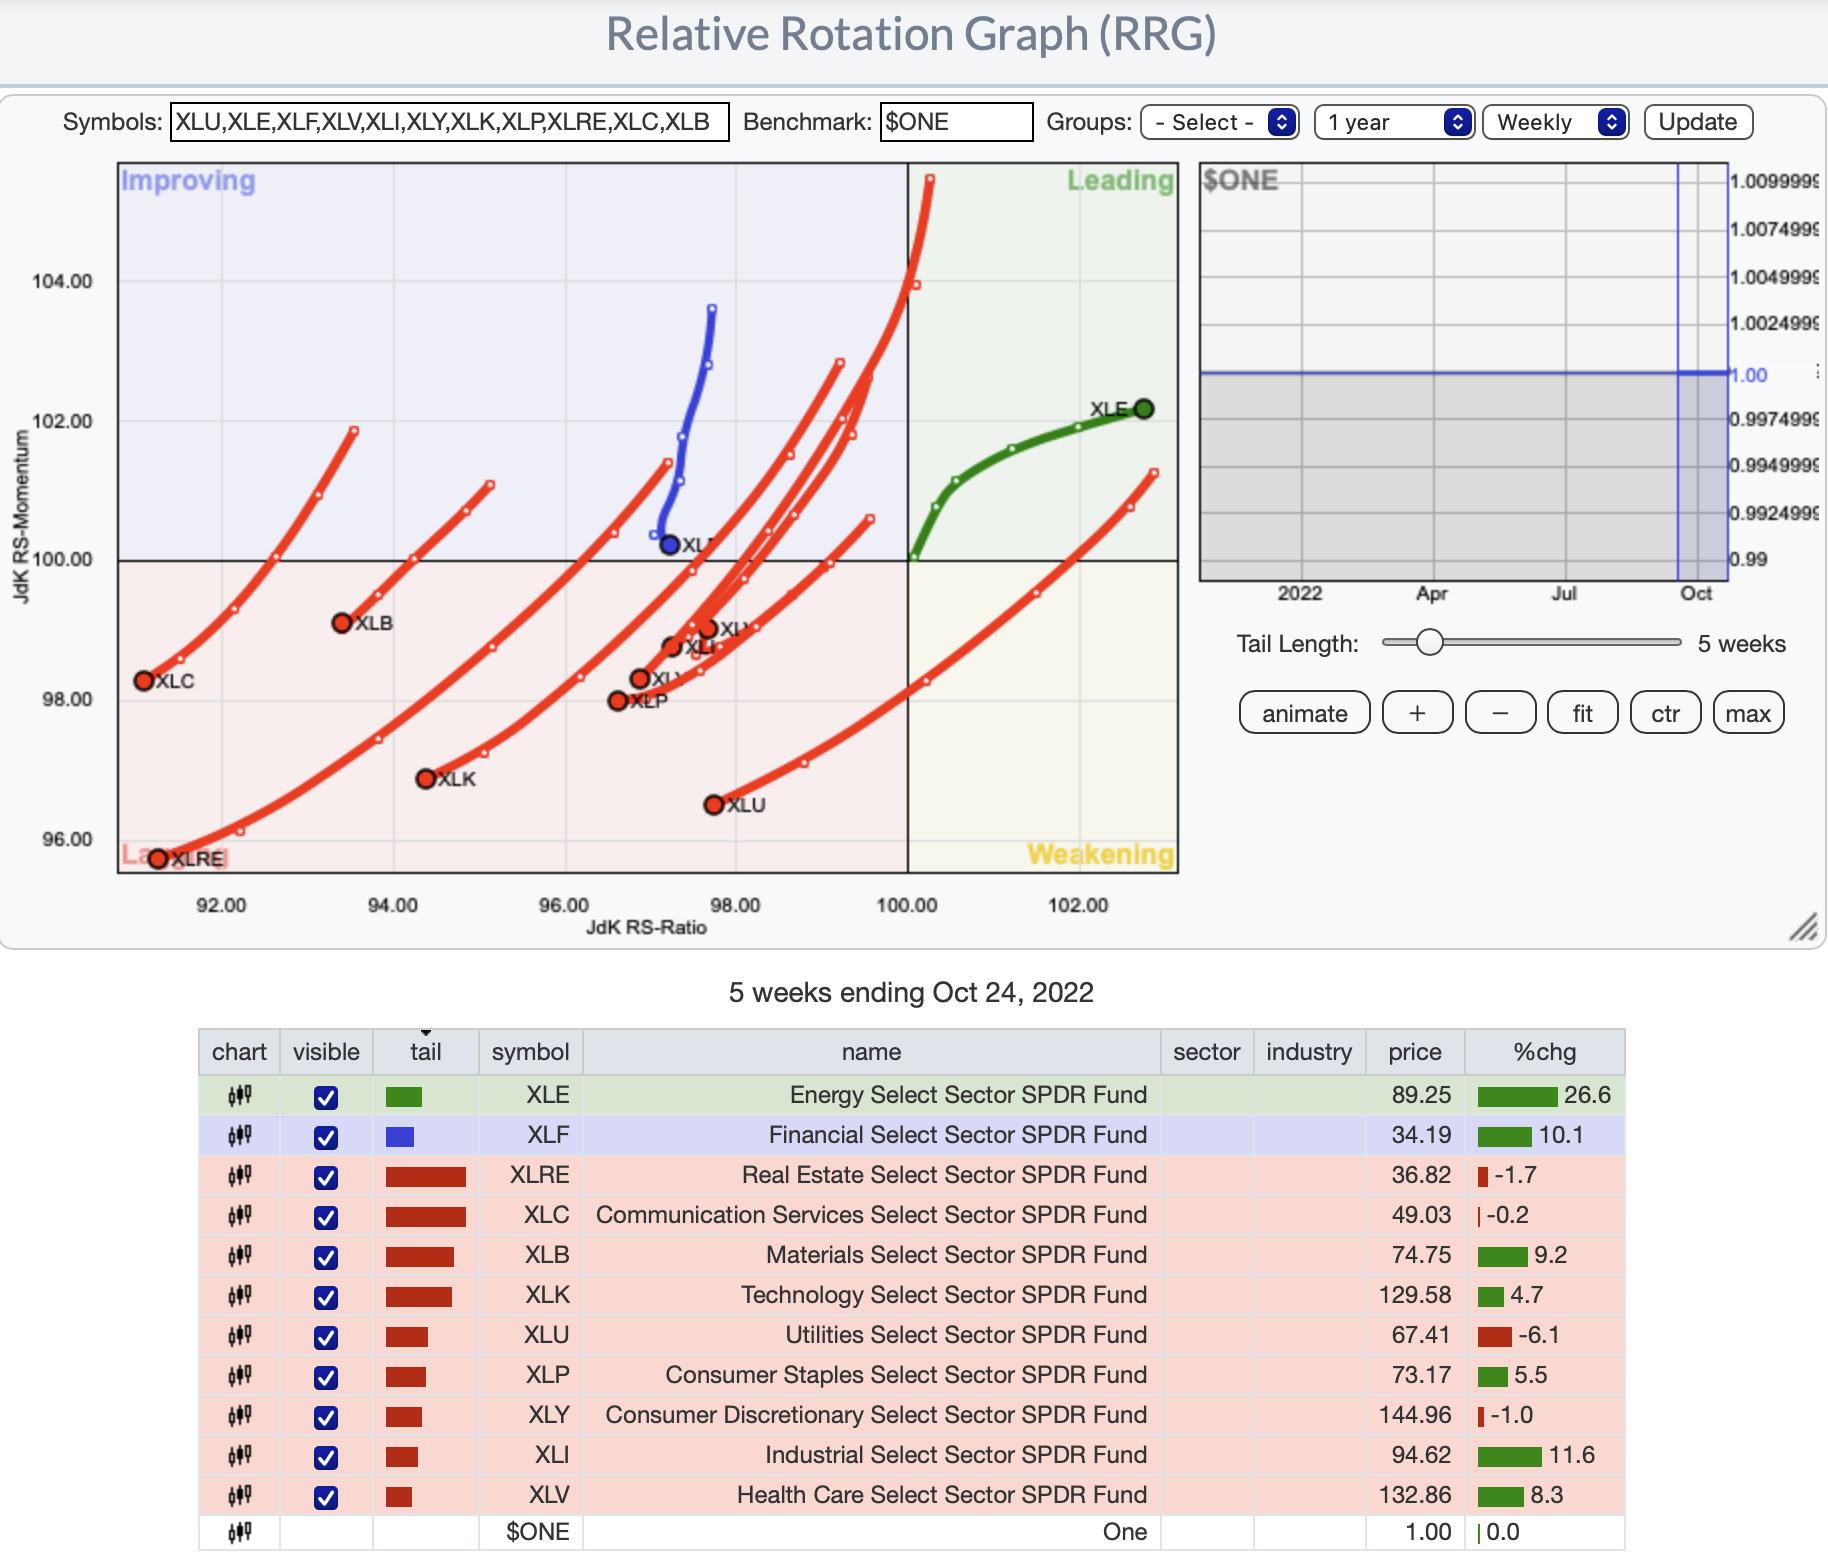
RRG® charts show you the relative strength and momentum for a group of stocks. Stocks with strong relative strength and momentum appear in the green Leading quadrant. As relative momentum fades, they typically move into the yellow Weakening quadrant. If relative strength then fades, they move into the red Lagging quadrant. Finally, when momentum starts to pick up again, they shift into the blue Improving quadrant.
CLICK HERE for an animated version of the RRG charts.
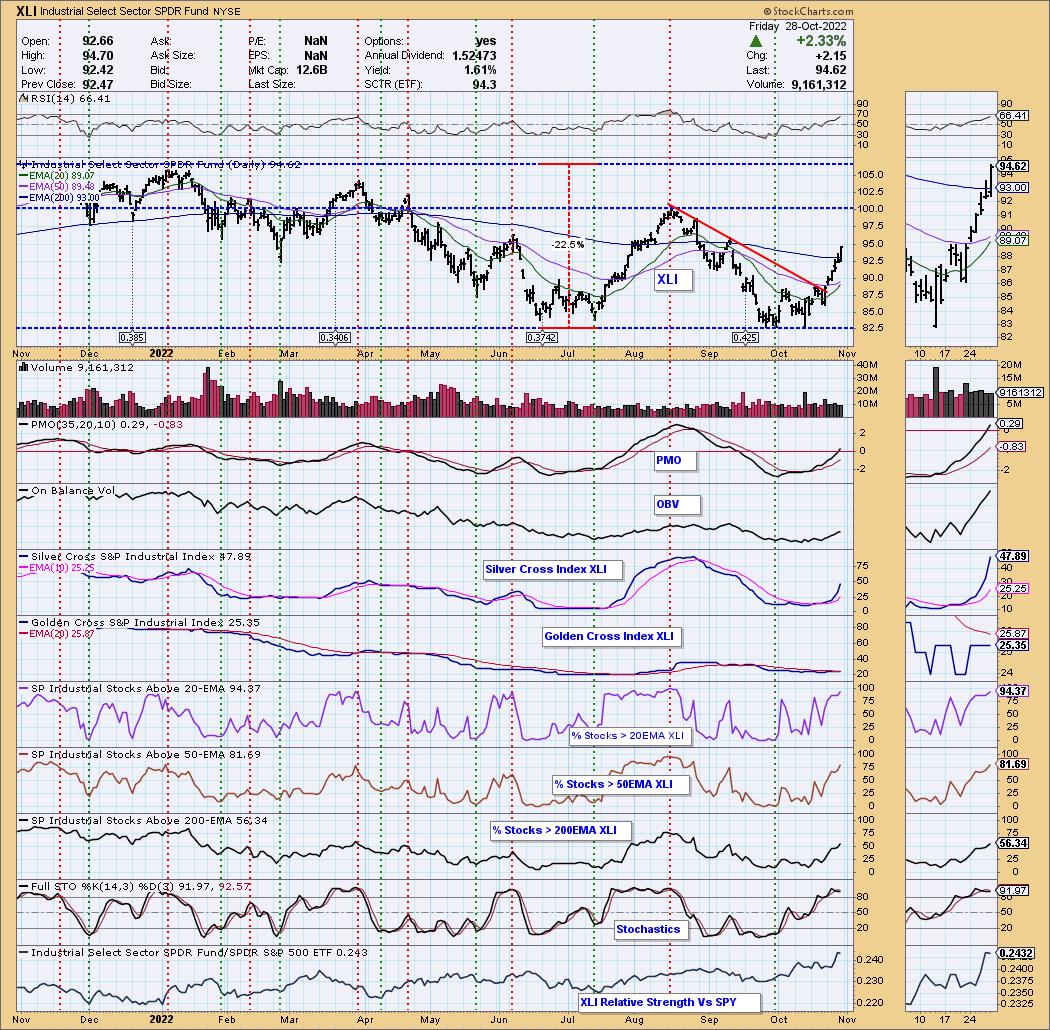
Sector to Watch: Industrials (XLI)
There are plenty of sectors to choose from right now, but I'm intrigued by industrials. The Dow has been outperforming and this price chart is excellent. The RSI is positive and the PMO just moved above the zero line. I particularly like the breakout above the 200-day EMA today. The Silver Cross Index (SCI) gave us plenty of warning that this sector was ready to outperform with its crossover its signal line. Participation is strong across the board and relative strength has picked up.
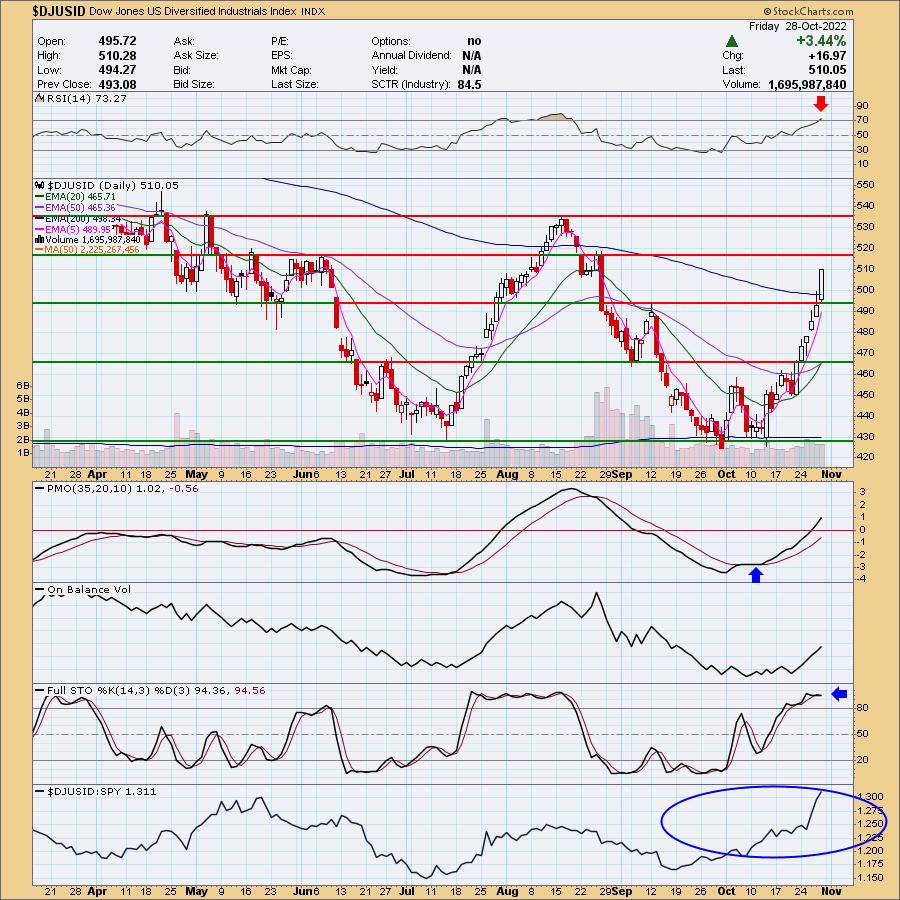
Industry Group to Watch: Diversified Industrials ($DJUSDS)
Unfortunately I wasn't able to uncover an ETF that is specific to this industry group, but we did find two symbols in this industry group that looked excellent: SiteOne Landscape Supply (SITE) and DXP Enterprises (DXPE). This chart looks similar to XLI. While you can't trade the industry group, a position in XLI isn't a bad idea. I'm thinking about it for myself. We do have to be aware of the overbought RSI, but if the rally continues to see follow-through, it will get even more overbought. It managed to rise with an overbought RSI into August.
Go to our Sector ChartList on DecisionPoint.com to get an in-depth view of all the sectors. On StockCharts.com you can find the Industry Summary.
Have a great weekend! Good Luck & Good Trading!
- Erin
erin@decisionpoint.com
Full Disclosure: I'm 55% exposed.
Watch the latest episode of DecisionPoint with Carl & Erin Swenlin on Mondays 7:00p EST or on the DecisionPoint playlist on the StockCharts TV YouTube channel here!
Technical Analysis is a windsock, not a crystal ball. --Carl Swenlin
NOTE: The stocks reported herein are from mechanical trading model scans that are based upon moving average relationships, momentum and volume. DecisionPoint analysis is then applied to get five selections from the scans. The selections given should prompt readers to do a chart review using their own analysis process. This letter is not a call for a specific action to buy, sell or short any of the stocks provided. There are NO sure things or guaranteed returns on the daily selection of "diamonds in the rough."
Helpful DecisionPoint Links:
DecisionPoint Shared ChartList and DecisionPoint Chart Gallery
Price Momentum Oscillator (PMO)
Swenlin Trading Oscillators (STO-B and STO-V)
(c) Copyright 2022 DecisionPoint.com