
Each Friday I select a "Sector to Watch" and an "Industry Group to Watch". They don't always produce the following week, but this week last Friday's industry group has been outperforming and continues to.
I have two more selections from the Software group. There are more in the "Runner-ups" list including INVZ which I mentioned on Friday when I picked this group. I'd have formally presented it today, but its momentum is no longer "new" as it was on Friday. Still I like the pick and felt you should review it on your own.
Heads up! We will be running a Cyber Monday special! If you don't already subscribe to the DP Alert, this will give you an opportunity to look at it more closely. Details will follow soon! Also, be aware that we will be raising our prices quite a bit in January. Be assured that as long as you keep your current subscription running, you will keep your low renewal price. Time to let people know they should subscribe on Cyber Monday as it won't be nearly as inexpensive as it is now.
We're doing some back testing and finding that Diamonds perform admirably over time, particularly if you use a topping PMO or PMO SELL signal as an exit on short-term investments. I have to charge appropriately for this content.
Good Luck & Good Trading!
Erin
Today's "Diamonds in the Rough": IHRT, PCTY and ZS.
Runner-ups: INVZ, SAVA, SLVM, CTSH, SIVBP, SNOW, NCNO and QLYS.

TODAY'S RECORDING LINK (11/11/2022):
Topic: DecisionPoint Diamond Mine (11/11/2022) LIVE Trading Room
Start Time: Nov 11, 2022 09:00 AM
Passcode: Nov*11th
NEXT DIAMOND MINE Trading Room on November 18th 2022:
When: Nov 18, 2022 09:00 AM Pacific Time (US and Canada)
Topic: DecisionPoint Diamond Mine (11/18/2022) LIVE Trading Room
Register in advance for this webinar HERE
After registering, you will receive a confirmation email containing information about joining the webinar.

Here is the last recording:
Welcome to DecisionPoint Diamonds, wherein I highlight ten "Diamonds in the Rough" per week. These are selected from the results of my DecisionPoint Scans which search for stocks that could benefit from the trend and condition of the market. Remember, these are not recommendations to buy or sell, but are the most interesting of the stocks that surfaced in my scans. My objective is to save you the work of the initial, tedious culling process, but you need to apply your own analysis to see if these stocks pique your interest as well. There are no guaranteed winners here!
"Predefined Scans Triggered" are taken from StockCharts.com using the "Symbol Summary" option instead of a "SharpChart" on the workbench.
iHeartMedia Inc. (IHRT)
EARNINGS: 02/23/2023 (AMC)
iHeartMedia, Inc. engages in the provision of media and entertainment services. It operates through the following segments: Multiplatform Group, Digital Audio Group, and Audio and Media Services Group. The Multiplatform Group segment consists of Broadcast radio, Networks and Sponsorships and Events businesses. The Digital Audio Group segment focuses on the Digital businesses, including Podcasts. The Audio and Media Services segment includes Katz Media Group ("Katz Media"), the company's full-service media representation business, and RCSSound Software (RCS), a provider of scheduling and broadcast software and services. The company was founded by L. Lowry Mays and B. J. McCombs in May 2007 and is headquartered in San Antonio, TX.
Predefined Scans Triggered: Bullish MACD Crossovers and Entered Ichimoku Cloud.
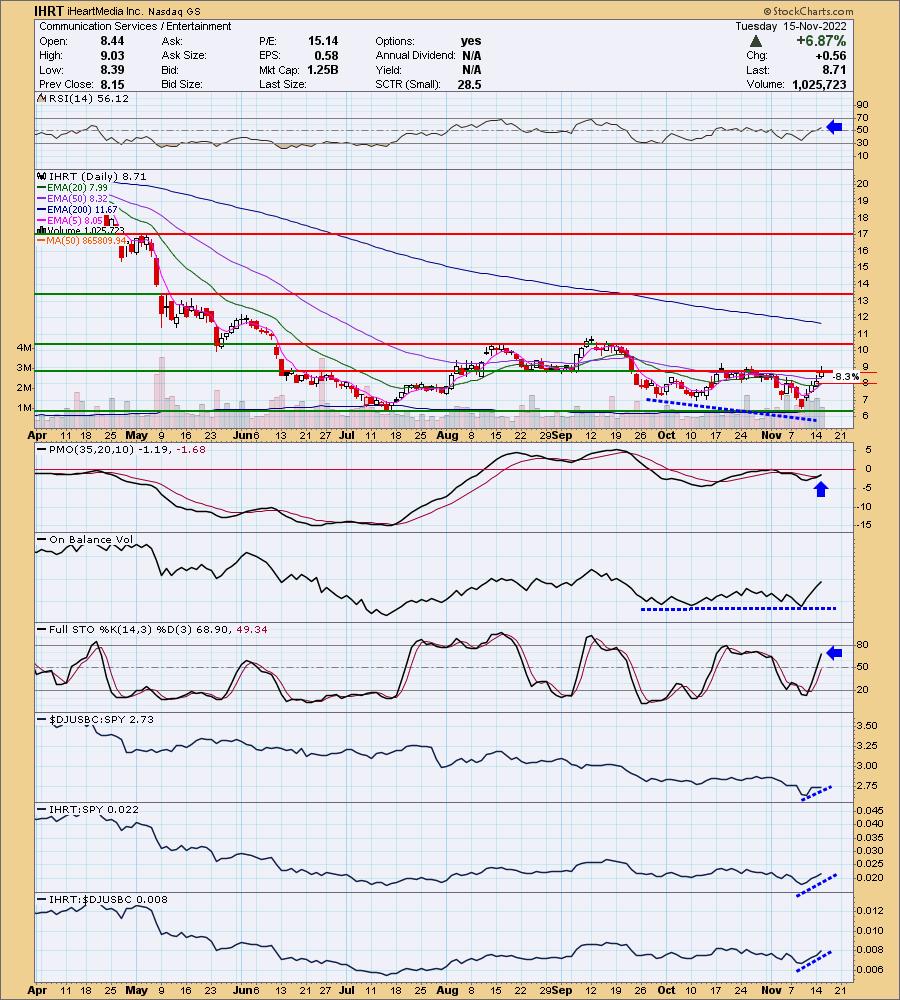
IHRT is up +3.33% in after hours trading so we may be onto something here. It was up well over 6% today, but I think it has more to go. Today was the first time since September since it fully traded above the 50-day EMA. We got a Short-Term Trend Model BUY signal as the 5-day EMA crossed above the 20-day EMA. The RSI is just now positive and today we had a PMO crossover BUY signal. There is a positive OBV divergence with price bottoms. Stochastics are on their way to territory above 80 which we want. Relative strength is improving for the group and IHRT. It beginning to outperform its group. The stop could honestly be set deeper given today's big rally, but for now I have it set at 8.3% around $7.98.
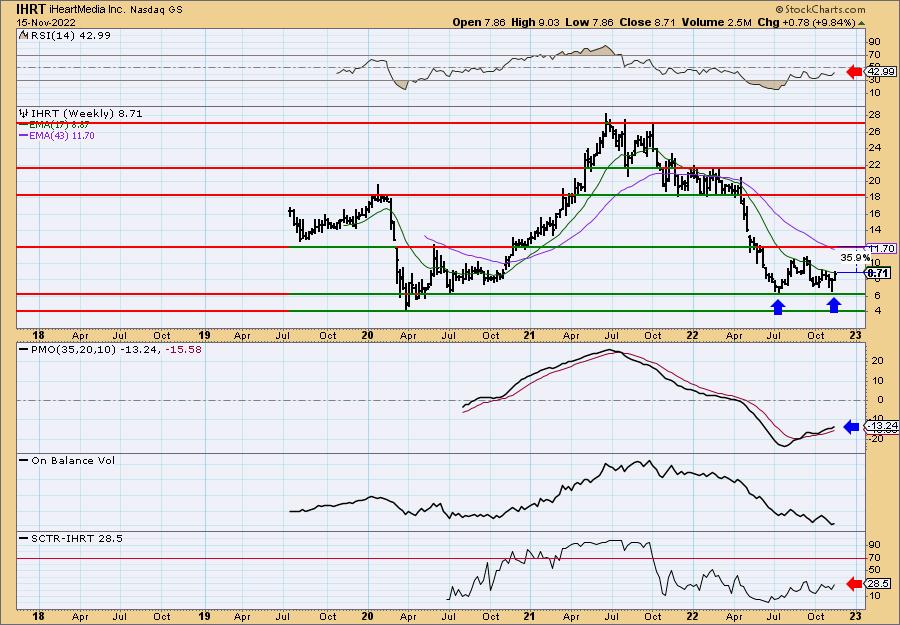
It's way too early, but we can keep an eye out for a bullish double-bottom here. The weekly RSI is negative, but the weekly PMO looks excellent with another bottom above the signal line. The SCTR is weak, but this stock is rather beat down. Still the weekly chart does imply we are getting in early with some risk. The upside potential is listed at the 2019 low and mid-2020 top.
Paylocity Holding Corp. (PCTY)
EARNINGS: 02/02/2023 (AMC)
Paylocity Holding Corp. engages in the development and provision of cloud-based software solutions. It offers cloud-based payroll, human capital management applications, time labor tracking, benefits administration, and talent management. The company was founded by Steve I. Sarowitz in 1997 and is headquartered in Schaumburg, IL.
Predefined Scans Triggered: Gap Ups, Parabolic SAR Buy Signals, Runaway Gap Ups and P&F Low Pole.
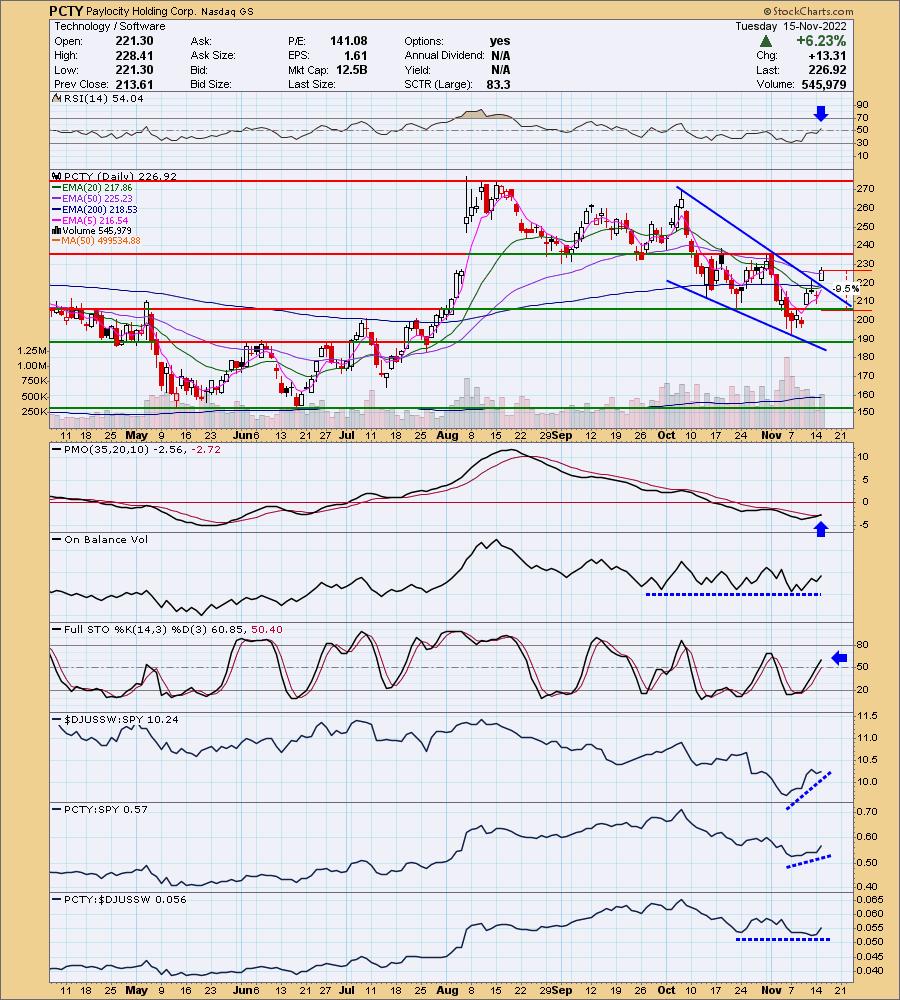
PCTY is unchanged in after hours trading. We have a large bullish falling wedge which was confirmed with today's gap up breakout. Notice that price also overcame resistance at the 50-day EMA. The RSI is now in positive territory and the PMO triggered a crossover BUY signal today. There is a positive OBV divergence with price lows. Relative strength is improving for the group and PCTY is showing new strength against the SPY. It tends to perform inline with its group and since the group is outperforming, PCTY is doing well against the SPY. The stop is deep, but it has to be given today's over 6%+ rally. It will thin out if you get PCTY on a pullback. Consider a 9.5% stop around $205.36.
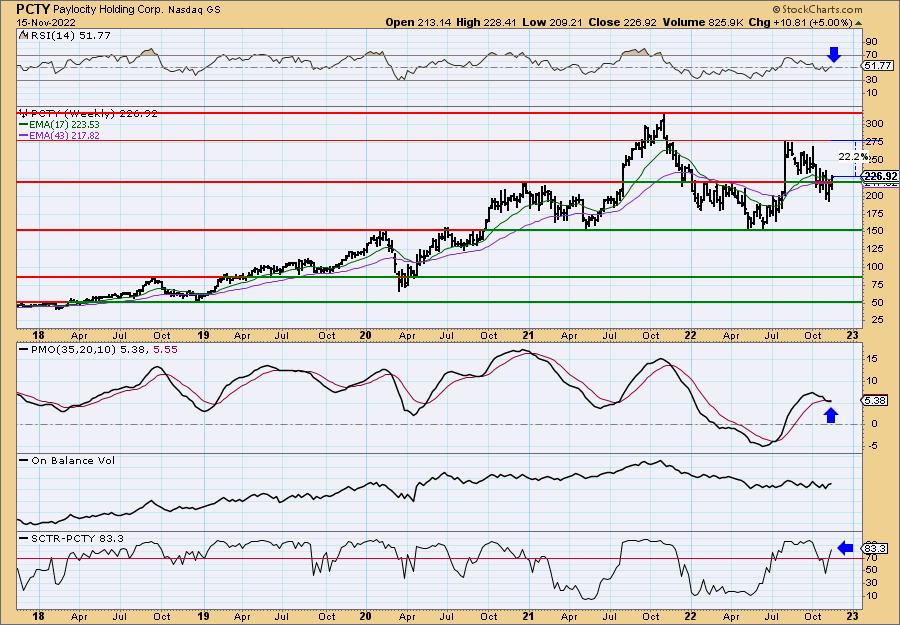
The declining trend is still intact on the weekly chart, but the weekly RSI has moved into positive territory and the weekly PMO is turning back up into a whipsaw crossover BUY signal in the intermediate term. The SCTR is in the "hot zone" above 70, meaning it is in the top third of stocks based on trend and condition within its "universe" (large-caps, mid-caps, small-caps or ETFs). Upside potential is over 22%.
Zscaler, Inc. (ZS)
EARNINGS: 12/01/2022 (AMC)
Zscaler, Inc. engages in the provision of a cloud-based internet security platform. It offers Zero Trust Exchange, Zscaler Client Connector, Zscaler Internet Access, Zscaler Private Access, Zscaler B2B, Zscaler Cloud Protection, and Zscaler Digital Experience. The company was founded by Jagtar Singh Chaudhry and K. Kailash in September 2007 and is headquartered in San Jose, CA.
Predefined Scans Triggered: P&F Ascending Triple Top Breakout and P&F Double Top Breakout.
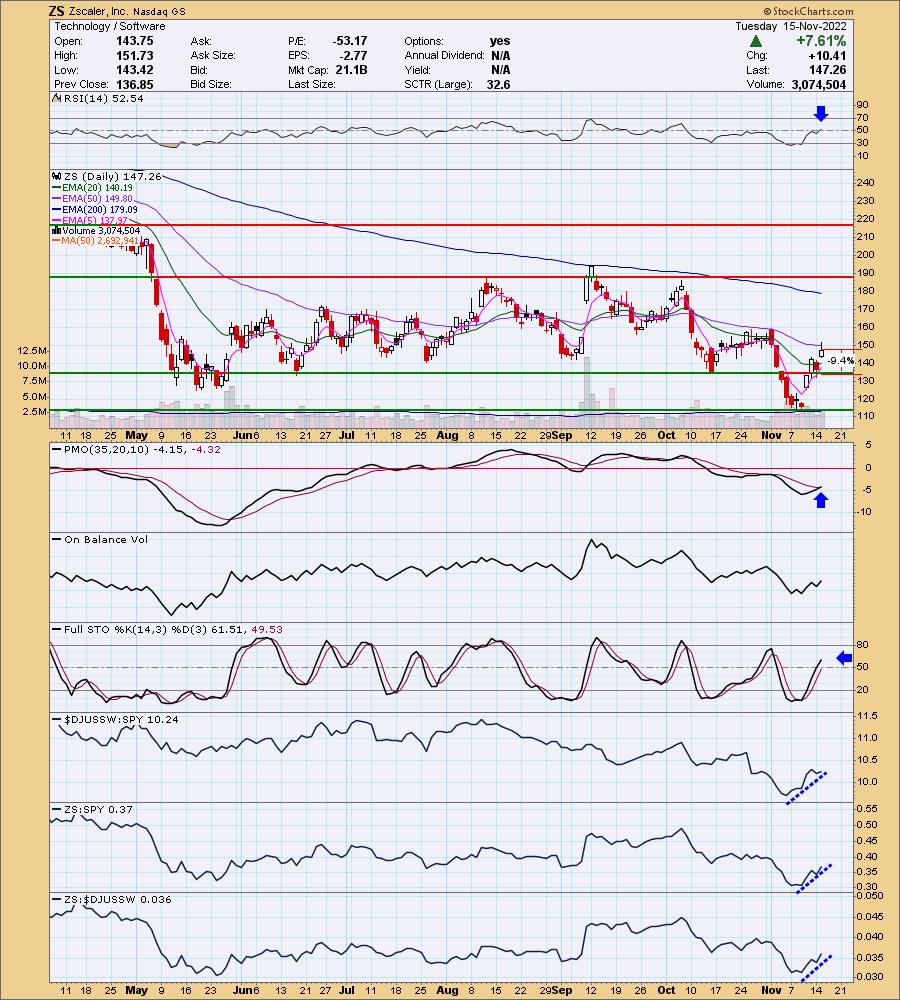
ZS is down -0.38% in after hours trading. IT managed to trade completely above the 20-day EMA today and had what looks like a continuation gap after the breakaway gap that began this rally. The RSI just hit positive territory. The PMO triggered a crossover BUY signal and Stochastics are rising toward 80. Relative strength is excellent in the near term. The stop is deep, but as with the others today, it was necessary given the giant rally it enjoyed today. You'll likely be able to add these on a pullback and that would make the stop less deep. It is listed at 9.4% or around $133.42.
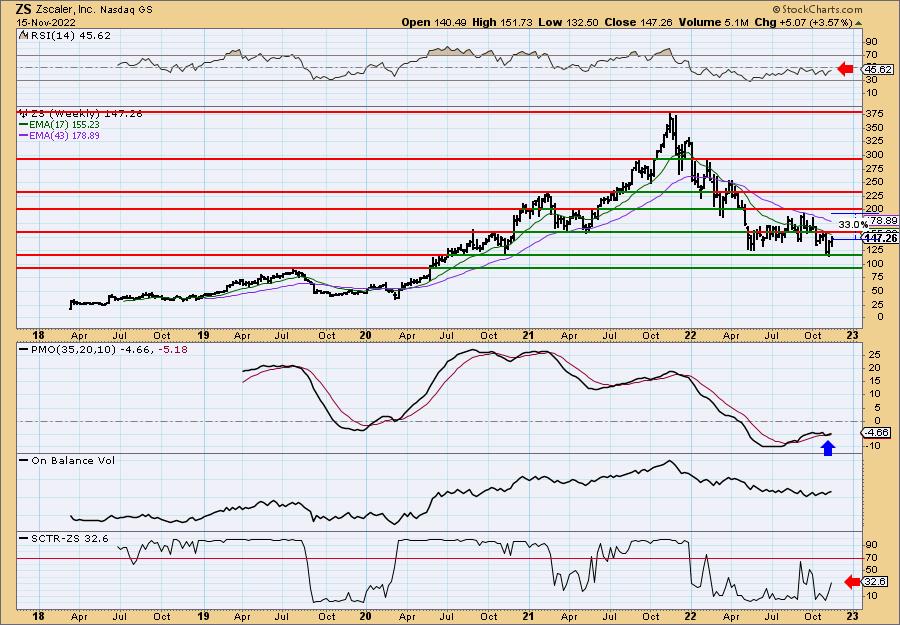
I love the look of the weekly PMO as it has bottomed above the signal line and is moving higher. Unfortunately the weekly RSI isn't yet confirming and the SCTR is on the low side, but if my analysis is correct on the daily chart, upside potential is around 33%.
Don't forget, on Thursdays I look at reader-requested symbols, click HERE to send me an email. I read every email I receive and try to answer them all!
Current Market Outlook:
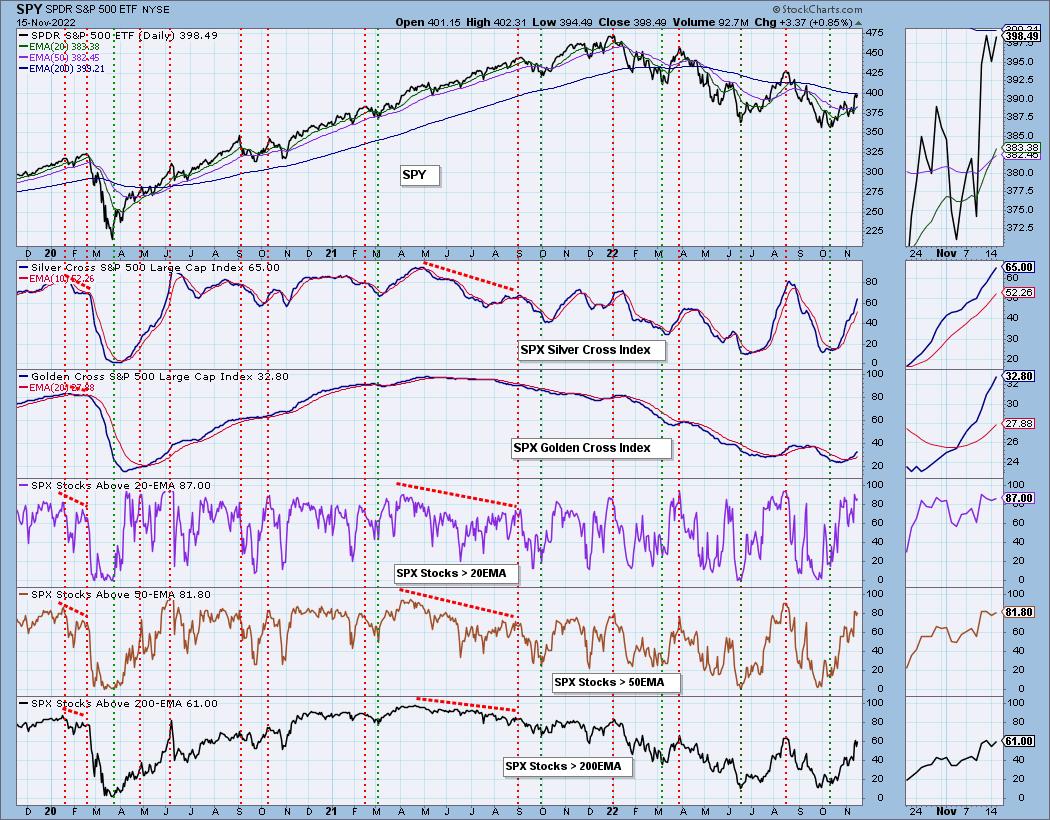
Market Environment: It is important to consider the odds for success by assessing the market tides. The following chart uses different methodologies for objectively showing the depth and trend of participation for intermediate- and long-term time frames.
- The Silver Cross Index (SCI) shows the percentage of SPX stocks on IT Trend Model BUY signals (20-EMA > 50-EMA)
- The Golden Cross Index (GCI) shows the percentage of SPX stocks on LT Trend Model BUY signals (50-EMA > 200-EMA)
Don't forget that as a "Diamonds" member, you have access to our GCI/SCI curated ChartList on DecisionPoint.com. You'll find it under "Members Only" links on the left side on the Blogs and Links Page.
Here is the current chart:
Full Disclosure: I am 55% exposed.
I'm required to disclose if I currently own a stock I mention and/or may buy/short it within the next 72 hours.
"Technical Analysis is a windsock, not a crystal ball." - Carl Swenlin
(c) Copyright 2022 DecisionPoint.com
Watch the latest episode of DecisionPoint with Carl & Erin Swenlin on Mondays 7:00p EST or on the DecisionPoint playlist on the StockCharts TV YouTube channel here!
NOTE: The stocks reported herein are from mechanical trading model scans that are based upon moving average relationships, momentum and volume. DecisionPoint analysis is then applied to get five selections from the scans. The selections given should prompt readers to do a chart review using their own analysis process. This letter is not a call for a specific action to buy, sell or short any of the stocks provided. There are NO sure things or guaranteed returns on the daily selection of "Diamonds in the Rough."
Regarding BUY/SELL Signals: The signal status reported herein is based upon mechanical trading model signals and crossovers. They define the implied bias of the price index/stock based upon moving average relationships and momentum, but they do not necessarily call for a specific action. They are information flags that should prompt chart review. Further, they do not call for continuous buying or selling during the life of the signal. For example, a BUY signal will probably (but not necessarily) return the best results if action is taken soon after the signal is generated. Additional opportunities for buying may be found as price zigzags higher, but the trader must look for optimum entry points. Conversely, exit points to preserve gains (or minimize losses) may be evident before the model mechanically closes the signal.
Helpful DecisionPoint Links:
DecisionPoint Shared ChartList and DecisionPoint Chart Gallery
Price Momentum Oscillator (PMO)
Swenlin Trading Oscillators (STO-B and STO-V)
For more links, go to DecisionPoint.com