
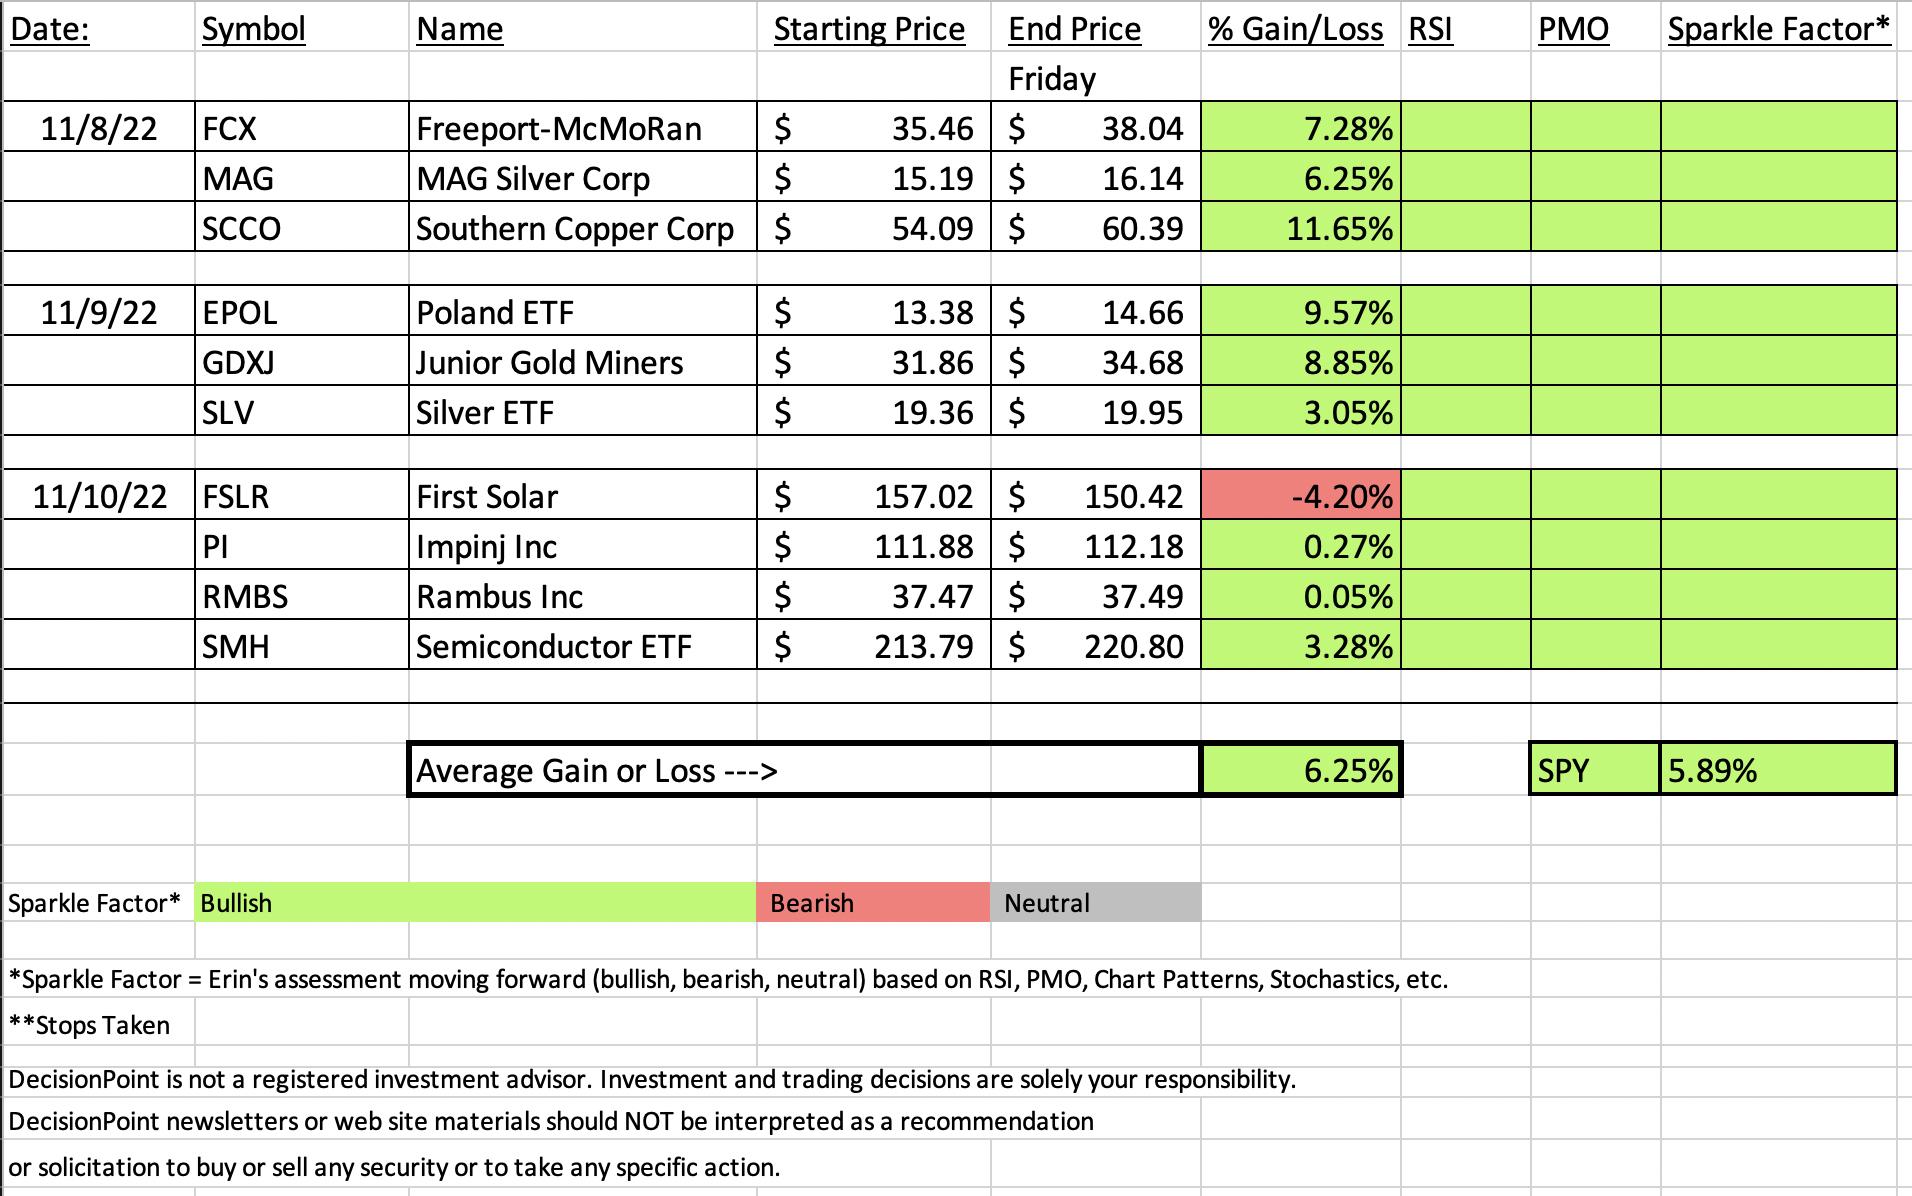
It was a great week for the market and consequently a great week for "Diamonds in the Rough". Only one of the ten "Diamonds in the Rough" finished lower on the week, but every stock/ETF have good to fantastic prospects moving forward. Every position has a rising PMO and positive RSI. The bear market rally is back on.
I just got to my brother's house in Utah. I am here just until Sunday morning. Wanted to come see my nephews' in their school musical Saturday night. One of them has a starring role! I will "see" you in Monday's DecisionPoint Trading Room on StockChartsTV!
The link for today's Diamond Mine recording is below the diamonds logo and will continue to be in the reports.
Have a great weekend!
Good Luck & Good Trading,
Erin

TODAY'S RECORDING LINK (11/11/2022):
Topic: DecisionPoint Diamond Mine (11/11/2022) LIVE Trading Room
Start Time: Nov 11, 2022 09:00 AM
Passcode: Nov*11th
NEXT DIAMOND MINE Trading Room on November 18th 2022:
When: Nov 18, 2022 09:00 AM Pacific Time (US and Canada)
Topic: DecisionPoint Diamond Mine (11/18/2022) LIVE Trading Room
Register in advance for this webinar HERE
Save the registration confirmation email with login instructions in case Zoom doesn't notify you in time.

Our latest DecisionPoint Trading Room recording:
A few items about the spreadsheet: I've put on the spreadsheet whether the RSI is positive (green) or negative (red). The PMO column tells you if it is rising (green) or falling (red). Finally I've added my own "Sparkle Factor" that gives you my assessment going forward, bullish (green), bearish (red) or neutral (gray). The Sparkle Factor is basically my thoughts on whether I expect it to rise or fall. A neutral means it could really go either way so it could be added to a watch list. If you're in a stock I consider "neutral" going forward, the ball is in your court.
Darling:
Southern Copper Corp. (SCCO)
EARNINGS: 01/31/2023 (AMC)
Southern Copper Corp. engages in the development, production, and exploration of copper, molybdenum, zinc, and silver. It operates through the following segments: Peruvian Operations, Mexican Open-Pit Operations, and Mexican Underground Mining Operations. The Peruvian Operations segment focuses on the Toquepala and Cuajone mine complexes and the smelting and refining plants, industrial railroad, and port facilities that service both mines. The Mexican Open-Pit Operations segment comprises the La Caridad and Buenavista mine complexes, the smelting, and refining plants and support facilities, which service both mines. The Mexican Underground Mining Operations segment is involved in the operation of five underground mines, a coal mine, and several industrial processing facilities. The company was founded on December 12, 1952 and is headquartered in Phoenix, AZ.
Predefined Scans Triggered: Moved Above Upper Keltner Channel, Moved Above Upper Price Channel, P&F Ascending Triple Top Breakout and P&F Double Top Breakout.
Below are the commentary and chart from Tuesday 11/8:
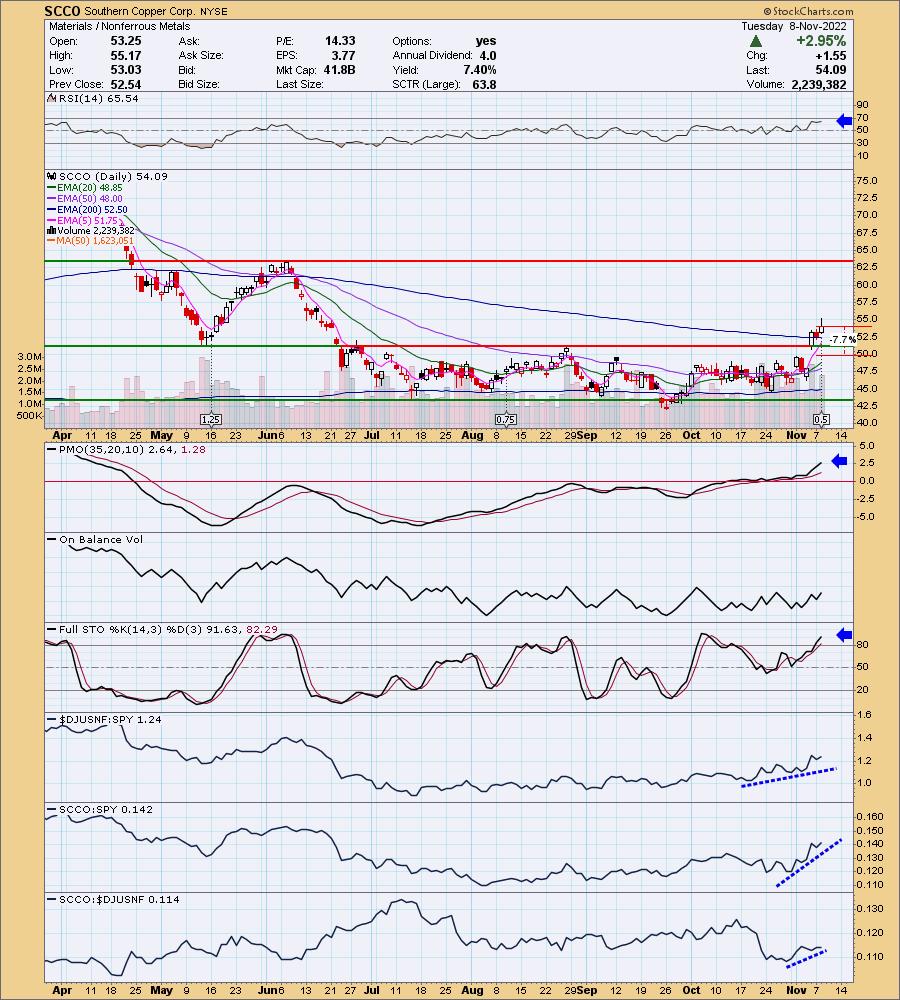
"SCCO is unchanged in after hours trading. It shouldn't surprise you that all of these charts are similar, they come from the same industry group. Clearly Friday was an awesome day for this group given all the gap ups I'm seeing on these charts. SCCO also has overcome resistance at the 200-day EMA. The RSI is positive and not overbought. The PMO is accelerating higher and is not overbought. Stochastics are above 80 and have been basically in positive territory above 50 since the beginning of October. Relative strength of the group and SCCO against the SPY has been steadily rising with SCCO beginning to show some outperformance against the group. The stop is set below support at 7.7% around $49.92."
Here is today's chart:
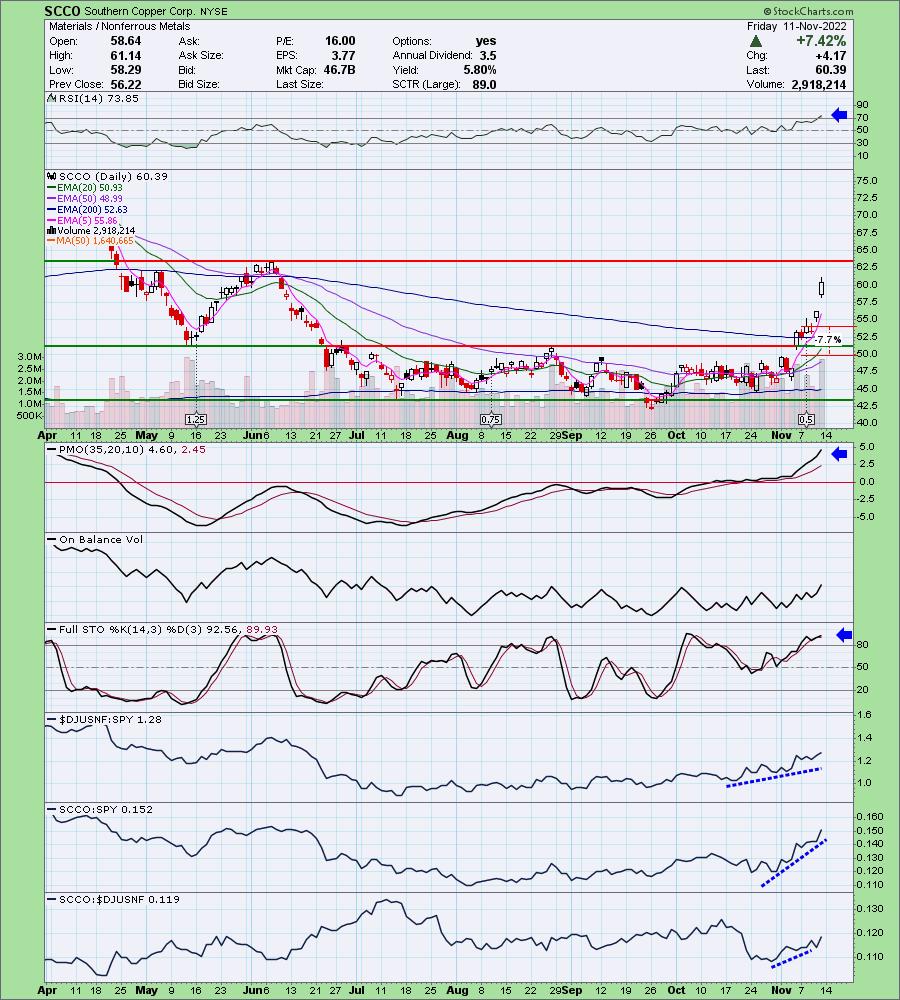
Materials were the "darlings" this week so not a surprise that SCCO is a winner. Copper in general looks very bullish. The other selection on Tuesday, Freeport McMoRan (FCX) is also in the Copper business. I see plenty of upside left even though resistance is arriving soon. Indicators are very bullish. We could see a small pullback once resistance is hit, but I suspect given the indicators, it will be quick and relatively painless before it heads higher.
Don't forget, on Thursdays I look at reader-requested symbols, so shoot me an email at erin@decisionpoint.com. I read every email I receive and try to answer them all!
Dud:
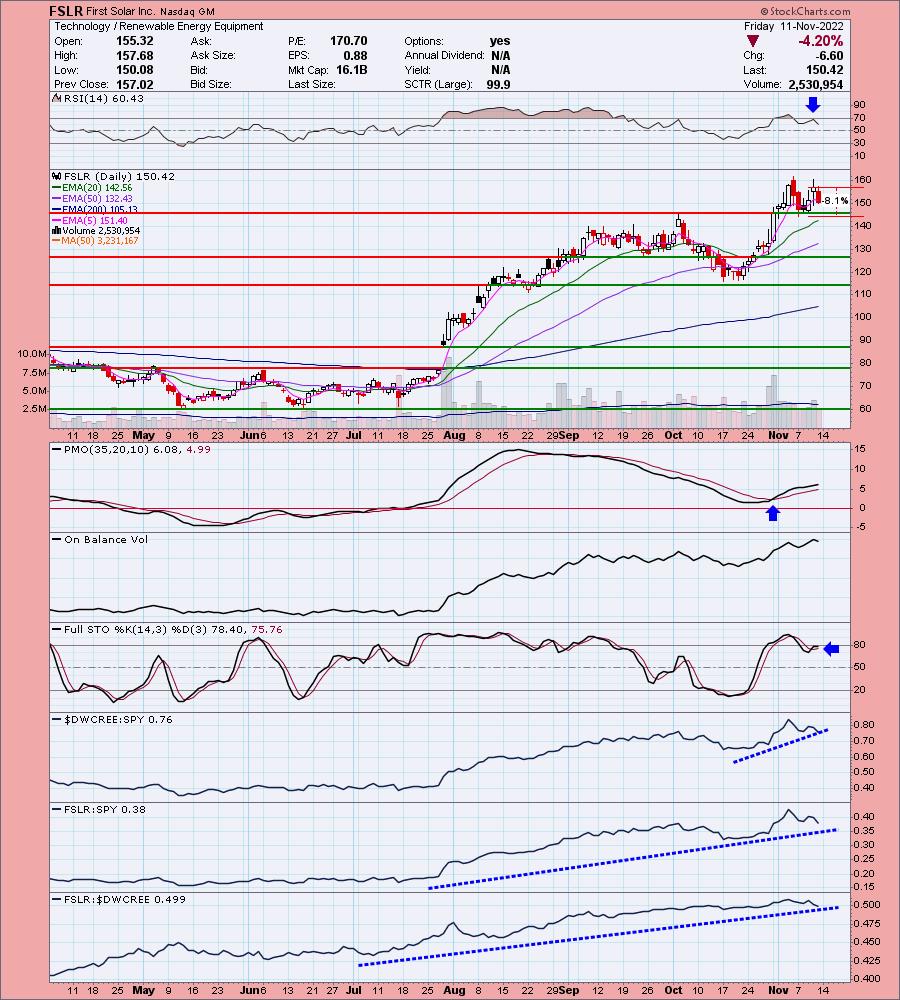
First Solar Inc. (FSLR)
EARNINGS: 03/01/2023 (AMC)
First Solar, Inc. engages in designing, manufacturing, marketing, and the distribution of photovoltaic solar power systems and solar modules. It operates through the Modules and Systems segments. The Modules segment involves the design, manufacture, and sale of cadmium telluride solar modules, which convert sunlight into electricity. The Systems segment offers development, construction, operation, and maintenance of photovoltaic solar power systems. The company was founded by Michael J. Ahearn in 1999 and is headquartered in Tempe, AZ.
Predefined Scans Triggered: Elder Bar Turned Green and New CCI Buy Signals.
Below are the commentary and chart from yesterday 11/10:
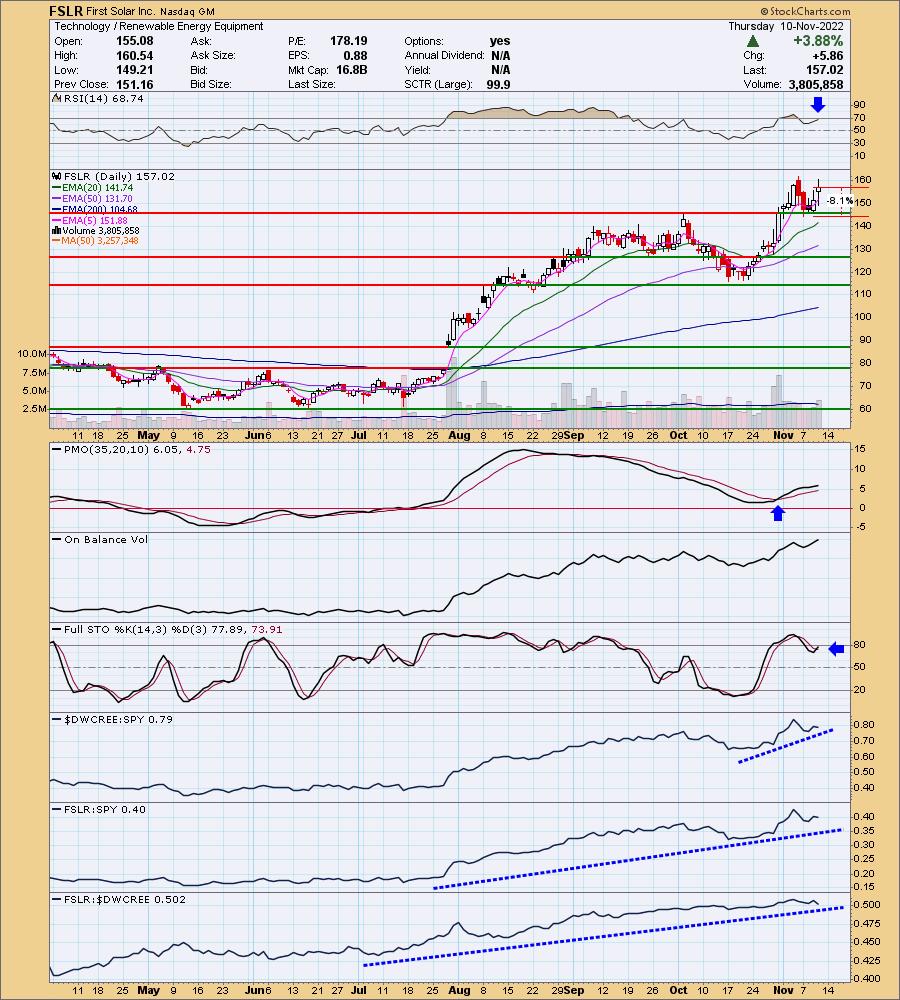
"FSLR is down -0.59% in after hours trading. I like the breakout and then textbook pullback toward the breakout point. That pullback also is a flag on a flagpole which means the bull flag has been confirmed with today's breakout. As noted in the opening, I would not be surprised if we see a pause or another pullback if the group itself dials it back. The RSI is positive and the PMO is on a BUY signal and not overbought. Stochastics have turned back up and are already nearing territory above 80. Relative strength has been picking up for the group since October and FSLR tends to outperform or travel inline with the group. I've set the stop at 8.1% around $144.30."
Here is today's chart:
I think this is still a good call although I do not like the small double-top that formed with today's decline. I just believe that today's decline is a textbook pullback after a big rally day. It needed to digest. This is a bit close to indigestion given the depth of the decline, but overall I like Renewable Energy. As you know, I own the Solar ETF (TAN) currently and have no plans of selling at the moment. The position is up well over 12% right now. FSLR should catch up quickly. So while it is labeled a "Dud", it really isn't.
THIS WEEK's Sector Performance:

DecisionPoint Sector Scoreboard (Mechanical Trend Model Signals):

Click Here to view Carl's annotated Sector ChartList!
RRG® Daily Chart ($ONE Benchmark):
We don't actually need to see the RRG to see where new strength lies. A CandleGlance of the sectors tell you that new momentum is in XLB, XLC, XLK and XLY. On the daily RRG XLB, XLC and XLK have all three now have bullish northeast headings. XLY isn't far behind, it just doesn't have an eastward component yet to its heading.
No other sectors have northeast headings which surprised us. What is good is that even though we have southwest headings and south or west components to headings, all but two are on the right side of the graph. If they are on the right side of the graph it implies internal strength. Still, we would like to see the others reverse headings like XLC, XLB, XLK and XLY.

RRG® Weekly Chart ($ONE Benchmark): The weekly chart reflects new strength coming back into the market as all of the sectors are beginning to curl up into bullish northeast headings. Note that all but XLE are on the left side of the RRG, this tells us all of these sectors are still weak. XLB, XLF and XLV are within the Improving quadrant and moving toward Leading, but there is still overall weakness due to begin on the left hand side of the RRG.

RRG® charts show you the relative strength and momentum for a group of stocks. Stocks with strong relative strength and momentum appear in the green Leading quadrant. As relative momentum fades, they typically move into the yellow Weakening quadrant. If relative strength then fades, they move into the red Lagging quadrant. Finally, when momentum starts to pick up again, they shift into the blue Improving quadrant.
CLICK HERE for an animated version of the RRG charts.
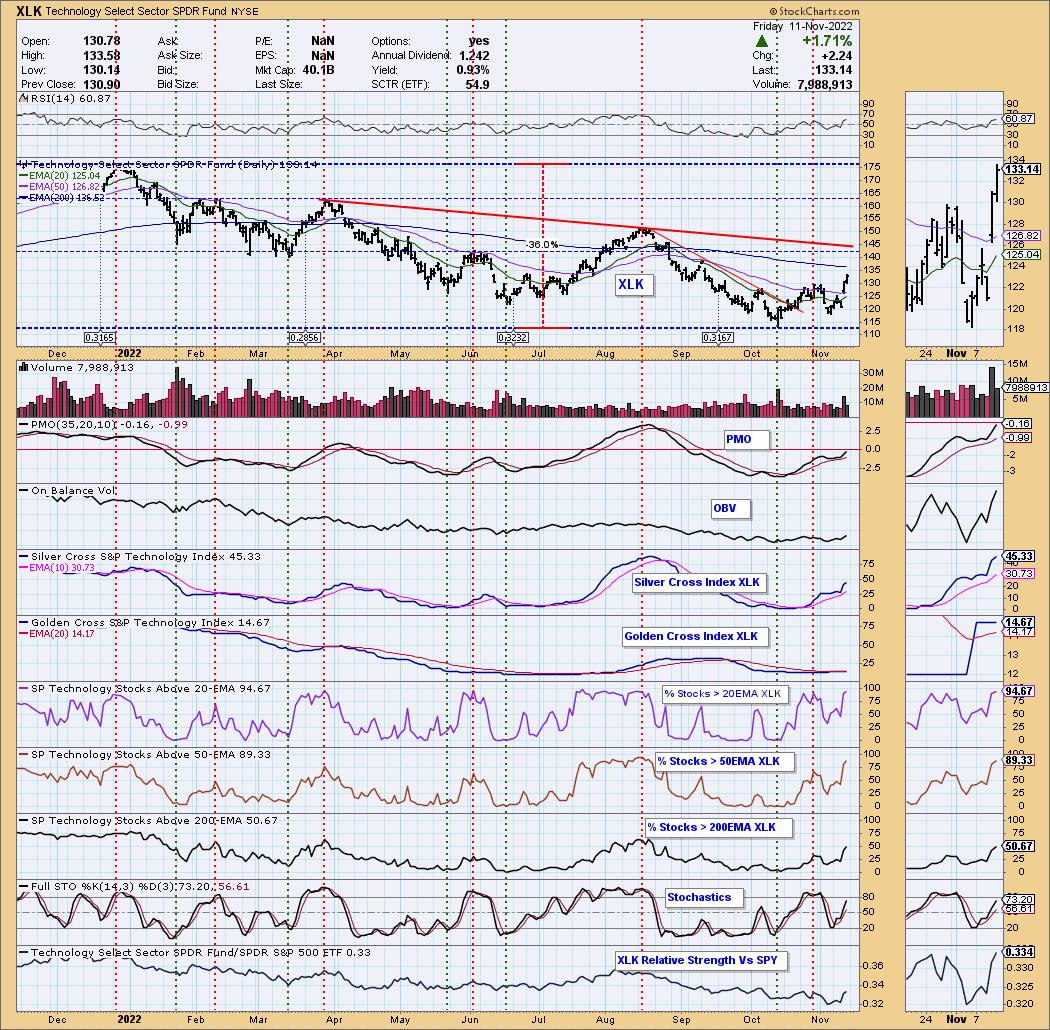
Sector to Watch: Technology (XLK)
In the Diamond Mine this morning, we determined that the sectors showing new momentum were XLC, XLK and XLY. After reviewing them, I decided that Technology looked the most favorable. We have a strong price breakout combined with very favorable indicators. The RSI is positive and not overbought. The PMO is rising after bottoming above the signal line; it is also getting close to positive territory. Stochastics are rising strongly as is relative strength. Participation strong. There are over 94% above their 20-day EMAs and 89% above their 50-day EMAs. That will keep the rally powering higher in Tech. Look for this sector to surge next week barring any black swan event.
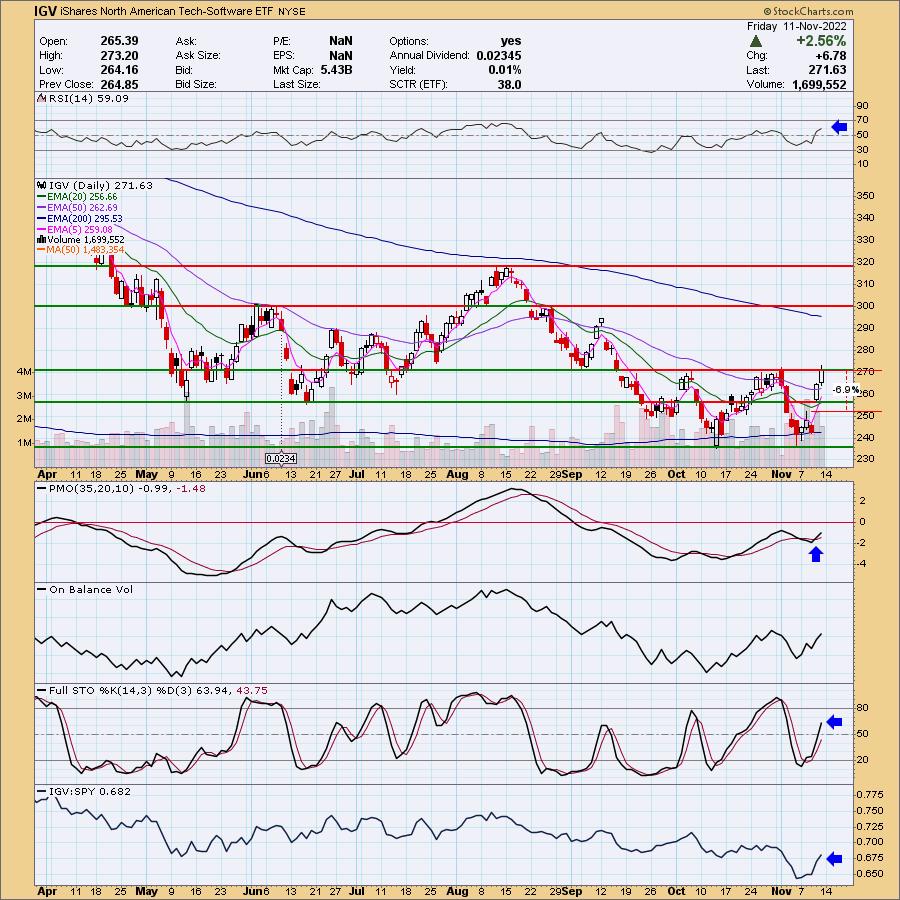
Industry Group to Watch: Software (IGV)
Since we have an ETF for the Software industry group, I decided to present it as a possible trade. We don't actually have the breakout here, but the indicators look great. The RSI is positive, rising and not overbought. The PMO is on a new crossover BUY signal. Stochastics are rising strongly and should get above 80 soon. Relative strength is rising quickly. We "mined" for a few stocks in this group in this morning's Diamond Mine and these were the ones I liked best upon a quick review: VERX, ENFN, INVZ and FUTU.
Go to our Sector ChartList on DecisionPoint.com to get an in-depth view of all the sectors. On StockCharts.com you can find the Industry Summary.
Have a great weekend! Good Luck & Good Trading!
- Erin
erin@decisionpoint.com
Full Disclosure: I'm 55% exposed.
Watch the latest episode of DecisionPoint with Carl & Erin Swenlin on Mondays 7:00p EST or on the DecisionPoint playlist on the StockCharts TV YouTube channel here!
Technical Analysis is a windsock, not a crystal ball. --Carl Swenlin
NOTE: The stocks reported herein are from mechanical trading model scans that are based upon moving average relationships, momentum and volume. DecisionPoint analysis is then applied to get five selections from the scans. The selections given should prompt readers to do a chart review using their own analysis process. This letter is not a call for a specific action to buy, sell or short any of the stocks provided. There are NO sure things or guaranteed returns on the daily selection of "diamonds in the rough."
Helpful DecisionPoint Links:
DecisionPoint Shared ChartList and DecisionPoint Chart Gallery
Price Momentum Oscillator (PMO)
Swenlin Trading Oscillators (STO-B and STO-V)
(c) Copyright 2022 DecisionPoint.com