
I'm always curious what y'all will bring to the table for Reader Request Day. Not all were "Diamonds in the Rough" based on my primary indicators, but most fit the bill enough to make the list today.
My purpose for Reader Request Day is not to necessarily share great picks, but to basically grade your work like a teacher. I do want to pick those that have the best chance at success, but that isn't always possible.
Don't forget to register for tomorrow's Diamond Mine trading room! The recording from last week and this week's registration link is below the Diamonds logo.
Good Luck & Good Trading!
Erin
Today's "Diamonds in the Rough": AEO, ASAI, EPIX and SBS.
Other Requests (not runner-ups): BBIO, WEBL, PRTA, AMBC, AXSM, MRSN and DNLI.

RECORDING LINK (10/28/2022):
Topic: DecisionPoint Diamond Mine (10/28/2022) LIVE Trading Room
Recording Link HERE
Passcode: Oct-28th
REGISTRATION LINK (11/4/2022):
When: Nov 4, 2022 09:00 AM Pacific Time (US and Canada)
Topic: DecisionPoint Diamond Mine (11/4/2022) LIVE Trading Room
Register in advance for this webinar HERE
After registering, you will receive a confirmation email containing information about joining the webinar.

Here is the last recording:
Welcome to DecisionPoint Diamonds, wherein I highlight ten "Diamonds in the Rough" per week. These are selected from the results of my DecisionPoint Scans which search for stocks that could benefit from the trend and condition of the market. Remember, these are not recommendations to buy or sell, but are the most interesting of the stocks that surfaced in my scans. My objective is to save you the work of the initial, tedious culling process, but you need to apply your own analysis to see if these stocks pique your interest as well. There are no guaranteed winners here!
"Predefined Scans Triggered" are taken from StockCharts.com using the "Symbol Summary" option instead of a "SharpChart" on the workbench.
American Eagle Outfitters, Inc. (AEO)
EARNINGS: 11/22/2022 (BMO)
American Eagle Outfitters, Inc. is a multi-brand specialty retailer, which offers an assortment of apparel and accessories for men and women under the American Eagle Outfitters brand, and intimates, apparel and personal care products for women under the Aerie brand. The firm operates stores in the United States, Canada, Mexico, Hong Kong, China and the United Kingdom. It also acquired two emerging brands to complement its existing brands, Tailgate, a vintage sports-inspired apparel brand, and Todd Snyder New York, a premium menswear brand. The company was founded in 1977 and is headquartered in Pittsburgh, PA.
Predefined Scans Triggered: Elder Bar turned Blue, Parabolic SAR Sell Signals and Piercing Line.
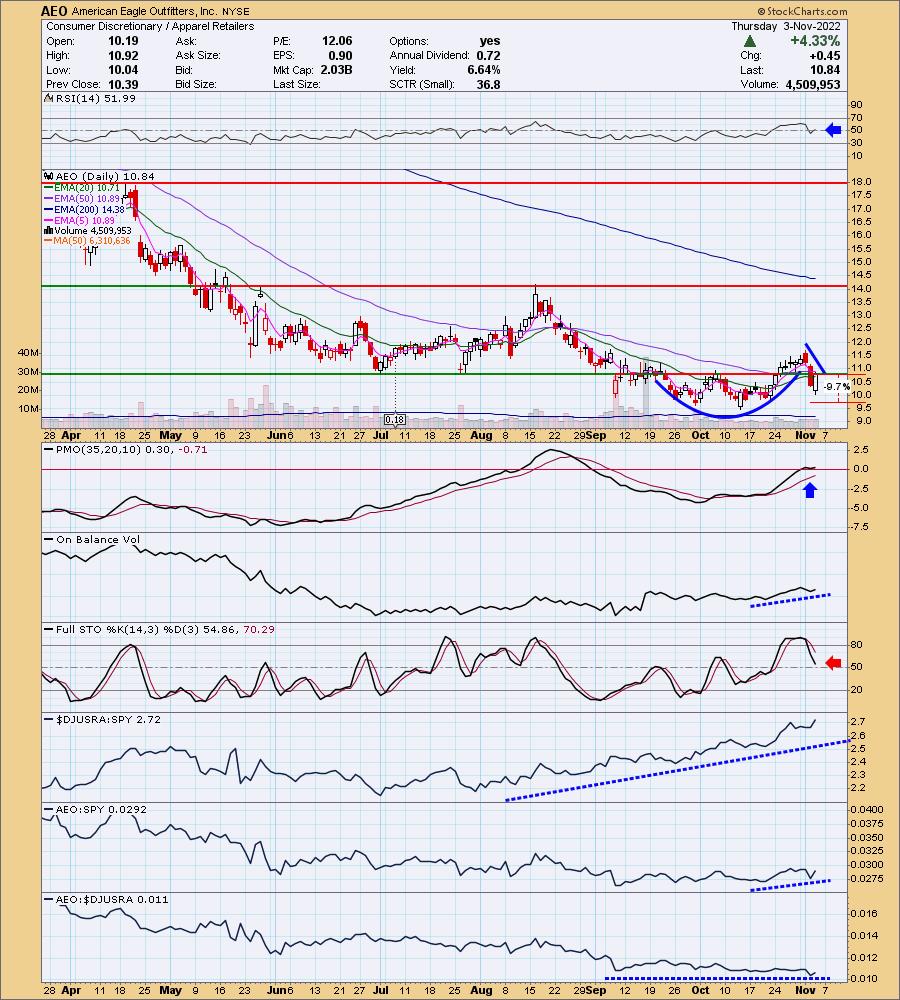
AEO is down -1.85% in after hours trading. I hesitated on this one because Stochastics were pointed downward, but the rest of the chart is encouraging. There is a large cup with handle pattern. Price will need to break out of the handle quickly to confirm the pattern. Price didn't quite close above resistance today so follow-through is necessary. If today's intraday low doesn't hold and price closes lower again, I would probably relinquish this on back to a watch list. What did excite me was the new PMO bottom above the signal line and just above the zero line. The RSI just moved back into positive territory. Relative strength of the group is excellent and AEO is outperforming the SPY. I'd really like to get some confirmation out of Stochastics. The stop is deep mainly because today's gain was over 4%. At this point I've set it at 9.7% around $9.79.
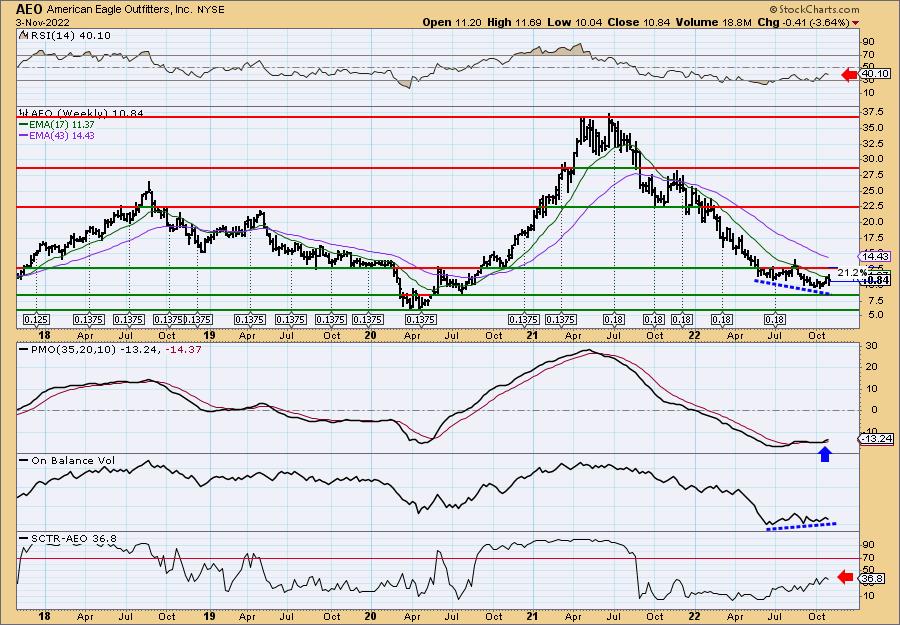
There is an excellent OBV positive divergence on the weekly chart. These usually precede sustained rallies. The weekly RSI is negative but trending a bit higher. The weekly PMO looks excellent as it rises on a BUY signal. Conservatively, upside potential is about 21.2%. That is more than double the stop percentage which is my guideline for setting upside targets.
Sendas Distribuidora S.A (ASAI)
EARNINGS: 02/21/2023 (AMC)
Sendas Distribuidora SA engages in the retail and wholesale of food and other products through its stores. It operates through the Cash and Carry, and Éxito Group segment. The Cash and Carry segment includes its business under the Assai brand. The Éxito Group segment consists of its businesses in Columbia, Argentina, and Uruguay under the Éxito, Surtimax, Super Inter, and Carulla brands. The company was founded by Arthur Antonio Sendas in 1974 and is headquartered in Sao Paulo, Brazil.
Predefined Scans Triggered: New 52-week Highs, Stocks in a New Uptrend (ADX), Moved Above Upper Bollinger Band, Moved Above Upper Price Channel, P&F Double Top Breakout and P&F Triple Top Breakout.
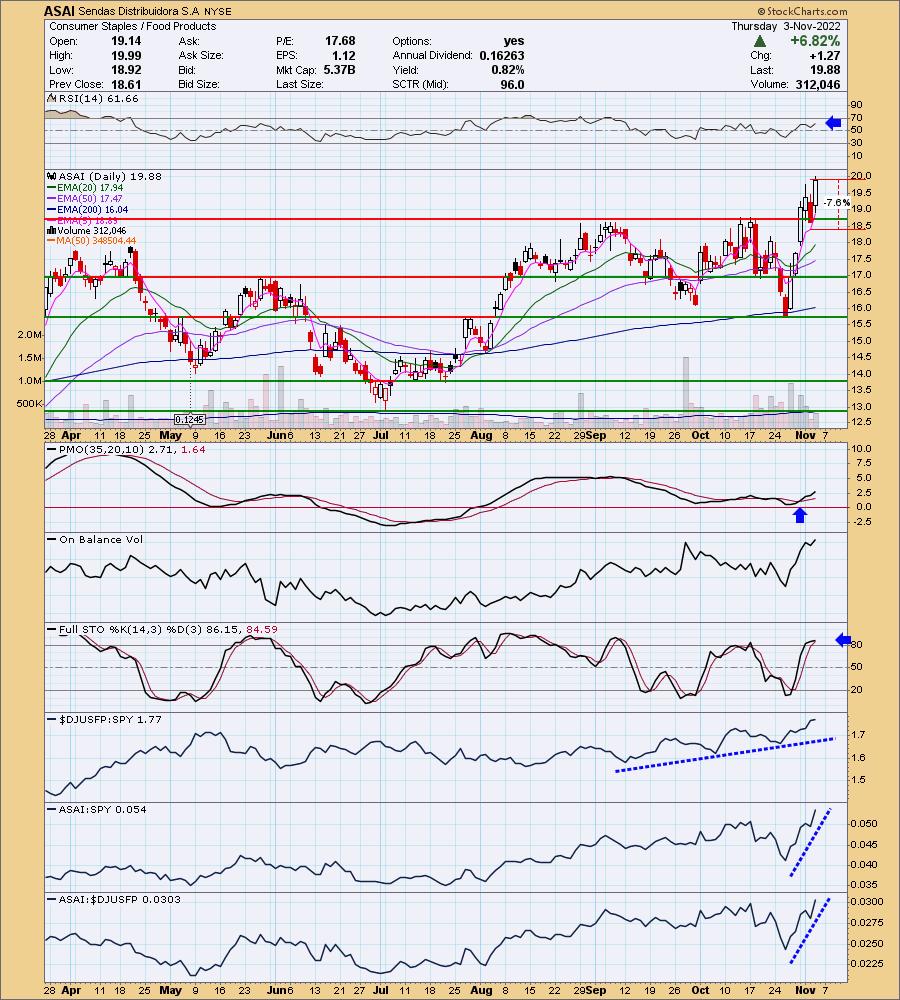
ASAI is up +0.35% in after hours trading. It had a strong breakout on Monday and it is seeing some follow-through. Everything on the chart suggests it will move even higher. There is a positive RSI, a PMO rising on a BUY signal and Stochastics above 80. Relative performance is excellent as well. Given today's big rally, we could see a pullback toward the breakout point as we did yesterday. The stop is set below support at 7.6% around $18.37.
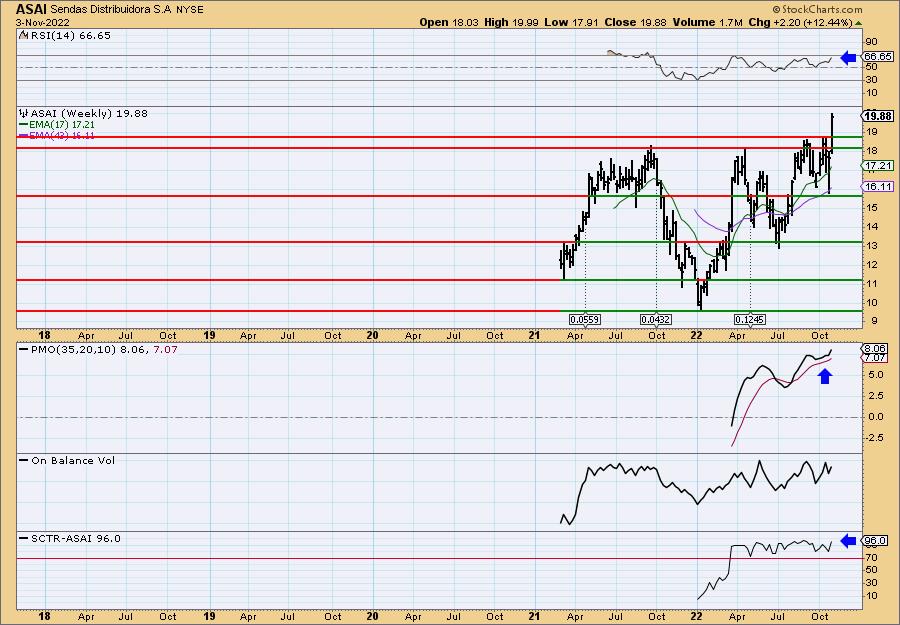
The weekly chart is 'new' so we don't want to read too much into it but... It's a strong weekly chart. The weekly RSI is positive and not overbought. The weekly PMO has bottomed multiple times above its signal line. The SCTR is 96% suggesting ASAI is in the top of its class of mid-cap stocks. Since it is making new 52-week highs, consider an upside target of about 15% near $22.86.
ESSA Pharma Inc. (EPIX)
EARNINGS: 11/17/2022 (BMO)
ESSA Pharma, Inc. is a clinical stage pharmaceutical company. It focuses on developing novel and proprietary therapies for the treatment of prostate cancer in patients, whose disease is progressing despite treatment with standard of care therapies, including second-generation anti-androgen drugs such as abiraterone, enzalutamide, apalutamide and darolutamide. The company was founded by Marianne D. Sadar and Raymond J. Andersen on January 6, 2009 and is headquartered in Vancouver, Canada.
Predefined Scans Triggered: None.
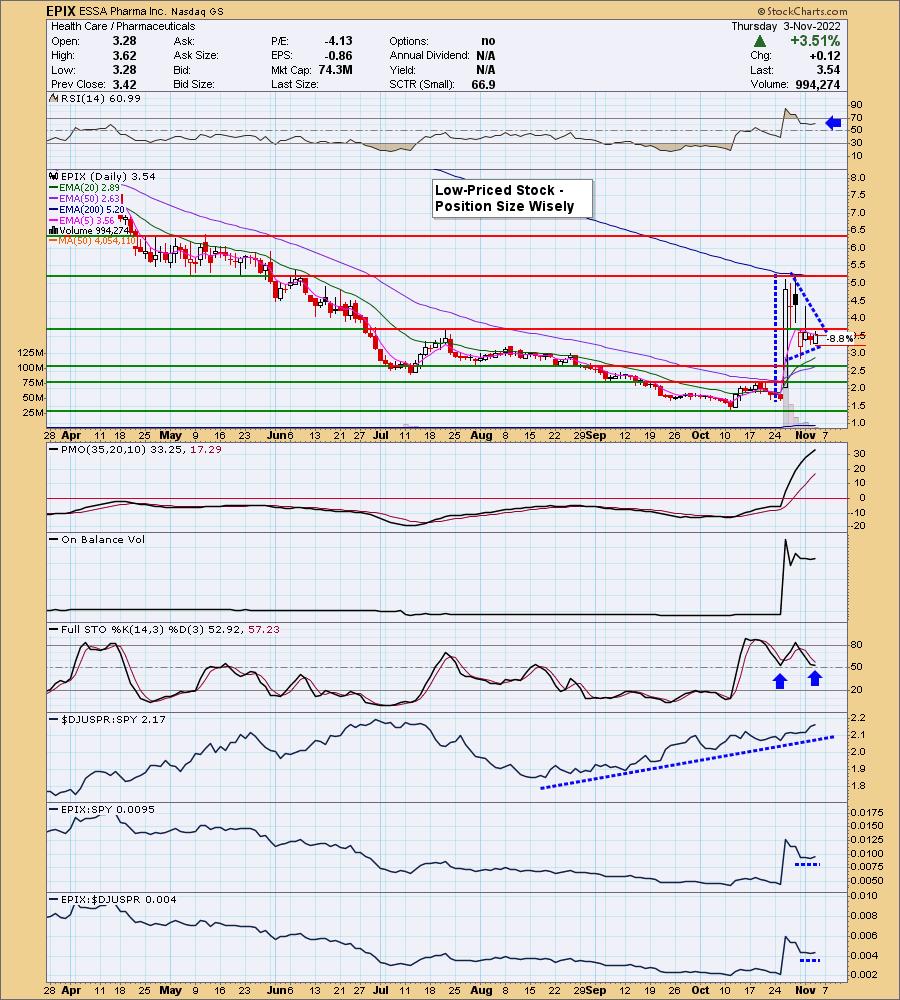
EPIX is down -0.85% in after hours trading. First, note that the price is very low on this stock so while you can buy a ton of shares, position size wisely to avoid getting hurt on a very volatile stock. We have a bull flag-ish pattern or if nothing else, a symmetrical triangle. Each are bullish and each would suggest an upside breakout. The RSI is positive, the PMO is rising (albeit very overbought) and Stochastics are bottoming again in positive territory. Relative strength of Pharma group is strong. This one's performance tends to be inline with the group and that works just fine. The stop is deep due to the low price of the stock and today's 3.51% rally. It's set at 8.8% around $3.22.
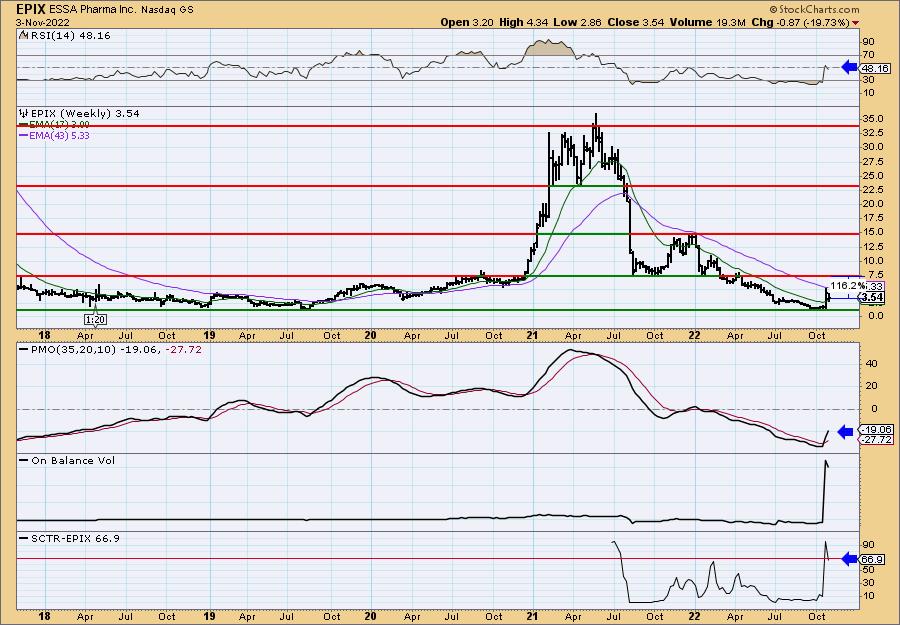
The weekly chart shows this stock is quite volatile but offers amazing upside potential. Again be careful. The weekly RSI is negative, but that is due to the over 19% decline this week. The weekly PMO is rising strongly. The SCTR is now out of the hot zone above 70, but is still mostly respectable. This is high risk so be careful.
Companhia de Saneamento (SBS)
EARNINGS: 11/10/2022 (AMC) ** REPORTS NEXT WEEK **
Companhia de Saneamento Basico do Estado de Sao Paulo SABESP engages in the provision of water and sewage service. It also offers advisory services on the rational use of water, planning and commercial, and financial and operational management. The company was founded on September 6, 1973 and is headquartered in São Paulo, Brazil.
Predefined Scans Triggered: Elder Bar Turned Green, P&F Double Top Breakout and P&F Triple Top Breakout.
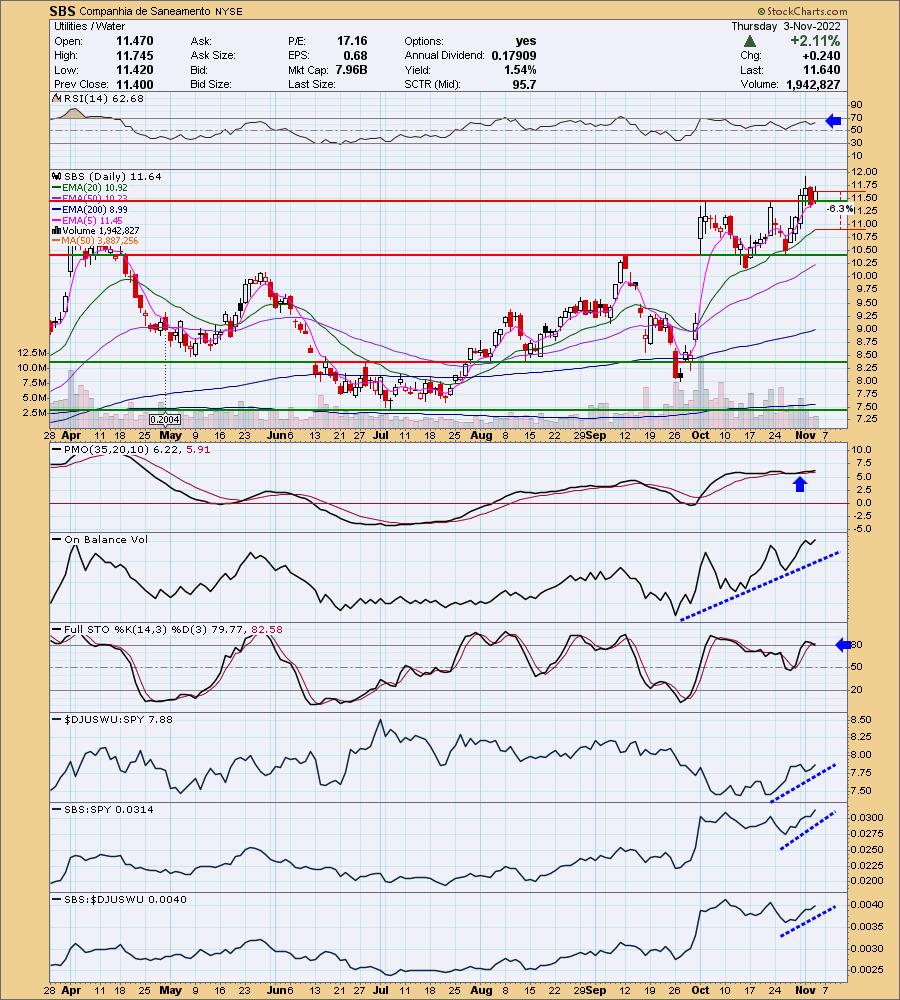
SBS is unchanged in after hours trading. I like the breakout and then pullback to the breakout point. The RSI is positive and the PMO, while flat, is on a BUY signal. The OBV is certainly confirming the rising trend on the big gap up. Stochastics dipped below 80, but are essentially in the zone. Relative strength is excellent across the board. The stop can be set thinly at 6.3% around $10.90.
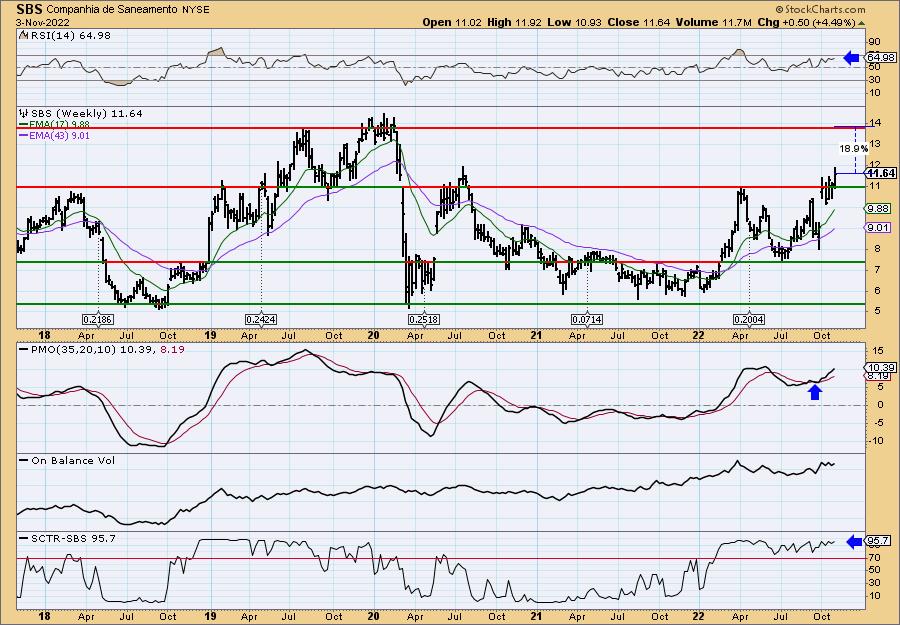
I really like the weekly chart. The weekly RSI is positive and not overbought. The weekly PMO is rising on a BUY signal and isn't really overbought. The SCTR is excellent at 95.7%. Upside potential is about 19%.
Don't forget, on Thursdays I look at reader-requested symbols, click HERE to send me an email. I read every email I receive and try to answer them all!
Current Market Outlook:
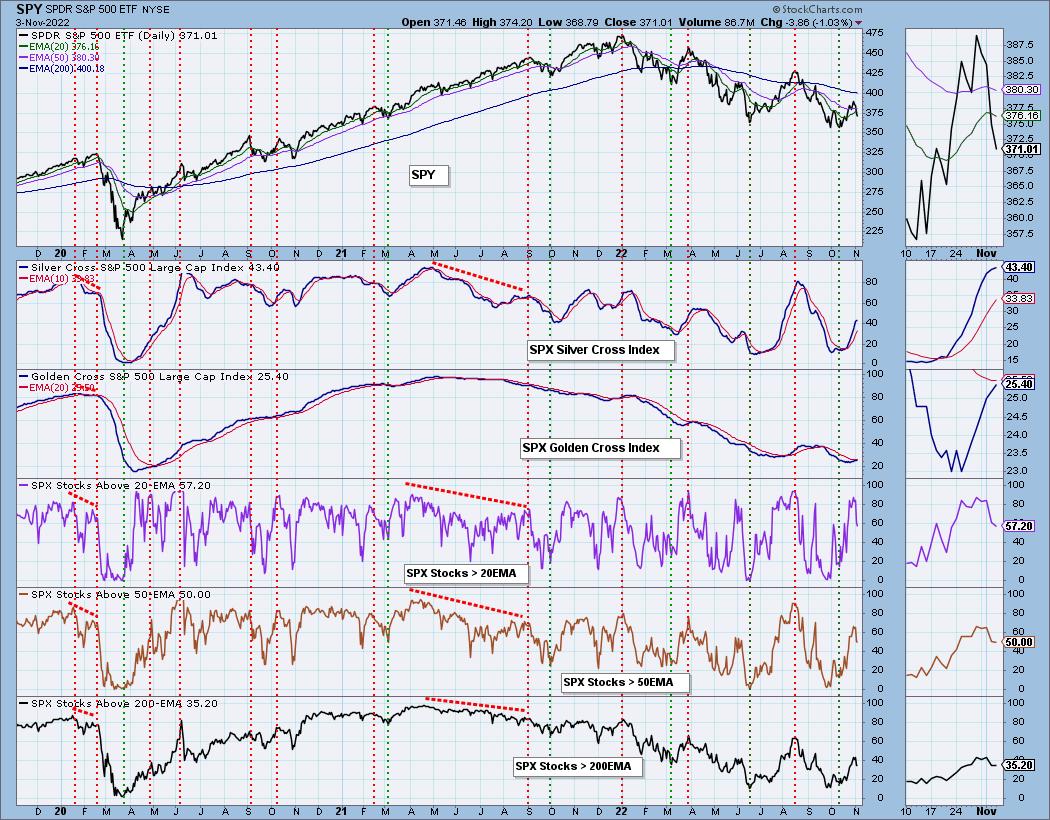
Market Environment: It is important to consider the odds for success by assessing the market tides. The following chart uses different methodologies for objectively showing the depth and trend of participation for intermediate- and long-term time frames.
- The Silver Cross Index (SCI) shows the percentage of SPX stocks on IT Trend Model BUY signals (20-EMA > 50-EMA)
- The Golden Cross Index (GCI) shows the percentage of SPX stocks on LT Trend Model BUY signals (50-EMA > 200-EMA)
Don't forget that as a "Diamonds" member, you have access to our GCI/SCI curated ChartList on DecisionPoint.com. You'll find it under "Members Only" links on the left side on the Blogs and Links Page.
Here is the current chart:
Full Disclosure: I am 45% exposed.
I'm required to disclose if I currently own a stock I mention and/or may buy/short it within the next 72 hours.
"Technical Analysis is a windsock, not a crystal ball." - Carl Swenlin
(c) Copyright 2022 DecisionPoint.com
Watch the latest episode of DecisionPoint with Carl & Erin Swenlin on Mondays 7:00p EST or on the DecisionPoint playlist on the StockCharts TV YouTube channel here!
NOTE: The stocks reported herein are from mechanical trading model scans that are based upon moving average relationships, momentum and volume. DecisionPoint analysis is then applied to get five selections from the scans. The selections given should prompt readers to do a chart review using their own analysis process. This letter is not a call for a specific action to buy, sell or short any of the stocks provided. There are NO sure things or guaranteed returns on the daily selection of "Diamonds in the Rough."
Regarding BUY/SELL Signals: The signal status reported herein is based upon mechanical trading model signals and crossovers. They define the implied bias of the price index/stock based upon moving average relationships and momentum, but they do not necessarily call for a specific action. They are information flags that should prompt chart review. Further, they do not call for continuous buying or selling during the life of the signal. For example, a BUY signal will probably (but not necessarily) return the best results if action is taken soon after the signal is generated. Additional opportunities for buying may be found as price zigzags higher, but the trader must look for optimum entry points. Conversely, exit points to preserve gains (or minimize losses) may be evident before the model mechanically closes the signal.
Helpful DecisionPoint Links:
DecisionPoint Shared ChartList and DecisionPoint Chart Gallery
Price Momentum Oscillator (PMO)
Swenlin Trading Oscillators (STO-B and STO-V)
For more links, go to DecisionPoint.com