
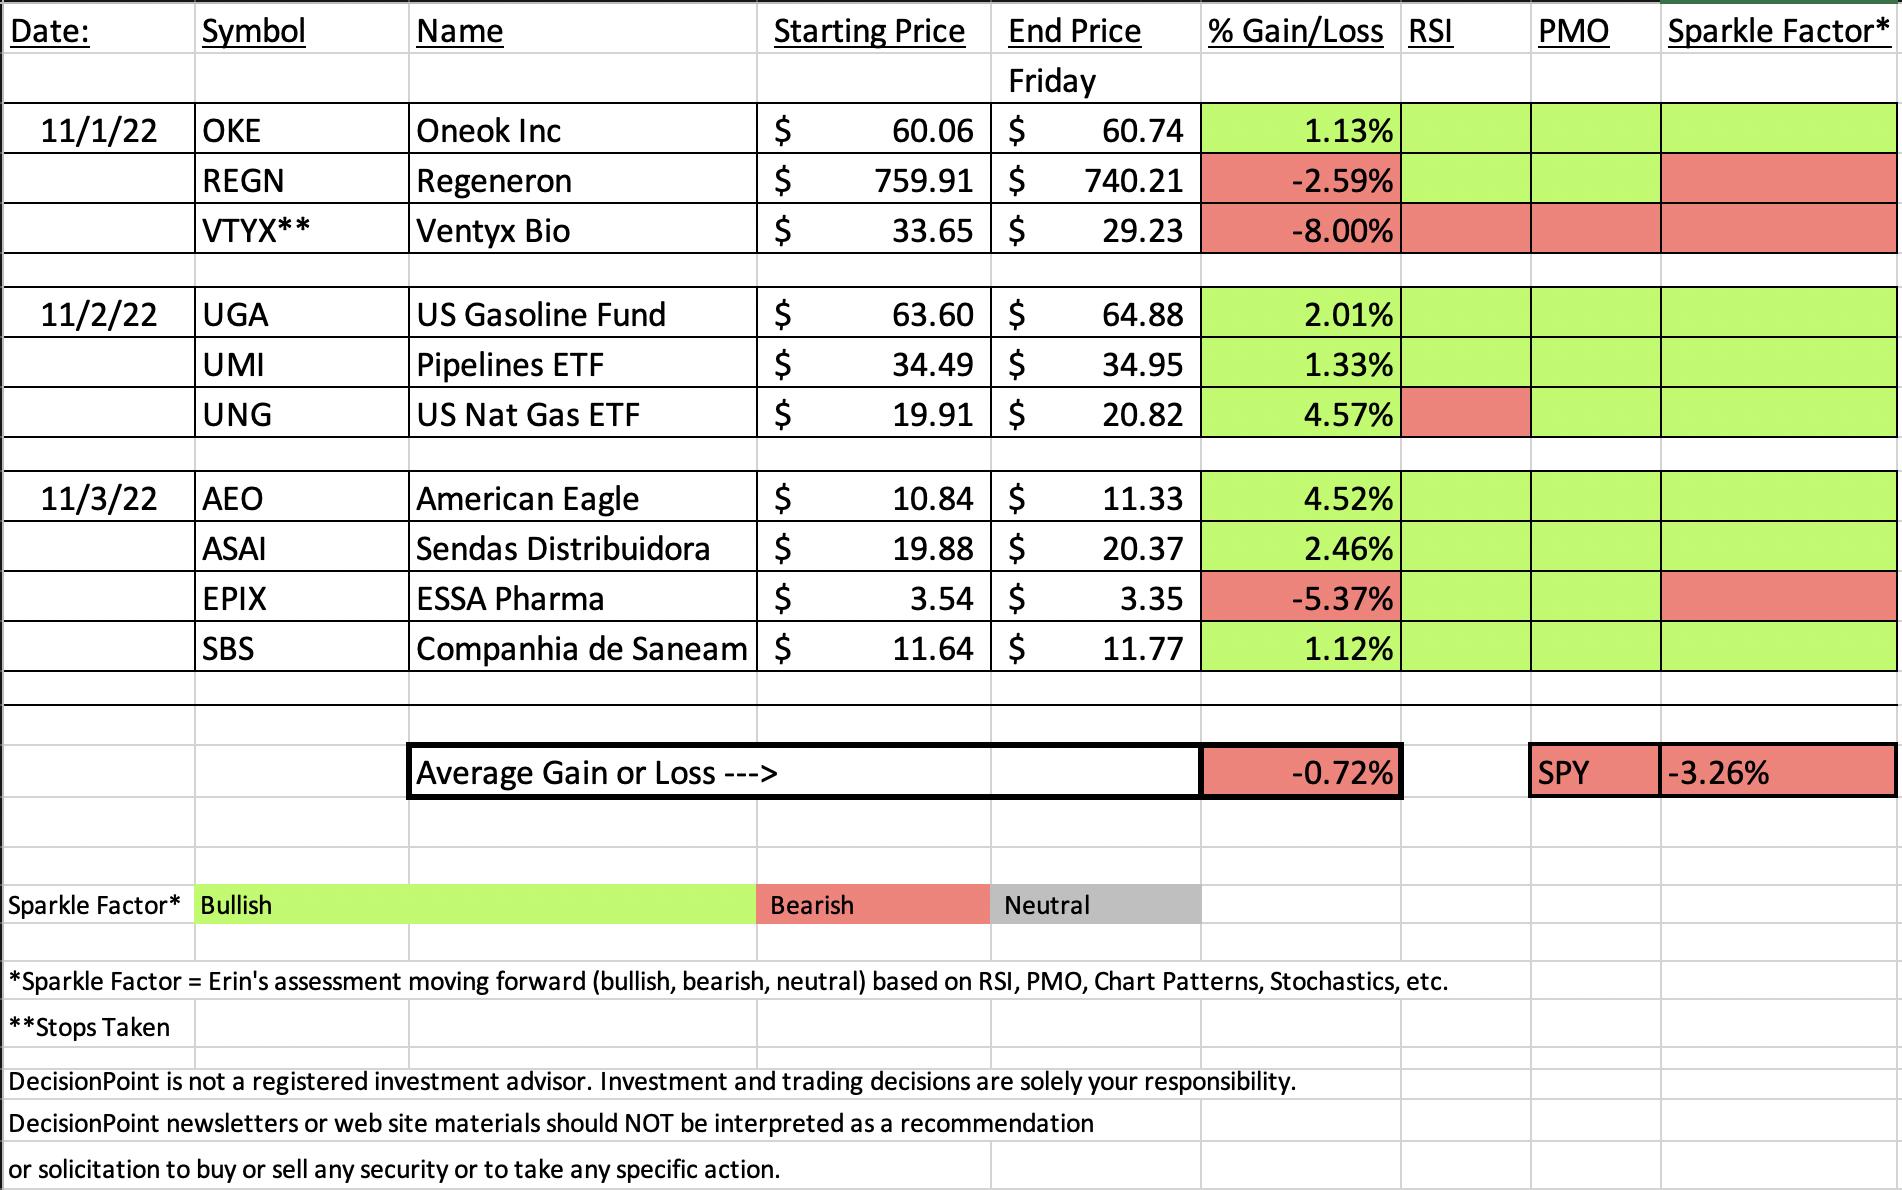
"Diamonds in the Rough" finished slightly lower as a whole, but they did outperform the SPY by over 2.5%. Nothing to brag about if you still finish lower. One of this week's picks dragged us down as it triggered the 8% stop after sinking over 10% on earnings today.
Of the ten selected this week, three of them I am not particularly optimistic about (note "Sparkle Factor" on spreadsheet), but the rest look good going into next week.
The Darling turned out to be UNG even after the terrible day it had on Thursday. This week's Dud is obviously VTYX which had its stop triggered.
The link for today's Diamond Mine recording is below the diamonds logo and will continue to be in the reports.
Have a great weekend!
Good Luck & Good Trading,
Erin

TODAY'S RECORDING LINK (11/4/2022):
Topic: DecisionPoint Diamond Mine (11/4/2022) LIVE Trading Room
Start Time: Nov 4, 2022 09:00 AM
Recording Link HERE
Passcode: November*4
NEXT DIAMOND MINE Trading Room on November 11th 2022:
When: Nov 11, 2022 09:00 AM Pacific Time (US and Canada)
Topic: DecisionPoint Diamond Mine (11/11/2022) LIVE Trading Room
Register in advance for this webinar HERE
Save the registration confirmation email with login instructions in case Zoom doesn't notify you in time.

Our latest DecisionPoint Trading Room recording:
A few items about the spreadsheet: I've put on the spreadsheet whether the RSI is positive (green) or negative (red). The PMO column tells you if it is rising (green) or falling (red). Finally I've added my own "Sparkle Factor" that gives you my assessment going forward, bullish (green), bearish (red) or neutral (gray). The Sparkle Factor is basically my thoughts on whether I expect it to rise or fall. A neutral means it could really go either way so it could be added to a watch list. If you're in a stock I consider "neutral" going forward, the ball is in your court.
Darling:
United States Natural Gas Fund (UNG)
EARNINGS: N/A
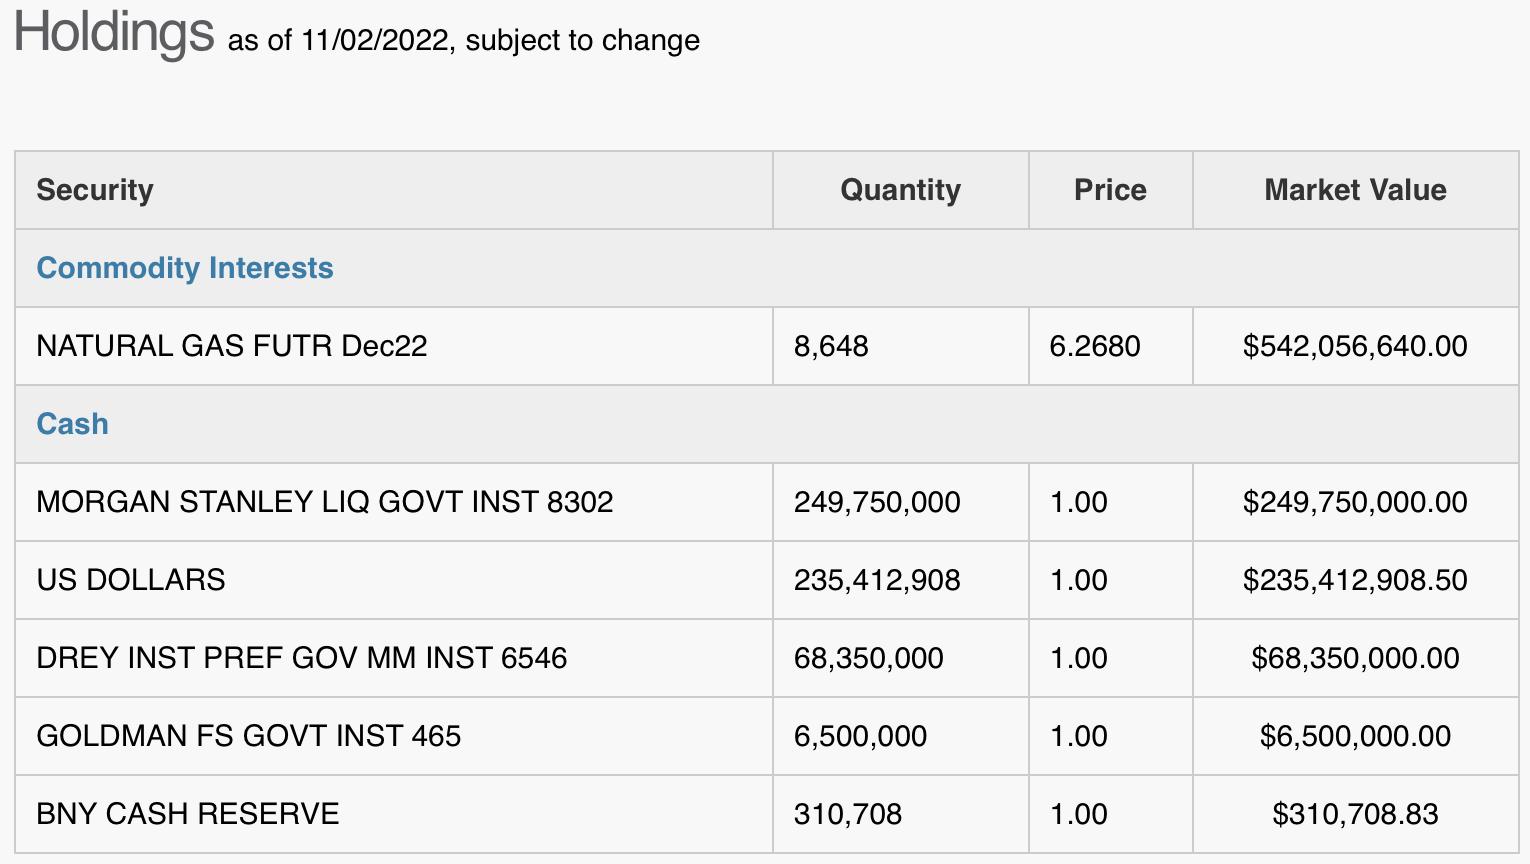
UNG holds near-month futures contracts in natural gas, as well as swap contracts. Click HERE for more information.
Predefined Scans Triggered: Moved Above Ichimoku Cloud and P&F Low Pole.
Below are the commentary and chart from Wednesday:
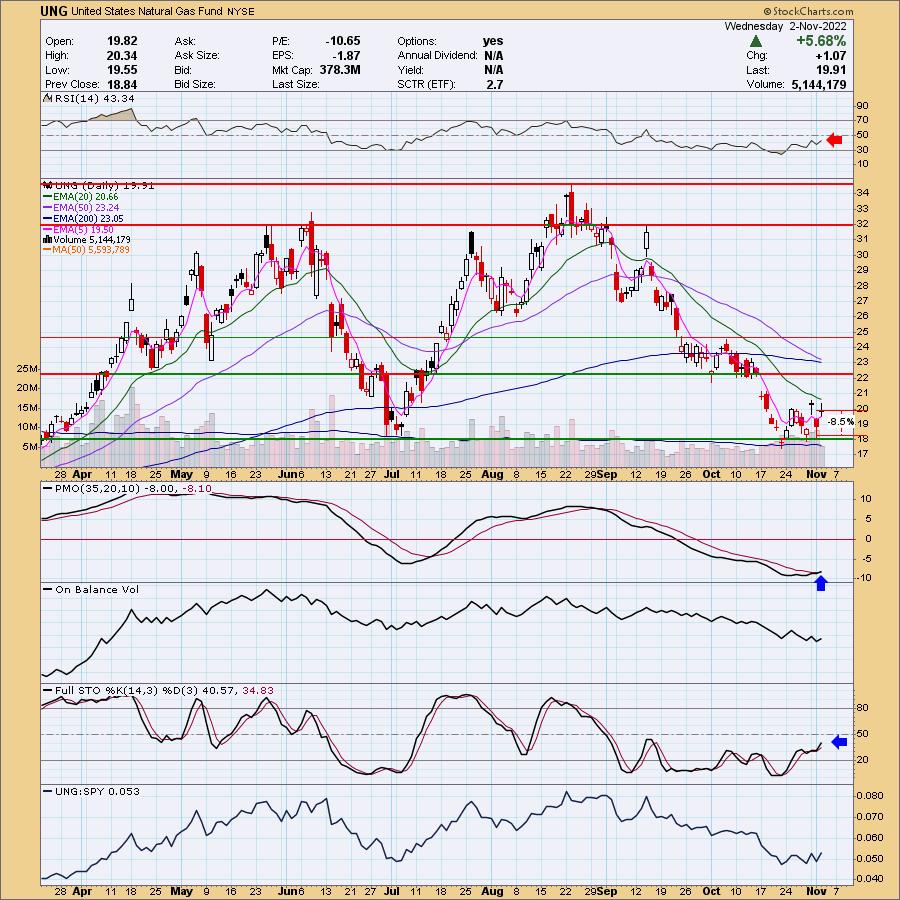
"UNG is up +0.80% in after hours trading. The chart isn't completely ripe, but it sure looks like it is ready to make a move higher finally based on the PMO and the consolidation along support at the June/July low. The PMO just triggered a crossover BUY signal today. The RSI is negative but beginning to rise. Stochastics are rising, but haven't quite moved into positive territory above net neutral (50). It's been performing inline with the SPY, but I believe it has potential to certainly outperform if we see more decline or consolidation by the market as a whole. I've set the stop rather deep and honestly I could see setting it even lower at 9.5%; instead I opted to set it at 8.5% around $18.21."
Here is today's chart:
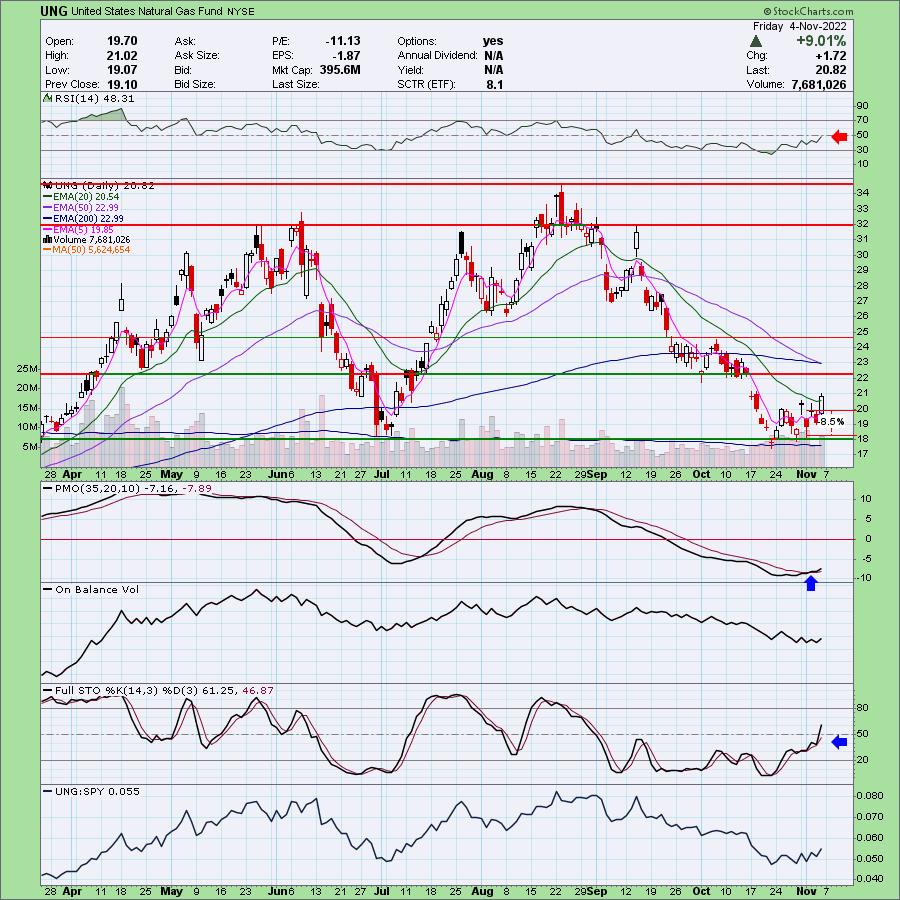
As is usually the case for UNG, we had a volatile past few days. Today's giant 9% gain made up for yesterdays 5%+ decline. The RSI is still negative but that will change on the next rally. The PMO is now accelerating higher and Stochastics have moved into positive territory. I did note on Wednesday that I see this as a short-term trade as the weekly chart is ugly.
Don't forget, on Thursdays I look at reader-requested symbols, so shoot me an email at erin@decisionpoint.com. I read every email I receive and try to answer them all!
Dud:
Ventyx Biosciences Inc. (VTYX)
EARNINGS: 11/3/2022 (AMC) ** REPORTS THIS WEEK **
Ventyx Biosciences, Inc. is a clinical-stage biopharmaceutical company, which focuses on developing novel small molecule therapeutics for the treatment of autoimmune diseases. Its clinical stage pipeline includes VTX958, a Phase 1 allosteric TYK2 inhibitor for the treatment of a broad range of autoimmune diseases, VTX002, a Phase 2-ready S1P1 receptor modulator for the treatment of ulcerative colitis, and VTX2735, a Phase 1-ready peripheral inhibitor of the NLRP3 inflammasome, which is a mediator of multiple inflammatory conditions. The company was founded on November 21, 2018 and is headquartered in Encinitas, CA.
Predefined Scans Triggered: Moved Above Ichimoku Cloud and P&F Low Pole.
Below are the commentary and chart from Tuesday:
"VTYX is down -1.93% in after hours trading. I note that I covered this one on July 6th this year. That turned out to be an excellent call if I do say so myself! Price did fail after gapping up, but it is now holding gap support at August high. The RSI is positive and the PMO is turning back up in oversold territory above the zero line. It's typically a great performer against the group and it is beginning to really outperform the SPY. Stochastics are rising vertically and are now above 80 signifying internal strength. I'd like for it to have broken overhead resistance, but it probably needs a bit of a pullback. Setting the stop was challenging given the strong rally it's already in. I set it at my max comfort level of 8% around $30.95."
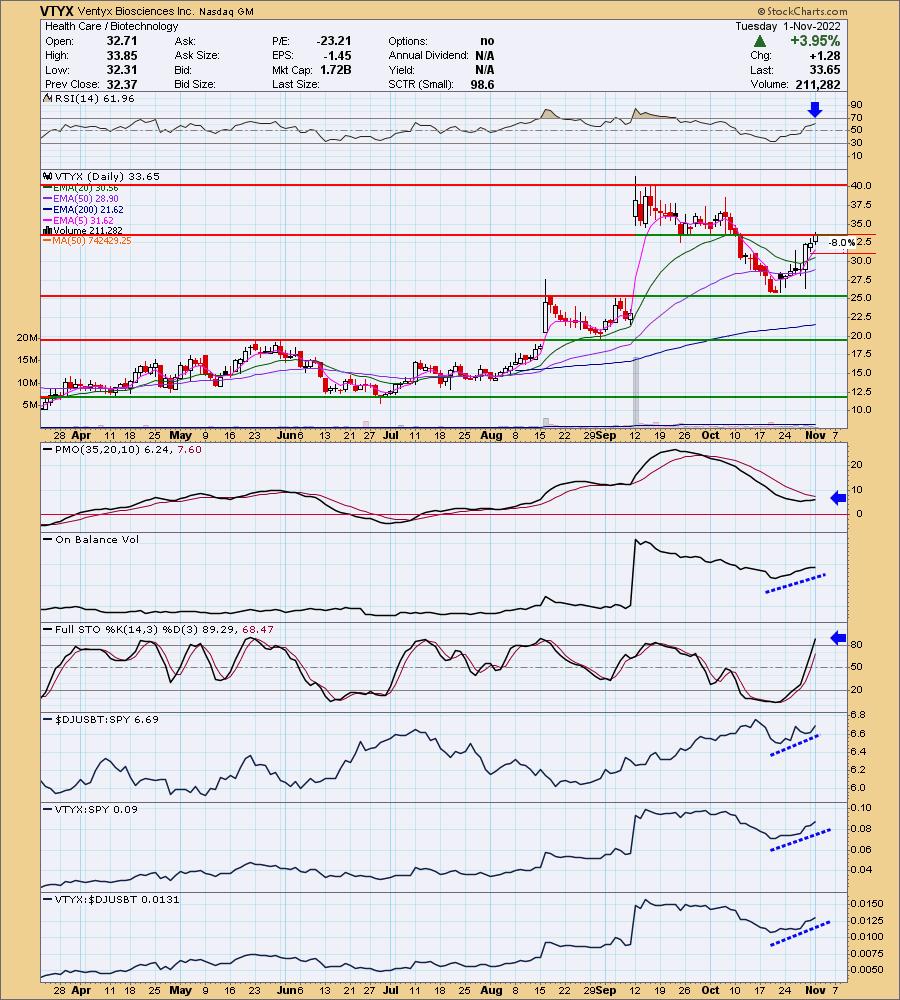
Here is today's chart:
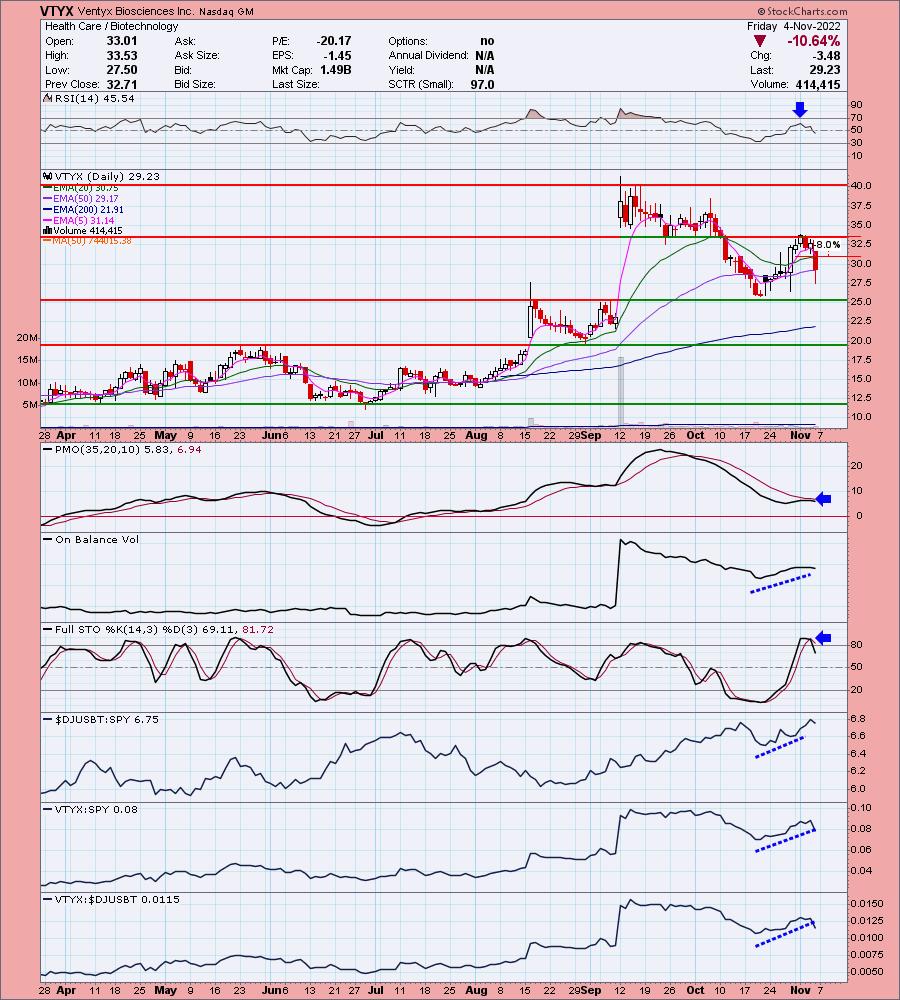
This was a bad call. I did say that earnings were on the way. They harmed the stock a great deal with price turning back down at resistance. The 8% stop was hit intraday. The PMO is topping below it signal line and the RSI moved into negative territory. This one has a lot of work to do to become interesting again.
THIS WEEK's Sector Performance:

DecisionPoint Sector Scoreboard (Mechanical Trend Model Signals):

Click Here to view Carl's annotated Sector ChartList!
RRG® Daily Chart ($ONE Benchmark):
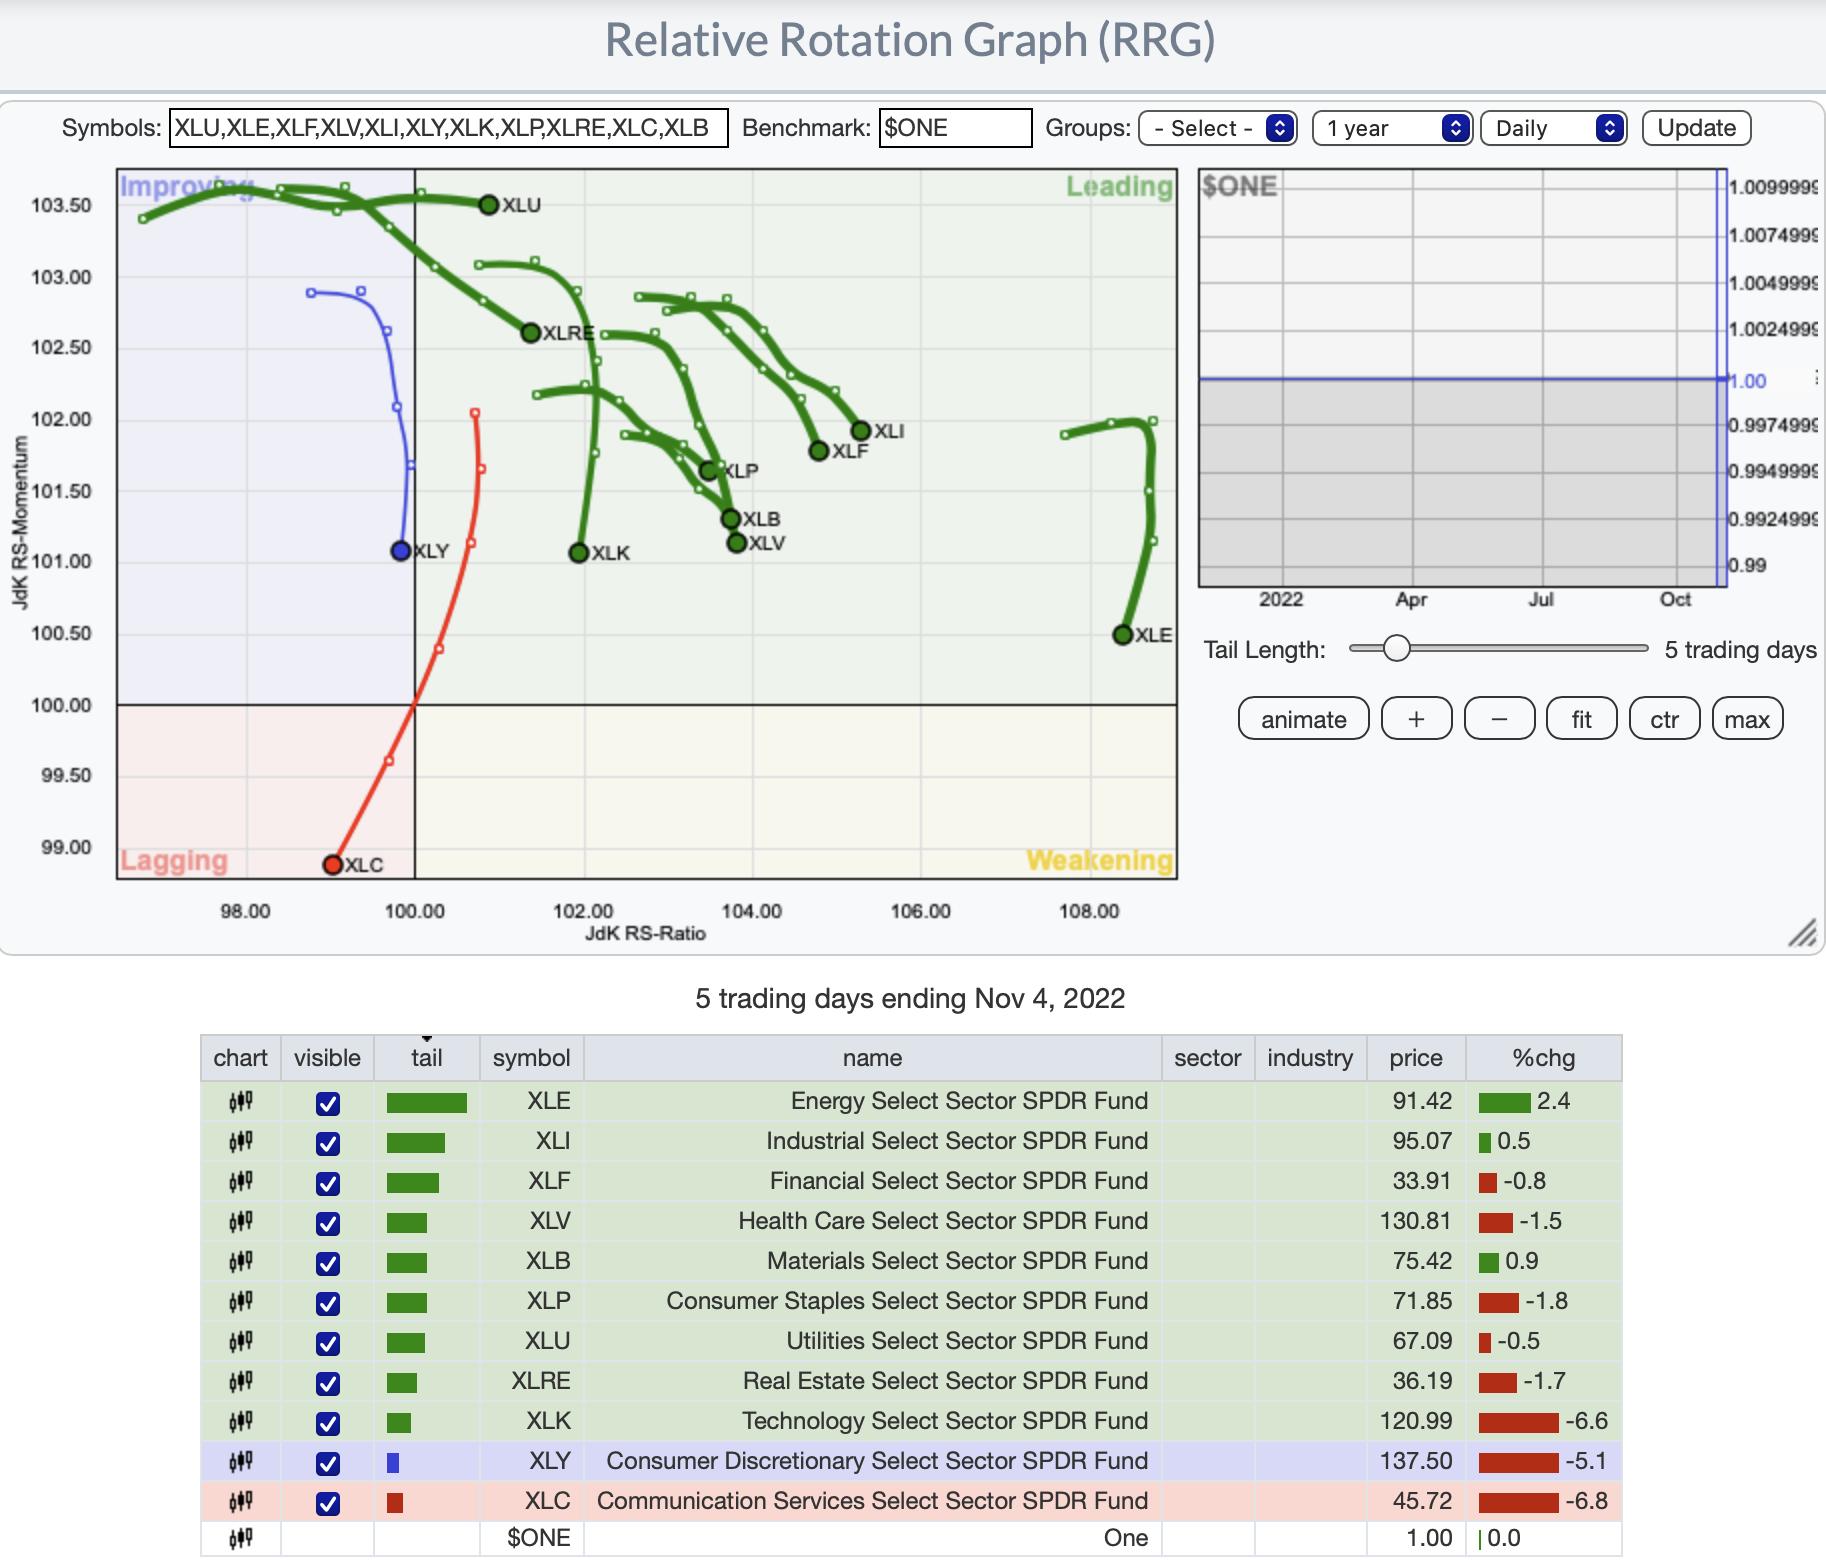
There are two obvious sectors in trouble in the short term. XLY may be in the Improving quadrant, but it is headed quickly to Lagging. XLC was already in Lagging and the picture is getting worse. All others are in the Leading quadrant, but they all have headings that are deteriorating. XLE and XLK actually have bearish headings and could be the first to hit the Weakening quadrant.
RRG® Weekly Chart ($ONE Benchmark):
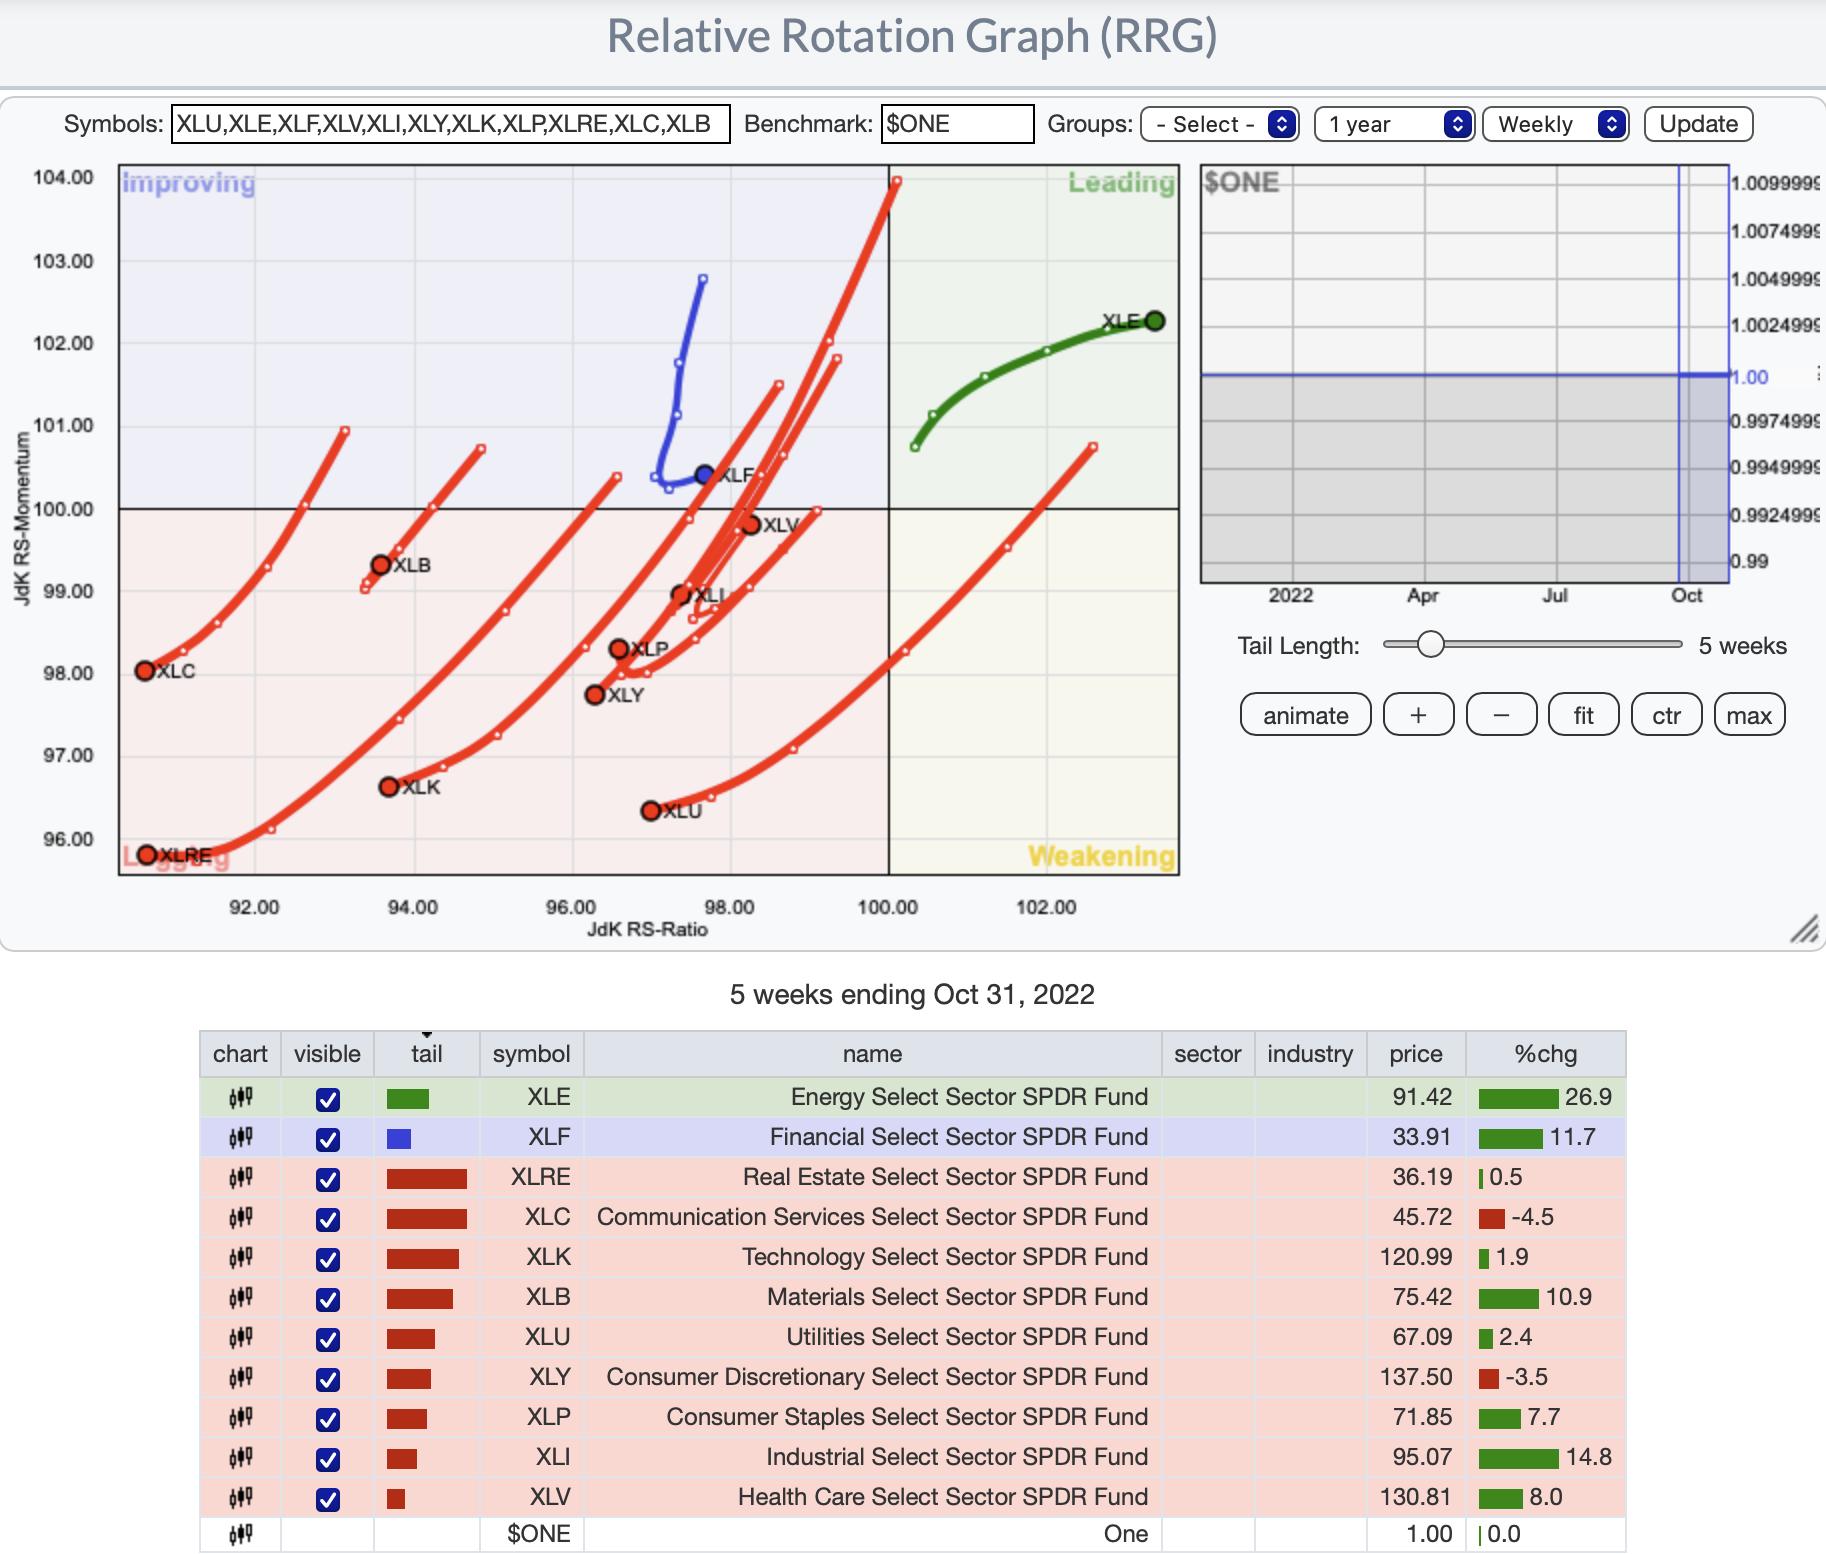
The weekly RRG had some interesting changes. XLE continues to hold leadership. XLF has hooked around into a bullish northeast heading toward the Leading quadrant.
XLI, XLB and XLV have done an about face and now have bullish northeast headings. XLP has turned around, but still has a westward component to its heading. Still this looks good for the sector.
The remaining sectors don't look good in the intermediate term.
RRG® charts show you the relative strength and momentum for a group of stocks. Stocks with strong relative strength and momentum appear in the green Leading quadrant. As relative momentum fades, they typically move into the yellow Weakening quadrant. If relative strength then fades, they move into the red Lagging quadrant. Finally, when momentum starts to pick up again, they shift into the blue Improving quadrant.
CLICK HERE for an animated version of the RRG charts.
Sector to Watch: Materials (XLB)
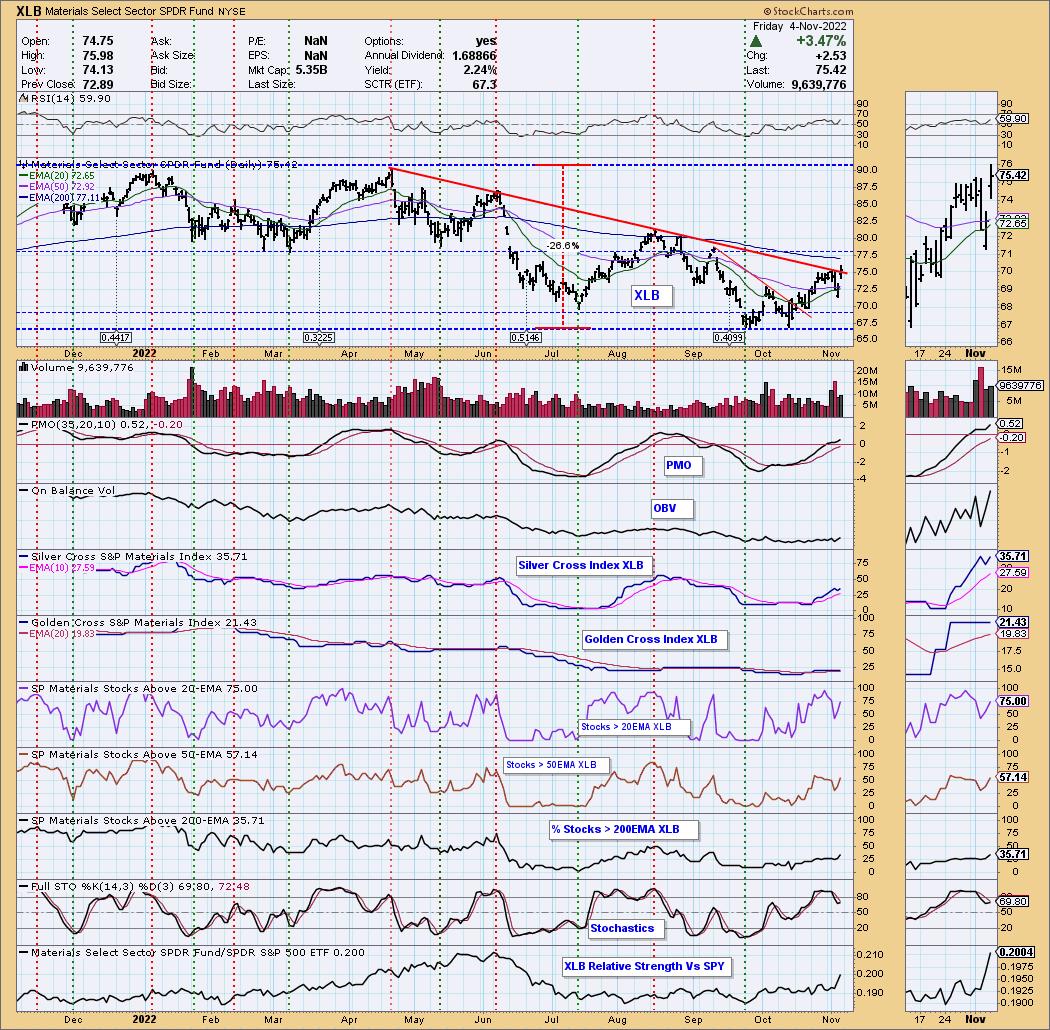
I was down to this sector and Energy (XLE) for my "Sector to Watch" while in the Diamond Mine trading room today. I decided this afternoon to go with Materials. I sifted through the industry groups within and found lots of relative and internal strength. I like today's break from an intermediate-term declining trend. The PMO has bottomed above its signal line and the RSI is positive. I was on the fence about it and many other sectors based on Stochastics. XLB now has rising Stochastics and relative strength is increasing.
Industry Group to Watch: Commodity Chemicals ($DJUSCC)
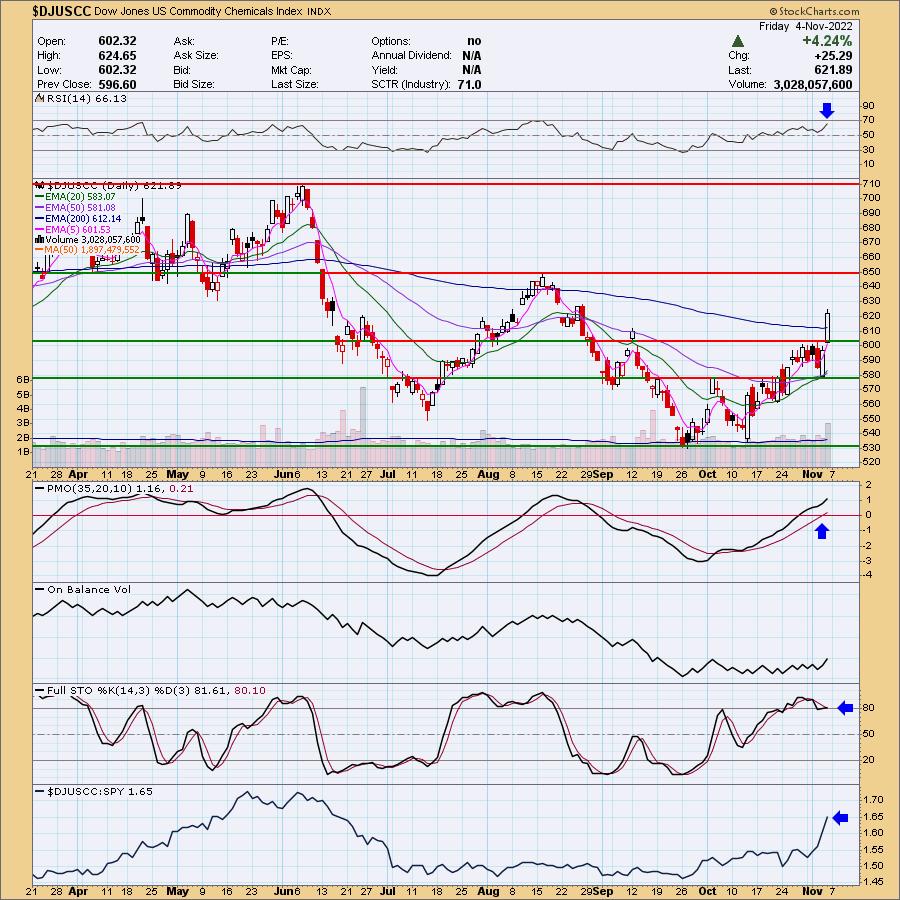
This group had a spectacular day. We got a strong breakout above the 200-day EMA, an acceleration on the PMO and Stochastics turning back above 80. Relative strength is incredible here. I nosed around the group and found that most of the big names were up well over 10% today. They may require a pullback: FCX, SCCO and TECK.
Go to our Sector ChartList on DecisionPoint.com to get an in-depth view of all the sectors. On StockCharts.com you can find the Industry Summary.
Have a great weekend! Good Luck & Good Trading!
- Erin
erin@decisionpoint.com
Full Disclosure: I'm 50% exposed.
Watch the latest episode of DecisionPoint with Carl & Erin Swenlin on Mondays 7:00p EST or on the DecisionPoint playlist on the StockCharts TV YouTube channel here!
Technical Analysis is a windsock, not a crystal ball. --Carl Swenlin
NOTE: The stocks reported herein are from mechanical trading model scans that are based upon moving average relationships, momentum and volume. DecisionPoint analysis is then applied to get five selections from the scans. The selections given should prompt readers to do a chart review using their own analysis process. This letter is not a call for a specific action to buy, sell or short any of the stocks provided. There are NO sure things or guaranteed returns on the daily selection of "diamonds in the rough."
Helpful DecisionPoint Links:
DecisionPoint Shared ChartList and DecisionPoint Chart Gallery
Price Momentum Oscillator (PMO)
Swenlin Trading Oscillators (STO-B and STO-V)
(c) Copyright 2022 DecisionPoint.com