
Thank you to those who forwarded me requests for this week. There were two major themes that everyone seemed interested in, both industries are from the Technology sector. I like what is going on in these two industry groups so it was quite easy to pick today's requests. Nearly every request had merit so I've included the list of requests for you.
Semiconductors were the first big theme. I decided to cover the ETF (SMH) that was requested and then a "winner that keeps on winning" from that space. The other theme was Renewable Energy. I talked about this group and the ETF (TAN) was presented to you on October 26th. I own it currently. FSLR is one of today's "Diamonds in the Rough", but SPWR and MAXN were both requested. I like all three on a pullback.
It was a huge day for both of these groups so there is downside risk going into tomorrow should these stocks/ETF pause or digest their rallies. It will at least offer you a better opportunity to get in at a lower price than today's closing prices. It just won't make the spreadsheet pretty tomorrow if they pull back.
Finally, I picked a request from Telecom Equipment which is also a Technology sector industry group.
I was asked about selling "Diamonds in the Rough" if you get into them. You can certainly try to wait for the upside targets to be hit, but really, if the PMO has a downside crossover or tops in overbought territory, you'd be wise to sell. Or, bring it to the Diamond Mine and I'll give you my current thoughts.
Speaking of the Diamond Mine, don't forget to sign up for tomorrow's Diamond Mine trading room! I expect it to be a very interesting trading day. We can also look at some of the requests that I didn't cover today. You'll find the registration and recording links below the diamonds logo.
Good Luck & Good Trading!
Erin
Today's "Diamonds in the Rough": MAXN, PI, RMBS and SMH.
Runner-ups: EOG, SPWR, EXTR, AEHR, ADT, FLSR, NOG and ON.

TODAY'S RECORDING LINK (11/4/2022):
Topic: DecisionPoint Diamond Mine (11/4/2022) LIVE Trading Room
Start Time: Nov 4, 2022 09:00 AM
Recording Link HERE
Passcode: November*4
NEXT DIAMOND MINE Trading Room on November 11th 2022:
When: Nov 11, 2022 09:00 AM Pacific Time (US and Canada)
Topic: DecisionPoint Diamond Mine (11/11/2022) LIVE Trading Room
Register in advance for this webinar HERE
After registering, you will receive a confirmation email containing information about joining the webinar.

Here is the last recording:
Welcome to DecisionPoint Diamonds, wherein I highlight ten "Diamonds in the Rough" per week. These are selected from the results of my DecisionPoint Scans which search for stocks that could benefit from the trend and condition of the market. Remember, these are not recommendations to buy or sell, but are the most interesting of the stocks that surfaced in my scans. My objective is to save you the work of the initial, tedious culling process, but you need to apply your own analysis to see if these stocks pique your interest as well. There are no guaranteed winners here!
"Predefined Scans Triggered" are taken from StockCharts.com using the "Symbol Summary" option instead of a "SharpChart" on the workbench.
First Solar Inc. (FSLR)
EARNINGS: 03/01/2023 (AMC)
First Solar, Inc. engages in designing, manufacturing, marketing, and the distribution of photovoltaic solar power systems and solar modules. It operates through the Modules and Systems segments. The Modules segment involves the design, manufacture, and sale of cadmium telluride solar modules, which convert sunlight into electricity. The Systems segment offers development, construction, operation, and maintenance of photovoltaic solar power systems. The company was founded by Michael J. Ahearn in 1999 and is headquartered in Tempe, AZ.
Predefined Scans Triggered: Elder Bar Turned Green and New CCI Buy Signals.
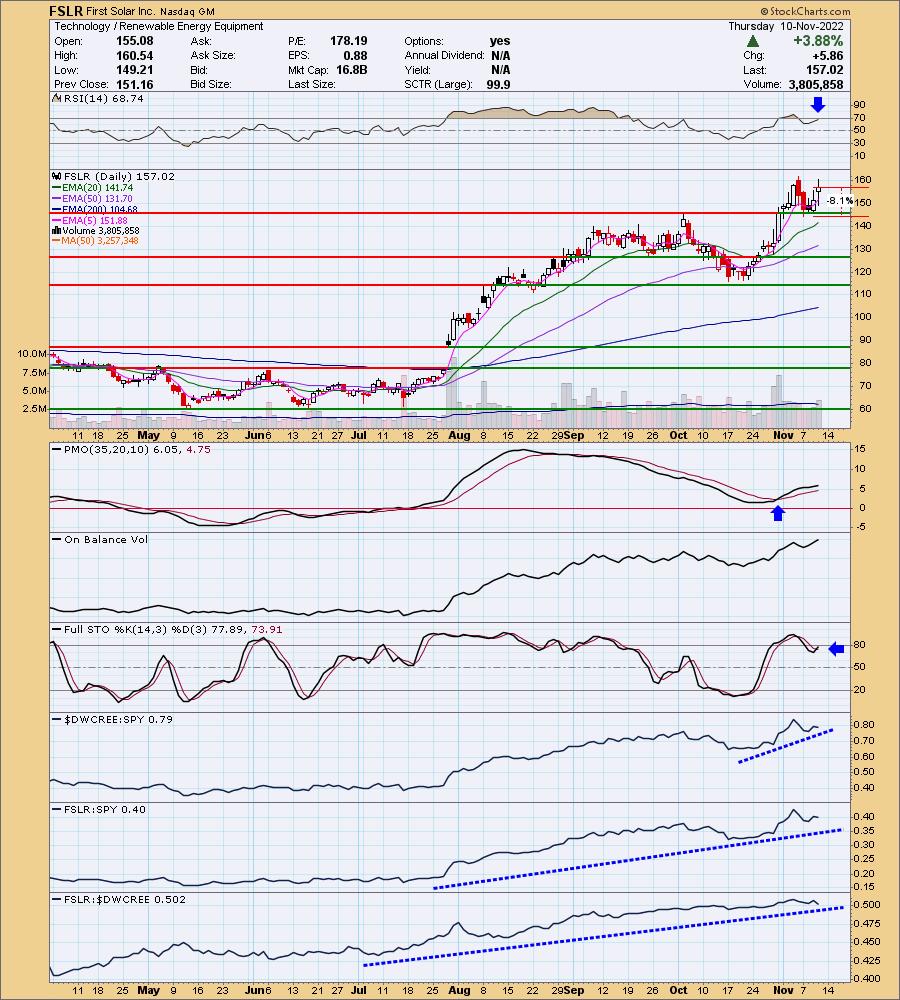
FSLR is down -0.59% in after hours trading. I like the breakout and then textbook pullback toward the breakout point. That pullback also is a flag on a flagpole which means the bull flag has been confirmed with today's breakout. As noted in the opening, I would not be surprised if we see a pause or another pullback if the group itself dials it back. The RSI is positive and the PMO is on a BUY signal and not overbought. Stochastics have turned back up and are already nearing territory above 80. Relative strength has been picking up for the group since October and FSLR tends to outperform or travel inline with the group. I've set the stop at 8.1% around $144.30.
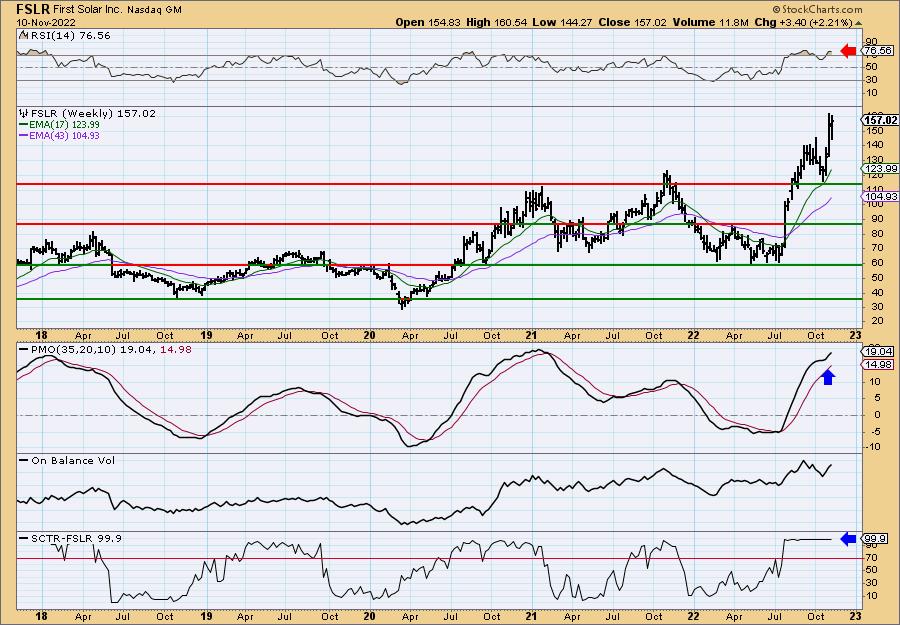
The weekly chart is favorable but very overbought. We'll have to chalk this one up to "winners who keep on winning" and ride what is left of the wave higher. The weekly RSI and weekly PMO are clearly overbought, but both are still rising. The SCTR is as high a reading as you can get at 99.9%. That's some serious internal strength.
Impinj, Inc. (PI)
EARNINGS: 02/08/2023 (AMC)
IImpinj, Inc. engages in the development and sale of RAIN, a radio frequency identification solution. Its platform allows inventory management, patient safety, asset tracking and item authentication for the retail, healthcare, supply chain and logistics, hospitality, food and beverage, and industrial manufacturing industries. The company was founded by Carver A. Mead and Christopher Diorio in April 2000 and is headquartered in Seattle, WA.
Predefined Scans Triggered: Elder Bar Turned Green.
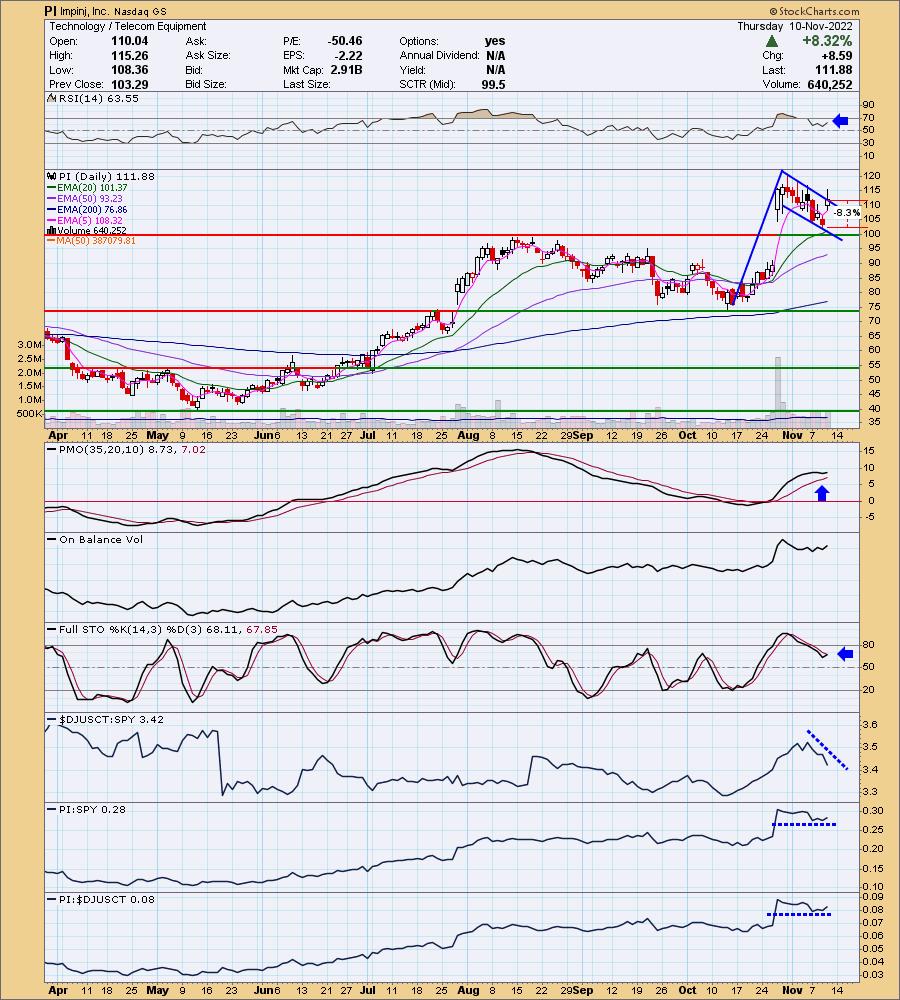
PI is up +2.78% in after hours trading. It had a big gap up at the end of October and then digested the move. It is much like a flag on a flagpole so this breakout would be a confirmation of the bull flag. The decline also helped keep the RSI out of overbought territory. The PMO has now made a bottom above the signal line which is especially bullish. It isn't a perfect chart as the relative strength studies aren't particularly bullish. Stochastics did turn up in positive territory. I've set the stop below today's gap and below the short-term bottom around 8.3% or $102.59.
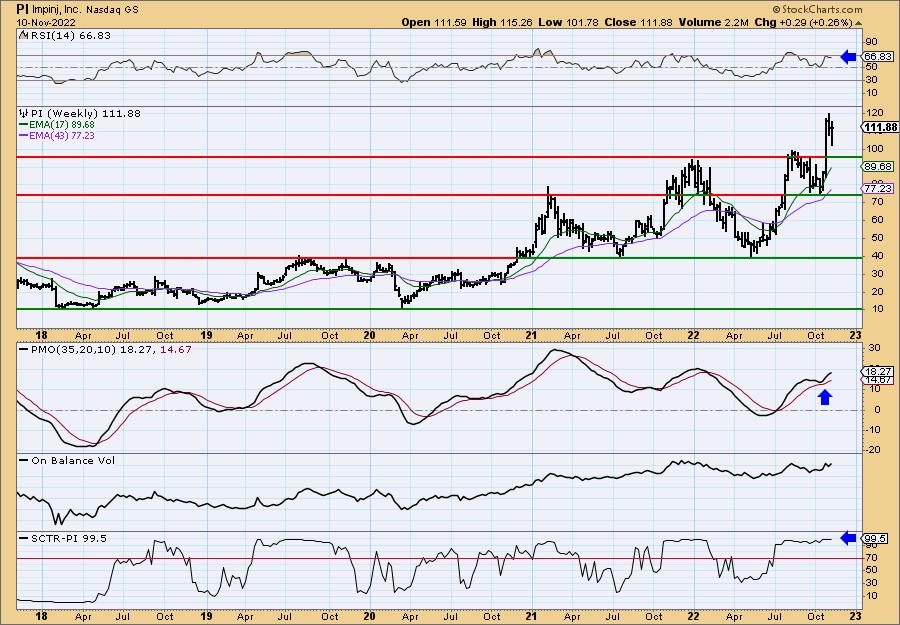
The weekly chart shows the weekly PMO bottoming above its signal line too. It isn't overbought either. The weekly RSI is positive and not overbought. The flag is still building on the weekly chart so more consolidation here would mature the pattern. The SCTR is about as high as you can get at 99.5%.
Rambus, Inc. (RMBS)
EARNINGS: 02/06/2023 (AMC)
Rambus, Inc. engages in the provision of cutting-edge semiconductor and Internet Protocol products, spanning memory and interfaces to security, smart sensors and lighting. Its products include Memory Interface Chips, Interface IP, and Security IP. The company was founded by P. Michael Farmwald and Mark A. Horowitz in March 1990 and is headquartered in Sunnyvale, CA.
Predefined Scans Triggered: New 52-week Highs, Moved Above Upper Price Channel, P&F Double Top Breakout and P&F Triple Top Breakout.
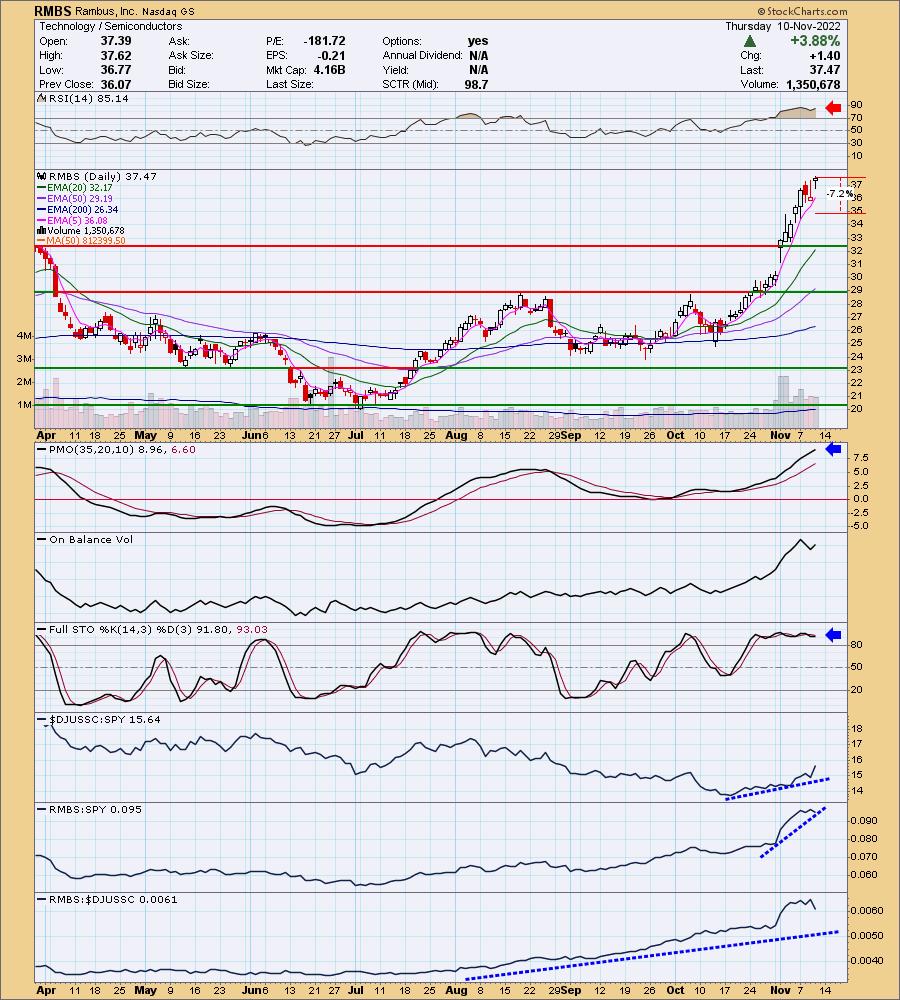
RMBS is unchanged in after hours trading. This one is very overbought based on both the RSI and PMO, but I'll chalk this one up to the "winners keep on winning" category. We've missed a lot of the rally, but it looks like there is more to come. This is probably a "hold" more than a "buy". Stochastics have settled in above 80 suggesting there is still more internal strength, the move just may be getting a bit too mature. Relative strength is pretty good although it does appear to be fading somewhat in the near term. The stop is set at 7.2% around $34.77.
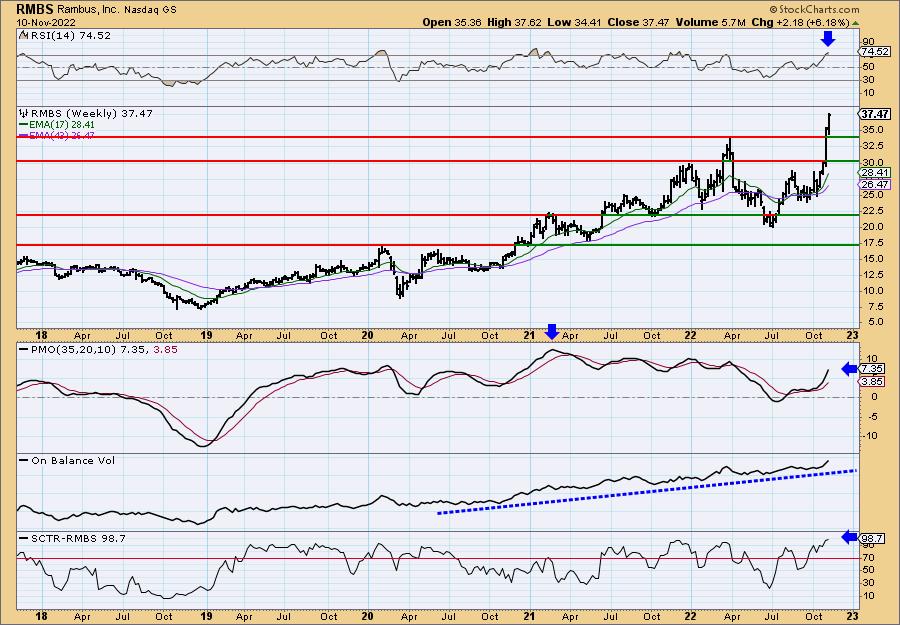
Last week's breakout was impressive, as is the follow-through this week. This has unfortunately moved the weekly RSI into overbought territory. However, the weekly PMO is rising strongly and isn't overbought yet. The OBV shows steady gains with the current reading being the highest. That is exactly what you want on a breakout. The SCTR is outstanding at 98.7%.
VanEck Vectors Semiconductor ETF (SMH)
EARNINGS: N/A
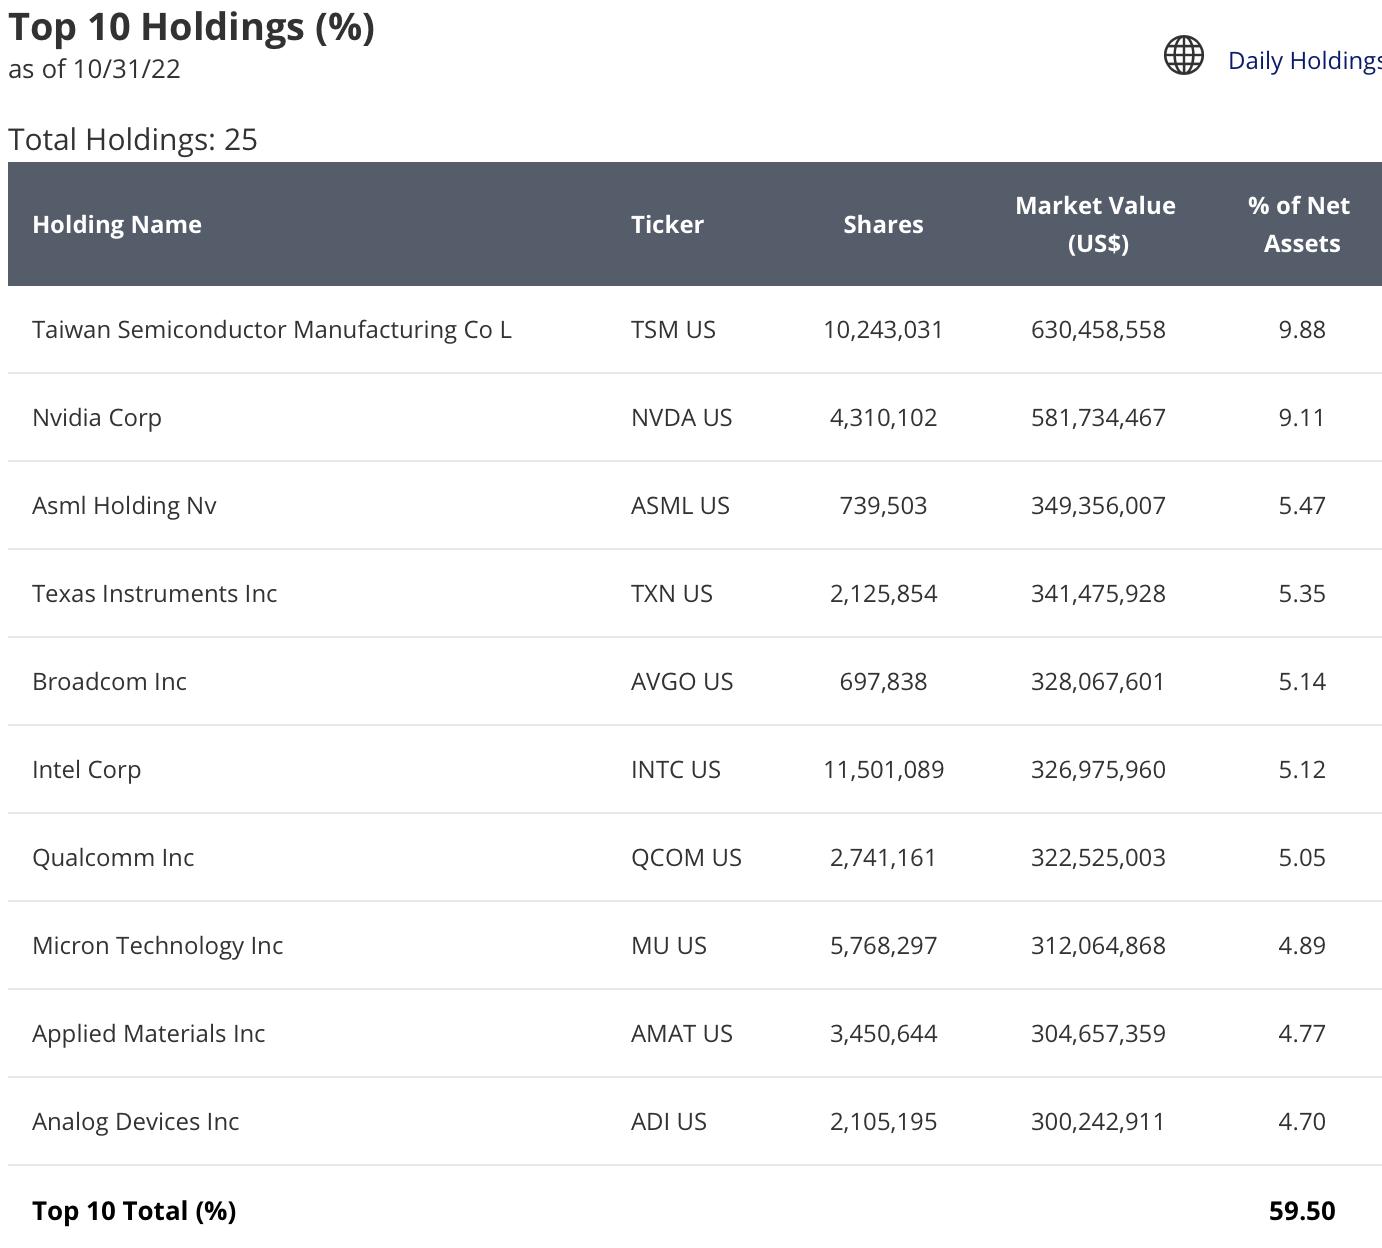
SMH tracks a market-cap-weighted index of 25 of the largest US-listed semiconductors companies. Click HERE for more information.
Predefined Scans Triggered: Elder Bar Turned Green, Gap Ups, Moved Above Upper Keltner Channel, Moved Above Upper Bollinger Band, Stocks in a New Uptrend (Aroon), Moved Above Upper Price Channel, Runaway Gap Ups, Entered Ichimoku Cloud and P&F Double Top Breakout.
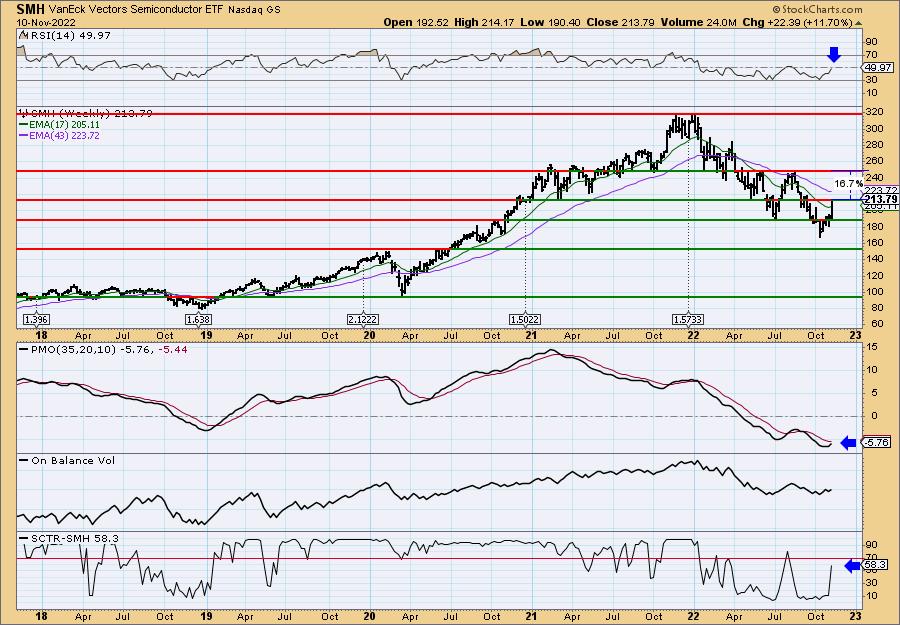
SMH is up +0.20% in after hours trading. I have to say it triggered numerous amount of predefined scans on the bullish side. It was a sizable move today so a pullback toward the breakout point is in order, but based on after hours trading, I suppose it could move even higher. The PMO is almost above the zero line. The RSI is rising and not overbought. Stochastics turned up above 80. The group is very strong against the SPY right now. I've listed the top 10 holdings as I do with all ETFs. If you have a higher risk appetite, you could consider purchasing one of their holdings. The stop is set below gap resistance at 7.6% around $197.54.
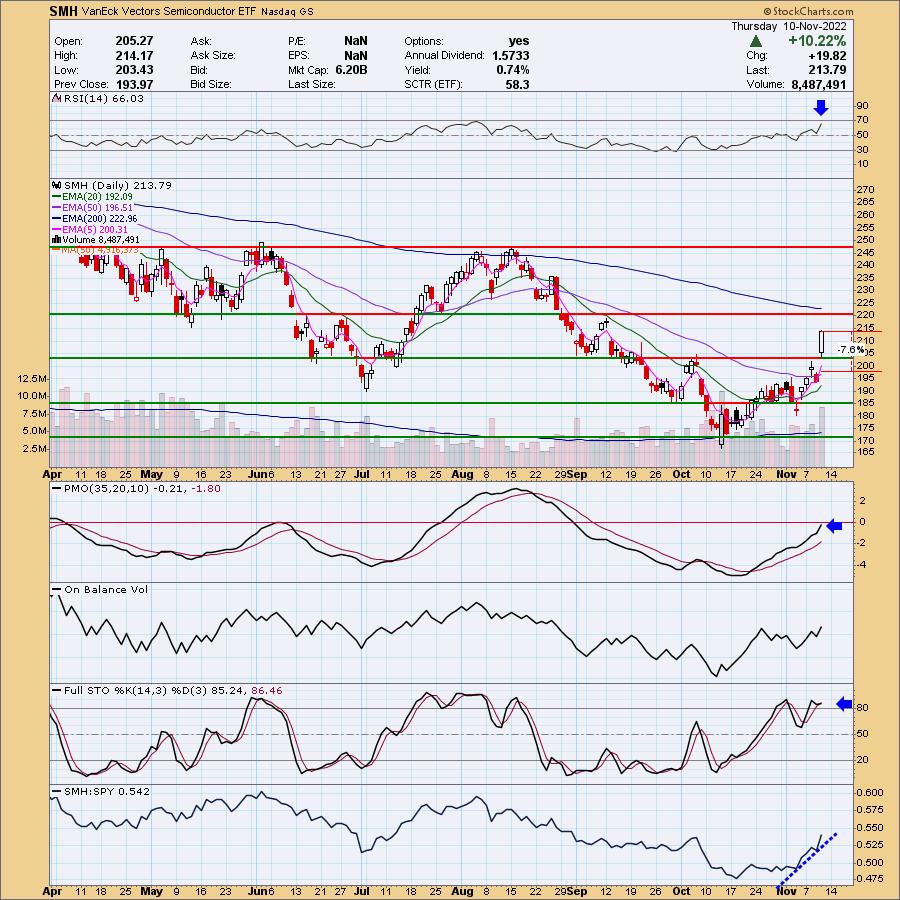
Price is up against overhead resistance currently on the weekly chart. I've marked upside potential to the next resistance area, but it certainly has more potential if this bear market rally really takes hold. The weekly PMO has turned back up and the SCTR is beginning to improve. The weekly RSI isn't positive yet, but it is only .03 away.
Don't forget, on Thursdays I look at reader-requested symbols, click HERE to send me an email. I read every email I receive and try to answer them all!
Current Market Outlook:
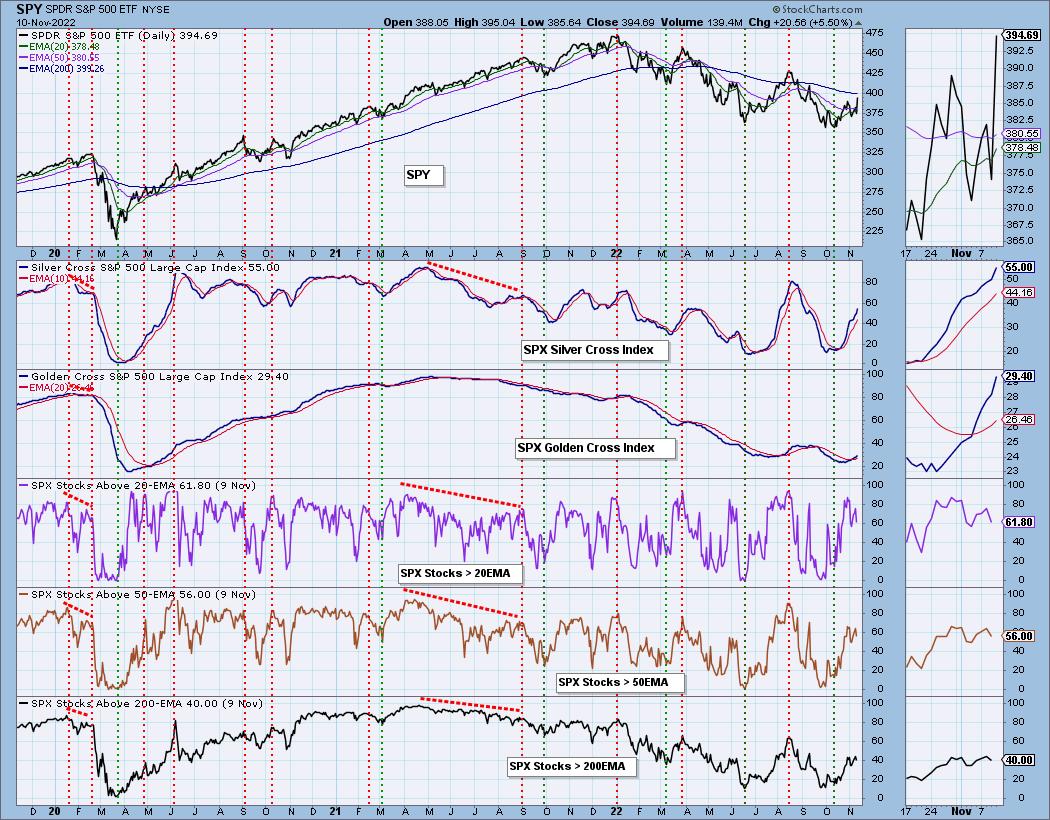
Market Environment: It is important to consider the odds for success by assessing the market tides. The following chart uses different methodologies for objectively showing the depth and trend of participation for intermediate- and long-term time frames.
- The Silver Cross Index (SCI) shows the percentage of SPX stocks on IT Trend Model BUY signals (20-EMA > 50-EMA)
- The Golden Cross Index (GCI) shows the percentage of SPX stocks on LT Trend Model BUY signals (50-EMA > 200-EMA)
Don't forget that as a "Diamonds" member, you have access to our GCI/SCI curated ChartList on DecisionPoint.com. You'll find it under "Members Only" links on the left side on the Blogs and Links Page.
Here is the current chart:
Full Disclosure: I am 50% exposed.
I'm required to disclose if I currently own a stock I mention and/or may buy/short it within the next 72 hours.
"Technical Analysis is a windsock, not a crystal ball." - Carl Swenlin
(c) Copyright 2022 DecisionPoint.com
Watch the latest episode of DecisionPoint with Carl & Erin Swenlin on Mondays 7:00p EST or on the DecisionPoint playlist on the StockCharts TV YouTube channel here!
NOTE: The stocks reported herein are from mechanical trading model scans that are based upon moving average relationships, momentum and volume. DecisionPoint analysis is then applied to get five selections from the scans. The selections given should prompt readers to do a chart review using their own analysis process. This letter is not a call for a specific action to buy, sell or short any of the stocks provided. There are NO sure things or guaranteed returns on the daily selection of "Diamonds in the Rough."
Regarding BUY/SELL Signals: The signal status reported herein is based upon mechanical trading model signals and crossovers. They define the implied bias of the price index/stock based upon moving average relationships and momentum, but they do not necessarily call for a specific action. They are information flags that should prompt chart review. Further, they do not call for continuous buying or selling during the life of the signal. For example, a BUY signal will probably (but not necessarily) return the best results if action is taken soon after the signal is generated. Additional opportunities for buying may be found as price zigzags higher, but the trader must look for optimum entry points. Conversely, exit points to preserve gains (or minimize losses) may be evident before the model mechanically closes the signal.
Helpful DecisionPoint Links:
DecisionPoint Shared ChartList and DecisionPoint Chart Gallery
Price Momentum Oscillator (PMO)
Swenlin Trading Oscillators (STO-B and STO-V)
For more links, go to DecisionPoint.com