
The market is beginning to turn over and that hurt our "Diamonds in the Rough" this week. I'm still pleased with the performance of many of them, but overall it was a dud kind of week.
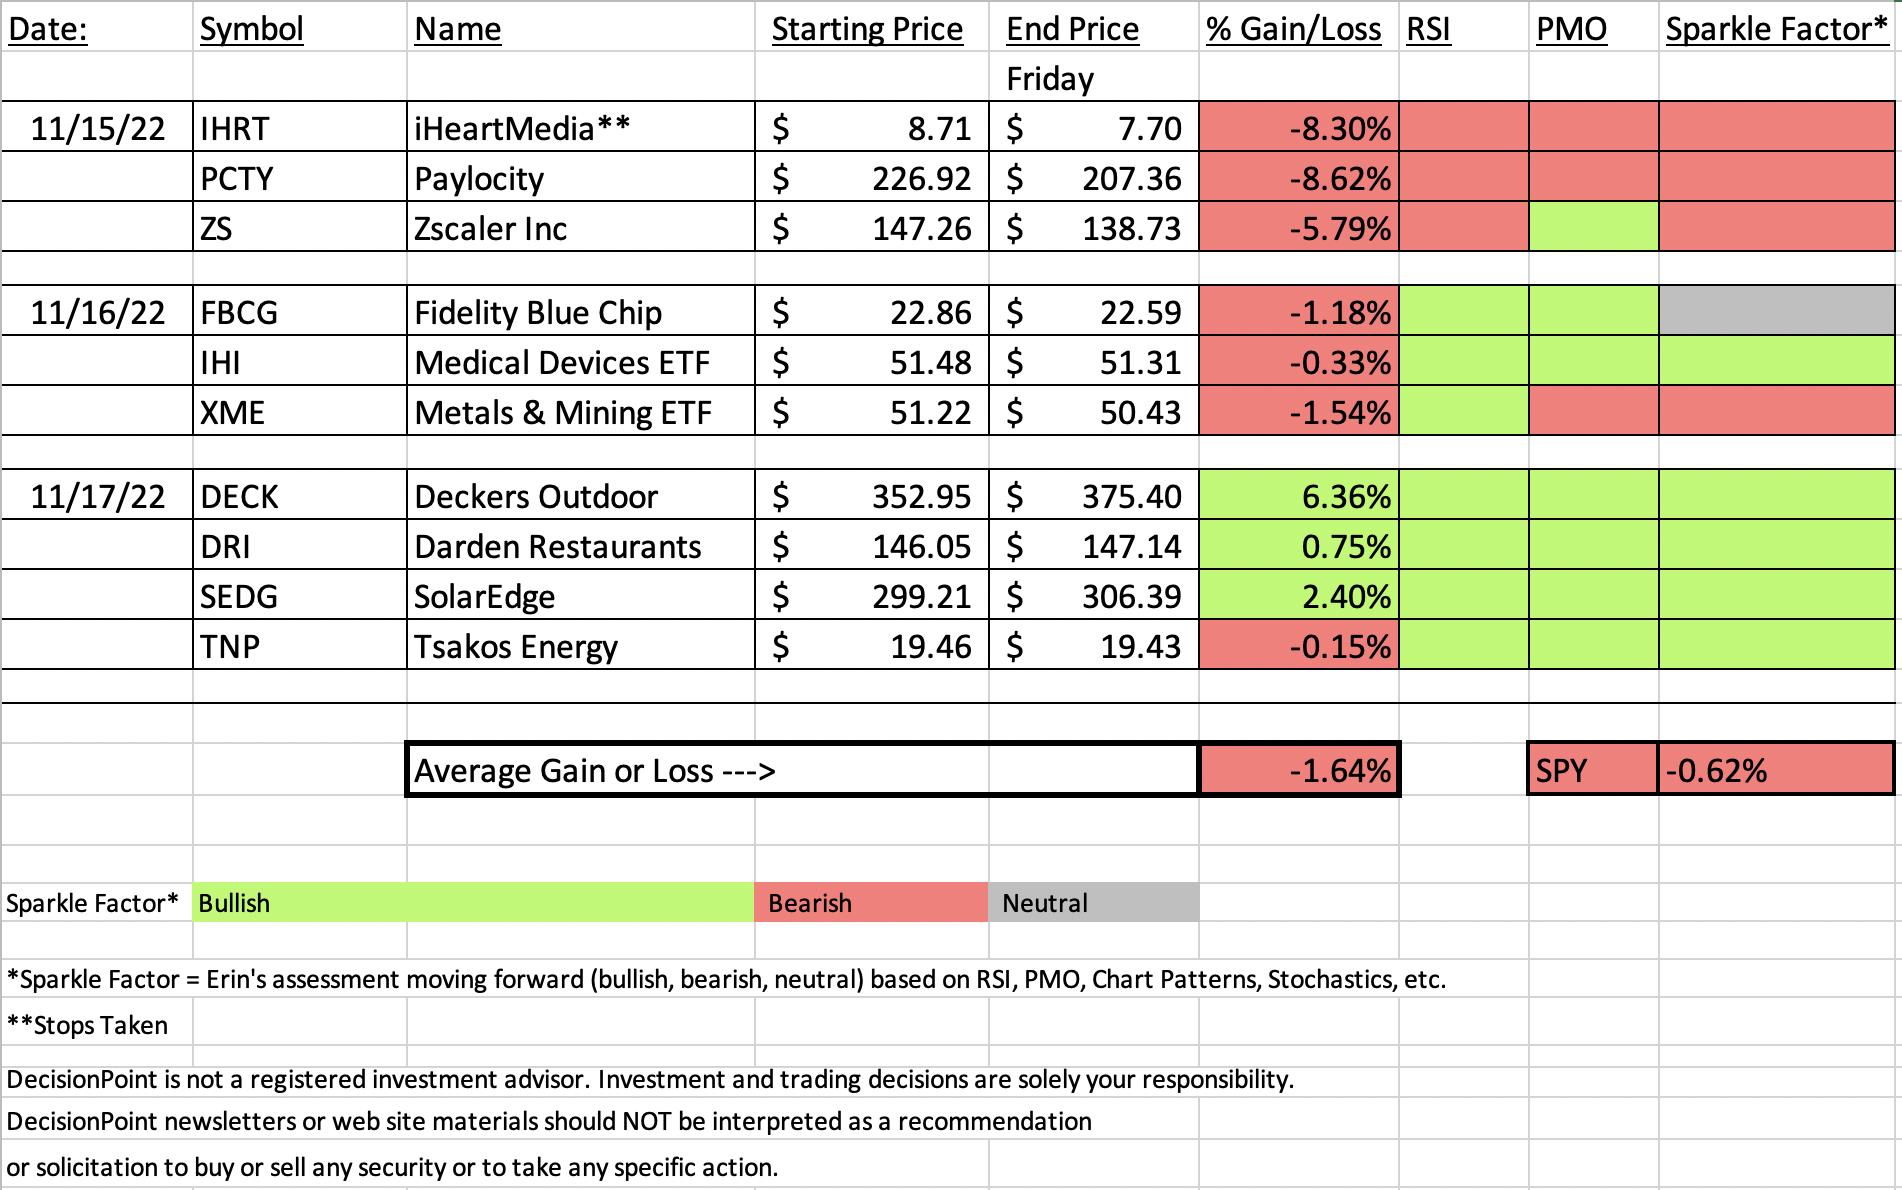
Regarding today's spreadsheet: iHeart (IHRT) and Paylocity (PCTY) killed us this week. IHRT hit its stop the very first day and PCTY, while it didn't hit its stop, turned out to be a big loser as well. I've listed FCBG as having a "neutral" Sparkle Factor as I'm nervous about the market right now and that one should travel at the same pace. Basically, you can decide what to do with it.
I've consequently pared back my holdings. I got rid of my Energy related position, a miner (actually dropped it a few days ago) and both of my tech positions on nice gains. Kept my solar ETF. My exposure is now 35%.
I'm in Las Vegas, so I'm just going to get to it so I make my dinner reservation! I'm skipping the RRGs this week.
The link for today's Diamond Mine recording is below the diamonds logo and will continue to be in the reports.
Have a great weekend!
Good Luck & Good Trading,
Erin

TODAY'S RECORDING LINK (11/18/2022):
Topic: DecisionPoint Diamond Mine (11/18/2022) LIVE Trading Room
Start Time: Nov 18, 2022 09:00 AM
Passcode: Nov#18th
NEXT DIAMOND MINE Trading Room on November 25th 2022:
When: Nov 25, 2022 09:00 AM Pacific Time (US and Canada)
Topic: DecisionPoint Diamond Mine (11/25/2022) LIVE Trading Room
Register in advance for this webinar HERE
Save the registration confirmation email with login instructions in case Zoom doesn't notify you in time.

Our latest DecisionPoint Trading Room recording:
A few items about the spreadsheet: I've put on the spreadsheet whether the RSI is positive (green) or negative (red). The PMO column tells you if it is rising (green) or falling (red). Finally I've added my own "Sparkle Factor" that gives you my assessment going forward, bullish (green), bearish (red) or neutral (gray). The Sparkle Factor is basically my thoughts on whether I expect it to rise or fall. A neutral means it could really go either way so it could be added to a watch list. If you're in a stock I consider "neutral" going forward, the ball is in your court.
Darling:
Deckers Outdoor Corp. (DECK)
EARNINGS: 02/02/2023 (AMC)
Deckers Outdoor Corp. engages in the business of designing, marketing, and distributing footwear, apparel, and accessories developed for both everyday casual lifestyle use and high performance activities. It operates through the following segments: UGG Brand, HOKA Brand, Teva Brand, Sanuk Brand, Other Brands, and Direct-to-Consumer. The UGG Brand segment offers a line of premium footwear, apparel, and accessories. The HOKA Brand segment sells footwear and apparel that offers enhanced cushioning and inherent stability with minimal weight, originally designed for ultra-runners. The Teva Brand segment focuses on the sport sandal and modern outdoor lifestyle category, such as sandals, shoes, and boots. The Sanuk Brand segment originated in Southern California surf culture and has emerged into a lifestyle brand with a presence in the relaxed casual shoe and sandal categories. The Other Brands segment includes the Koolaburra by UGG brand. The Direct-to-Consumer segment consists of retail stores and e-commerce websites. The company was founded by Douglas B. Otto in 1973 and is headquartered in Goleta, CA.
Predefined Scans Triggered: Parabolic SAR Buy Signals.
Below are the commentary and chart from yesterday (11/17):
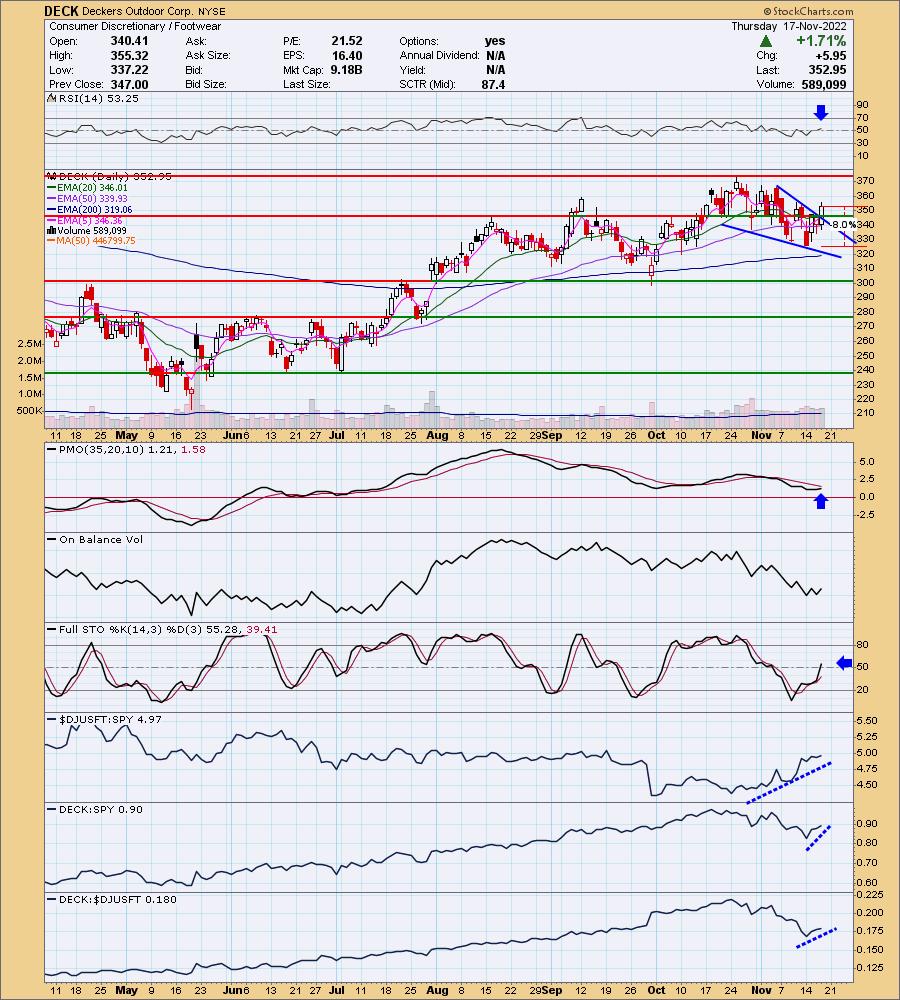
"DECK is down -3.66% in after hours trading. This is one of my picks. I'm not happy to see it down so much in after hours trading, but it will afford you a better entry if the chart doesn't go south too quickly. It may need pullback after today's breakout. The breakout confirms a bullish falling wedge. The RSI just moved into positive territory and the PMO has turned up. It is new momentum given there isn't a crossover yet. However, that makes this a more risky trade. Stochastics are rising but aren't above 80 yet. Relative strength is great for the group and DECK is showing new strength against the group and SPY. The stop is set at 8% around $324.71."
Here is today's chart:
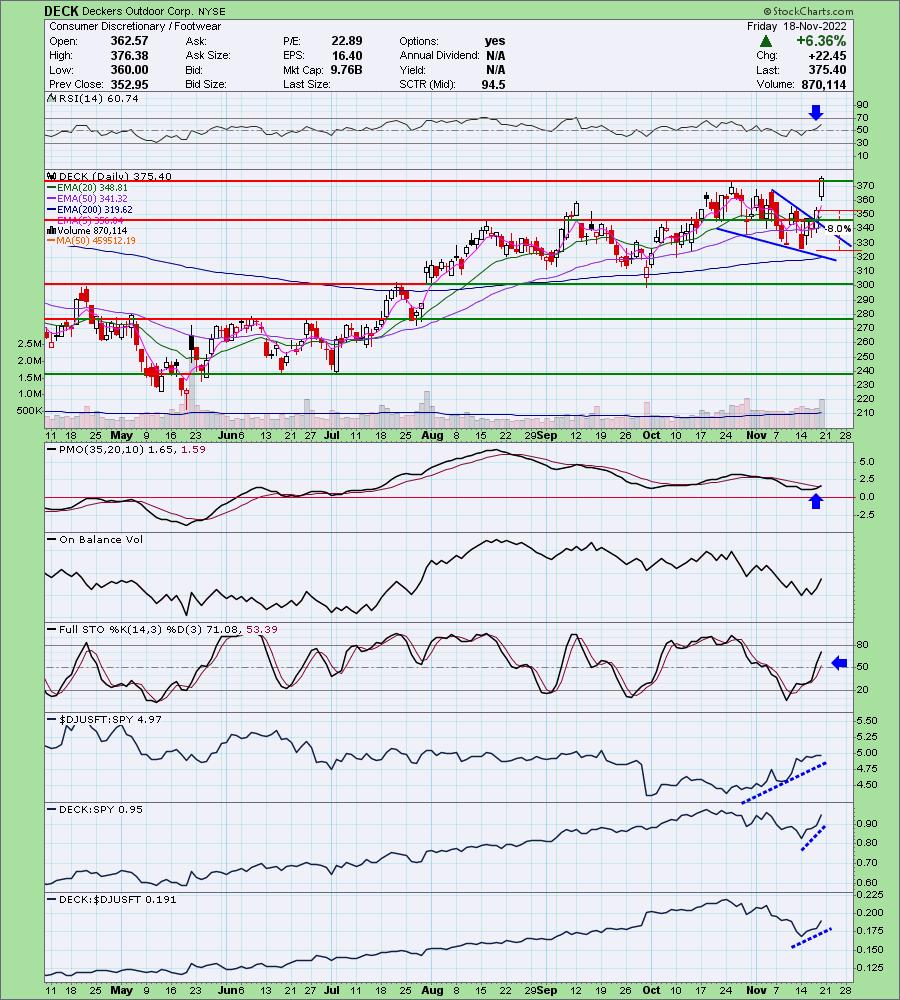
I'm pleased to say this was my pick yesterday and not a reader request. The breakout that confirmed the bullish falling wedge yesterday saw excellent follow-through. This one has much further to run, but may require a small pullback first which would give you a better entry.
Don't forget, on Thursdays I look at reader-requested symbols, so shoot me an email at erin@decisionpoint.com. I read every email I receive and try to answer them all!
Dud:
iHeartMedia Inc. (IHRT)
EARNINGS: 02/23/2023 (AMC)
iHeartMedia, Inc. engages in the provision of media and entertainment services. It operates through the following segments: Multiplatform Group, Digital Audio Group, and Audio and Media Services Group. The Multiplatform Group segment consists of Broadcast radio, Networks and Sponsorships and Events businesses. The Digital Audio Group segment focuses on the Digital businesses, including Podcasts. The Audio and Media Services segment includes Katz Media Group ("Katz Media"), the company's full-service media representation business, and RCSSound Software (RCS), a provider of scheduling and broadcast software and services. The company was founded by L. Lowry Mays and B. J. McCombs in May 2007 and is headquartered in San Antonio, TX.
Predefined Scans Triggered: Bullish MACD Crossovers and Entered Ichimoku Cloud.
Below are the commentary and chart from Tuesday (11/15):
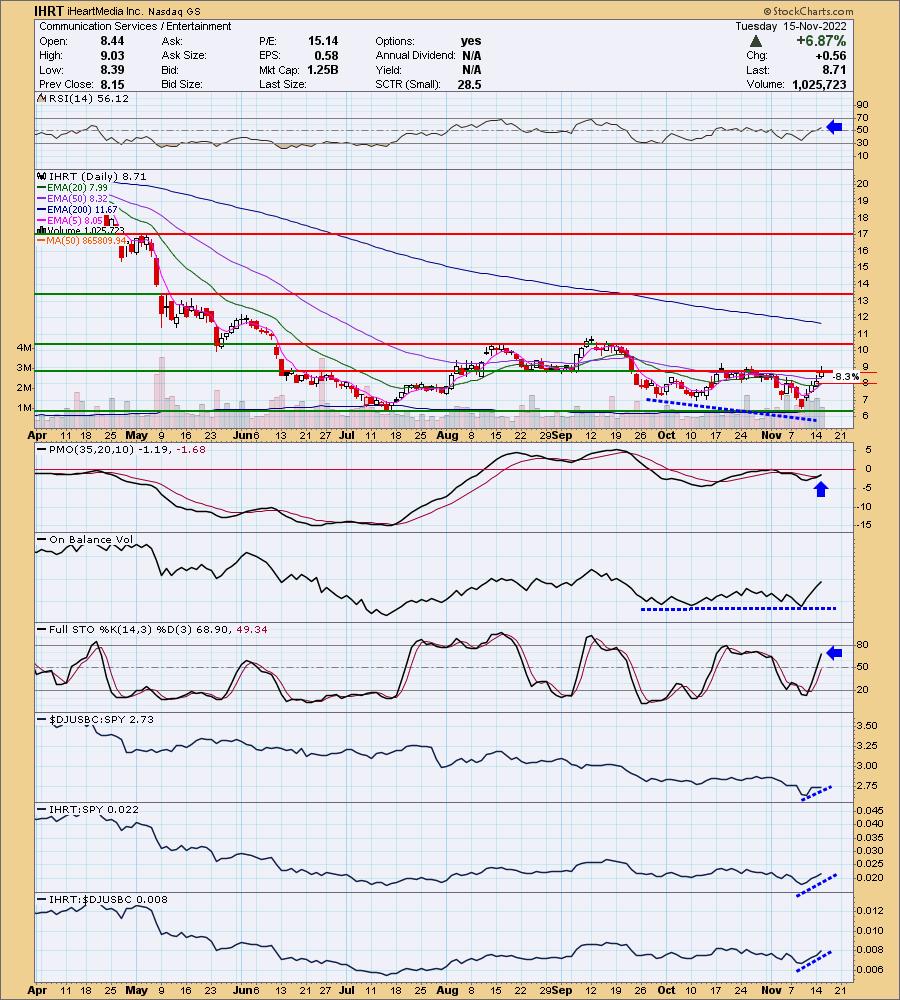
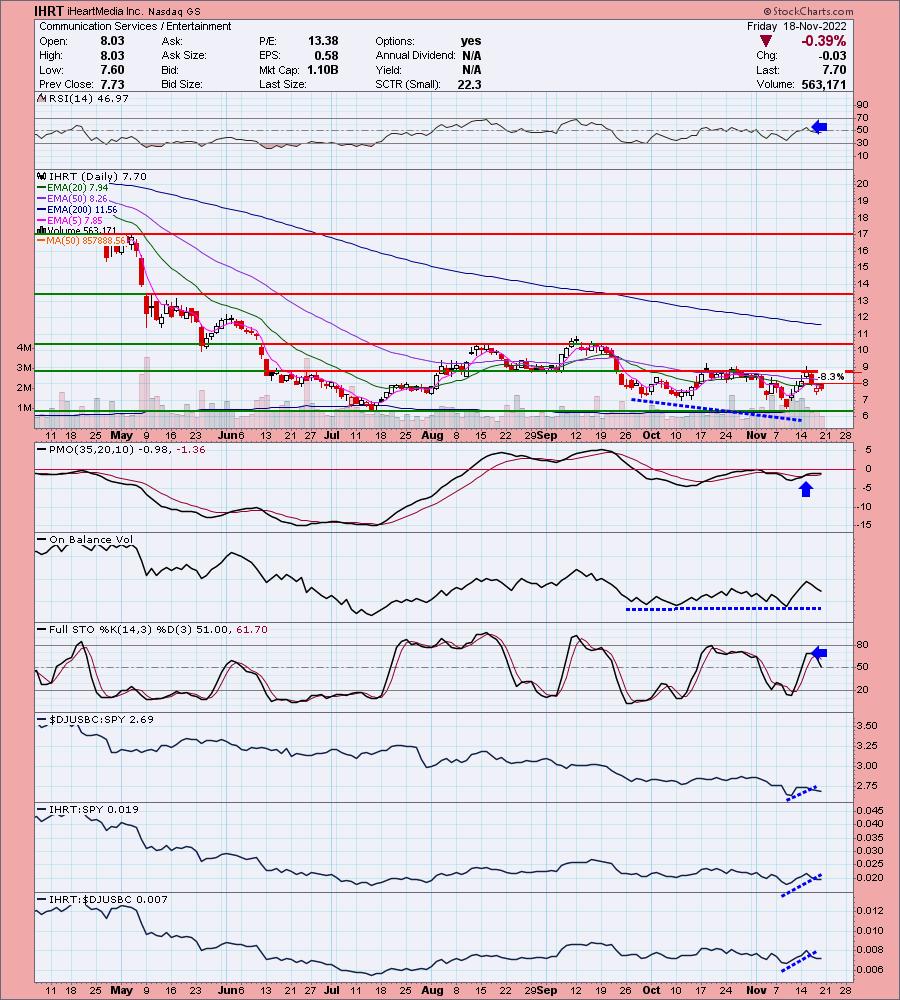
"IHRT is up +3.33% in after hours trading so we may be onto something here. It was up well over 6% today, but I think it has more to go. Today was the first time since September since it fully traded above the 50-day EMA. We got a Short-Term Trend Model BUY signal as the 5-day EMA crossed above the 20-day EMA. The RSI is just now positive and today we had a PMO crossover BUY signal. There is a positive OBV divergence with price bottoms. Stochastics are on their way to territory above 80 which we want. Relative strength is improving for the group and IHRT. It beginning to outperform its group. The stop could honestly be set deeper given today's big rally, but for now I have it set at 8.3% around $7.98."
Here is today's chart:
This one went south the very next day as the stop was technically hit intraday. I studied the chart above and I really don't see anything wrong with it technically with the exception of not getting confirmation with a breakout. One subscriber mentioned in the trading room chat that there were fundamental problems under the surface that I wasn't aware of. Stay away.
THIS WEEK's Sector Performance:

DecisionPoint Sector Scoreboard (Mechanical Trend Model Signals):

Click Here to view Carl's annotated Sector ChartList!
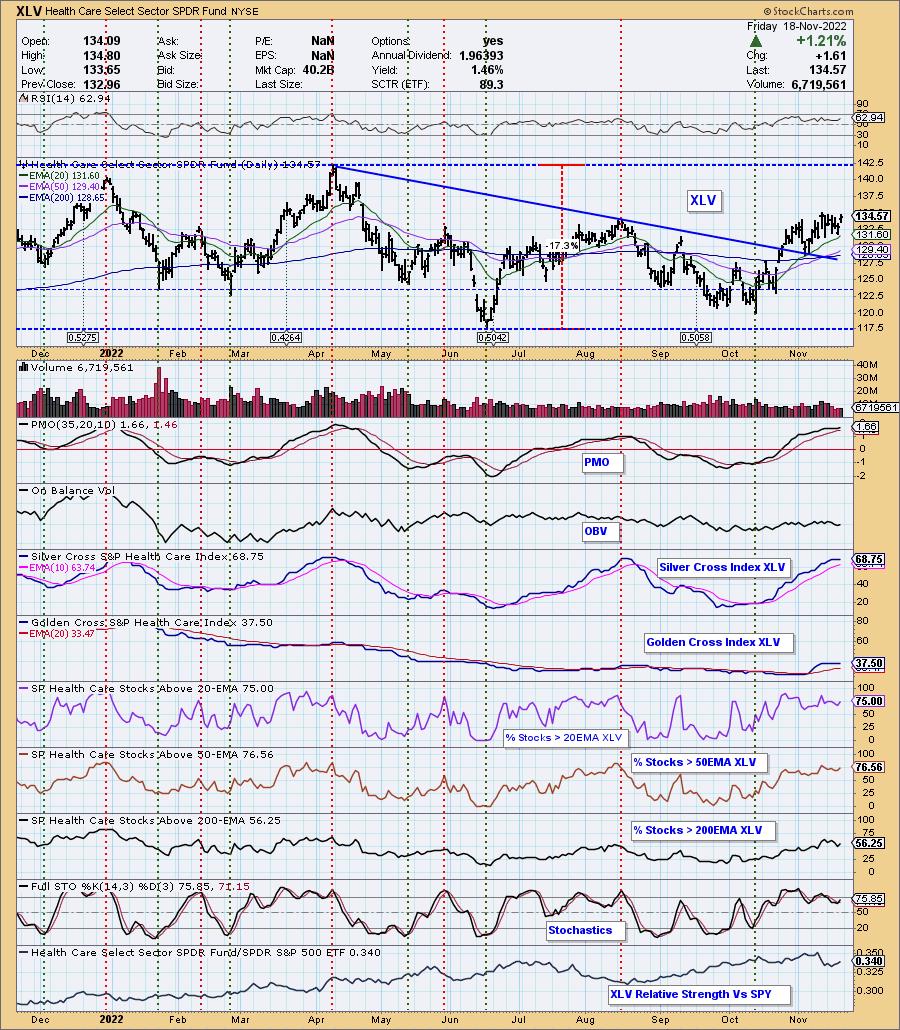
Sector to Watch: Healthcare (XLV)
I picked XLV today based on the rising PMO, positive RSI and rising Stochastics. Additionally, the Silver Cross Index (SCI) is not falling as it is on other sectors. However, I note that the SCI has held the same reading for four days. So it isn't falling, but it isn't rising either. XLV has broken its intermediate-term declining trend and gapped up today. I was told that Healthcare is a place money managers like to park money at the end of the year.
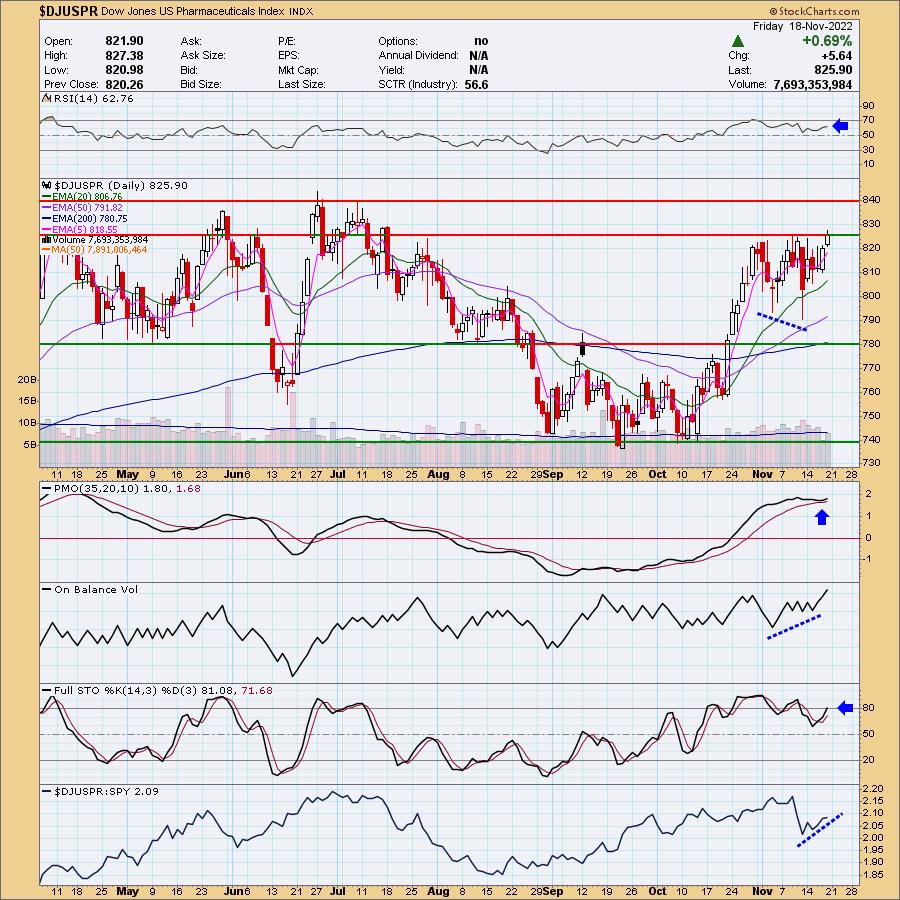
Industry Group to Watch: Pharmaceuticals ($DJUSPR)
The pharma industry group chart looks excellent, but I'll tell you I didn't like the look of XPH which is the SPDR ETF. PPH looked pretty good though if you're interested in trading the ETF. RSI is positive and we have a tiny breakout. The PMO has bottomed above its signal line which is especially bullish. I see a positive OBV divergence as well as Stochastics moving above 80. Finally, relative strength is picking up. I unfortunately didn't pack my list of stocks that we mined today, but I do remember that Merck (MRK) and Johnson and Johnson (JNJ) looked bullish.
Go to our Sector ChartList on DecisionPoint.com to get an in-depth view of all the sectors. On StockCharts.com you can find the Industry Summary.
Have a great weekend! Good Luck & Good Trading!
- Erin
erin@decisionpoint.com
Full Disclosure: I'm 35% exposed.
Watch the latest episode of DecisionPoint with Carl & Erin Swenlin on Mondays 7:00p EST or on the DecisionPoint playlist on the StockCharts TV YouTube channel here!
Technical Analysis is a windsock, not a crystal ball. --Carl Swenlin
NOTE: The stocks reported herein are from mechanical trading model scans that are based upon moving average relationships, momentum and volume. DecisionPoint analysis is then applied to get five selections from the scans. The selections given should prompt readers to do a chart review using their own analysis process. This letter is not a call for a specific action to buy, sell or short any of the stocks provided. There are NO sure things or guaranteed returns on the daily selection of "diamonds in the rough."
Helpful DecisionPoint Links:
DecisionPoint Shared ChartList and DecisionPoint Chart Gallery
Price Momentum Oscillator (PMO)
Swenlin Trading Oscillators (STO-B and STO-V)
(c) Copyright 2022 DecisionPoint.com