
It's Reader Request Day! I had a fair amount of requests and they brought up two prior themes, Energy and Insurance. I also found that requests were beginning to come in for Consumer Discretionary. I opted to present one that likely will fall under the category "winners will keep on winning".
I would say that all of the requests presented today are "Diamonds in the Rough" with some being more short-term than others. Don't feel bad if your stocks weren't picked! I can't cover them all and with too many people I can't even pick one from each person.
Be careful expanding exposure. I'm still not ready to and remain at 12% exposed with a 2% hedge.
Good Luck & Good Trading,
Erin
Today's "Diamonds in the Rough": CB, FL, MPC and PGR.
Important: Your current subscription rates will ALWAYS stay the same when we raise prices. **
** You must keep your subscription running and in good standing.

RECORDING LINK (12/23/2022):
Topic: DecisionPoint Diamond Mine (12/23/2022) LIVE Trading Room
Start Time: Dec 23, 2022 09:00 AM
Passcode: Dec=23rd
REGISTRATION for 12/30/2022:
When: Dec 30, 2022 09:00 AM Pacific Time (US and Canada)
Topic: DecisionPoint Diamond Mine (12/30/2022) LIVE Trading Room
Register in advance for this webinar HERE
After registering, you will receive a confirmation email containing information about joining the webinar.

Here is the last recording (no recording on 12/26):
Welcome to DecisionPoint Diamonds, wherein I highlight ten "Diamonds in the Rough" per week. These are selected from the results of my DecisionPoint Scans which search for stocks that could benefit from the trend and condition of the market. Remember, these are not recommendations to buy or sell, but are the most interesting of the stocks that surfaced in my scans. My objective is to save you the work of the initial, tedious culling process, but you need to apply your own analysis to see if these stocks pique your interest as well. There are no guaranteed winners here!
"Predefined Scans Triggered" are taken from StockCharts.com using the "Symbol Summary" option instead of a "SharpChart" on the workbench.
Stop levels are all rounded down.
Chubb Ltd. (CB)
EARNINGS: 01/31/2023 (AMC)
Chubb Ltd. is a holding company, which engages in the provision of commercial and personal property and casualty insurance, personal accident and accident and health (A&H), reinsurance, and life insurance. It operates through the following segments: North America Commercial Property and Casualty (P&C) Insurance, North America Personal P&C Insurance, North America Agricultural Insurance, Overseas General Insurance, Global Reinsurance, and Life Insurance. The North America Commercial P&C Insurance segment that includes the business written by Chubb divisions that provide P&C insurance and services to large, middle market and small commercial businesses in the U.S., Canada, and Bermuda. The North America Personal P&C Insurance segment offers affluent and high net worth individuals and families with homeowners, high value automobile and collector cars, valuable articles, personal and excess liability, travel insurance, and recreational marine insurance and services. The North America Agricultural Insurance segment is involved in comprehensive multiple peril crop insurance (MPCI) and crop-hail insurance, and Chubb agribusiness. The Overseas General Insurance segment caters both commercial and consumer P&C insurance and services in countries and territories outside of North America where the company operates. The The Global Reinsurance segment covers reinsurance business. The Life Insurance segment focuses on its international life operations. The company was founded in 1882 and is headquartered in Zurich, Switzerland.
Predefined Scans Triggered: New 52-week Highs and P&F Double Top Breakout.
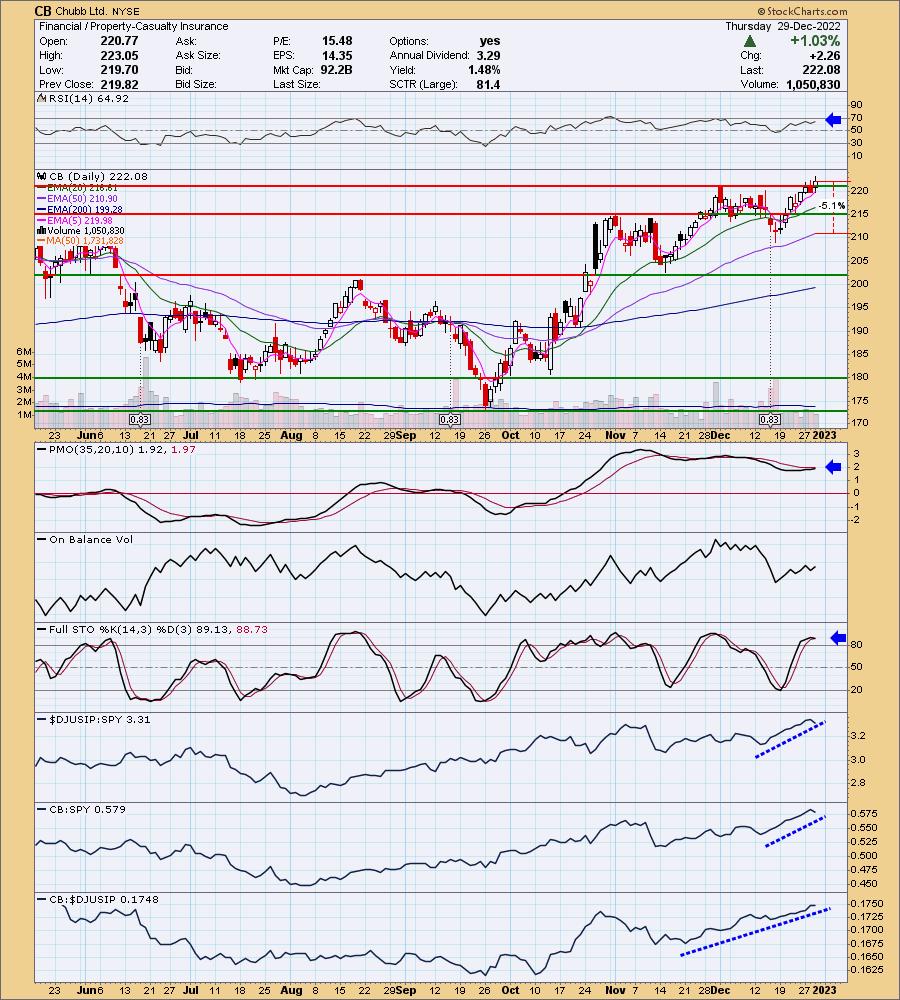
CB is down -0.13% in after hours trading. This is the one that is filed under 'winners keep on winning'. It is making new 52-week highs after a two week rally. The RSI is positive and the PMO is about to trigger a crossover BUY signal. Stochastics are above 80. Relative strength studies show a bullish group and CB outperforming both the group and the SPY. The stop is set at 5.1% around $210.75.
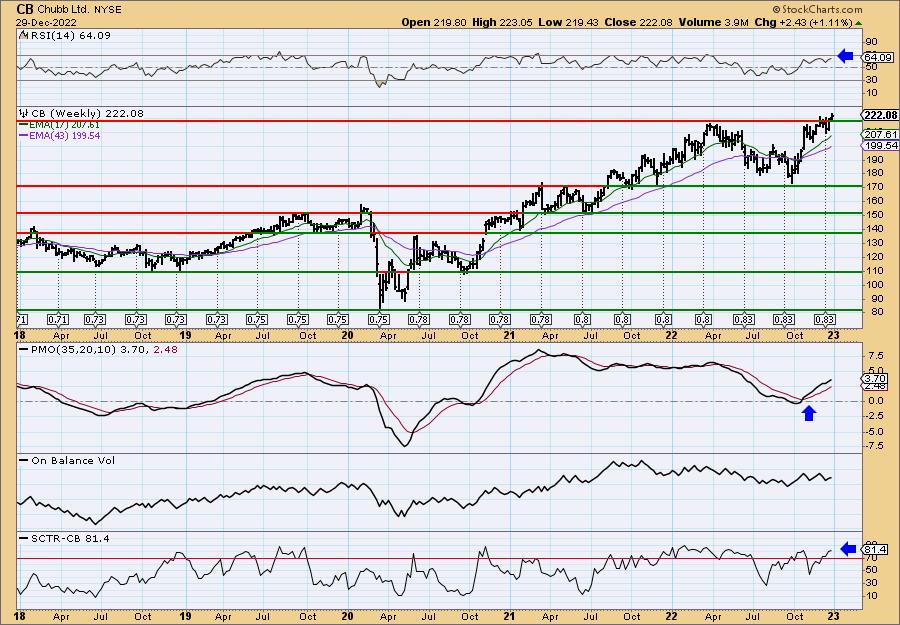
CB is not only making new 52-week highs, it is also at all-time highs. Amazingly, indicators are not overbought. The weekly RSI is positive and the weekly PMO is rising strongly. The StockCharts Technical Rank (SCTR) is in the "hot zone" above 70, implying that CB is in the top 20% of large-caps based on intermediate- and long-term trend and condition. Since it is making new all-time highs, consider a stop of 15% around $255.39.
Foot Locker, Inc. (FL)
EARNINGS: 02/24/2023 (BMO)
Foot Locker, Inc. engages in the retail of athletic shoes and apparel. The firm uses its omni-channel capabilities to bridge the digital world and physical stores, including order-in-store, buy online and pickup-in-store, and buy online and ship-from-store, as well as e-commerce. It operates through following segments: North America, EMEA (Europe, Middle East, and Africa, and Asia Pacific. The North America segment includes the following banners operating in the U.S. and Canada: Foot Locker, Kids Foot Locker, Lady Foot Locker, Champs Sports, and Footaction. The EMEA segment includes the following banners operating in Europe: Foot Locker, Runners Point, Sidestep, and Kids Foot Locker. The Asia Pacific segment includes Foot Locker and Kids Foot Locker operating in Australia, New Zealand, and Asia. The company was founded on April 7, 1989 and is headquartered in New York, NY.
Predefined Scans Triggered: None.
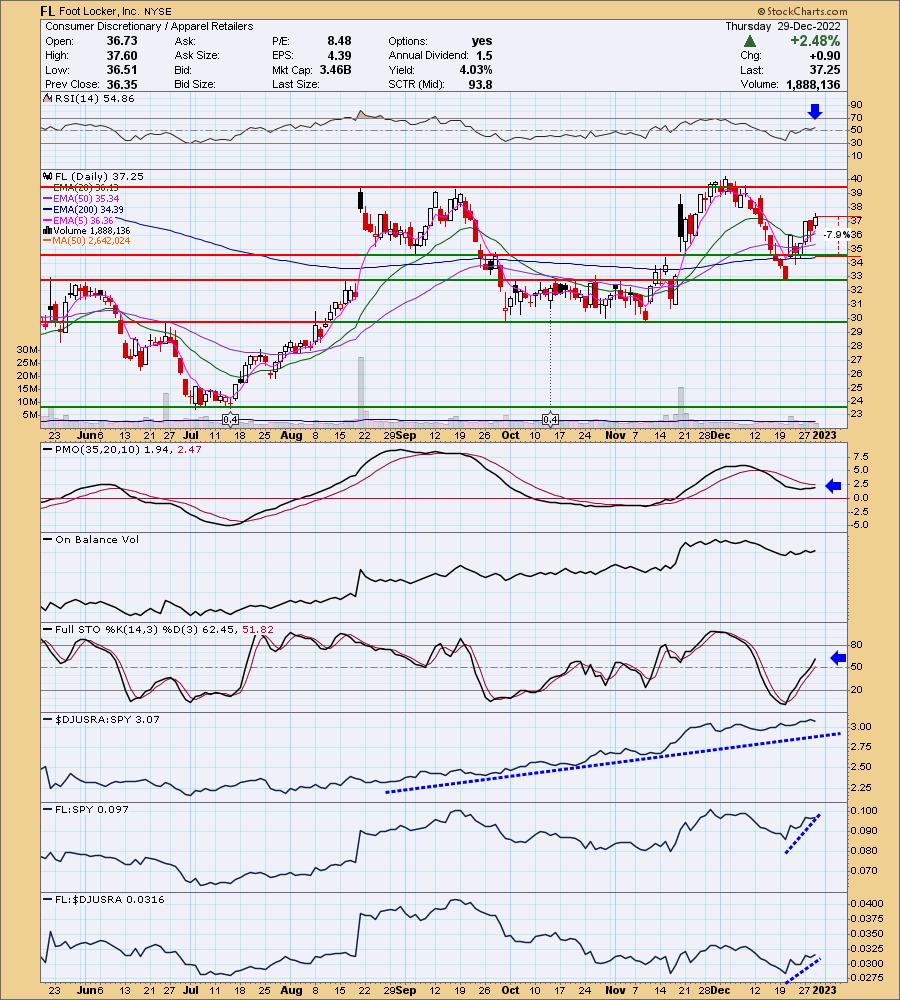
FL is down -0.67% in after hours trading. I like the recovery from the sharp declining trend. The RSI is now positive and the PMO is nearing a crossover BUY signal. Stochastics are rising strongly and should get above 80 soon. Relative strength for the group is excellent and FL is a leader in the group based on relative strength right now. The stop is set below support at the 200-day EMA and early September low around 7.9% or $34.30.
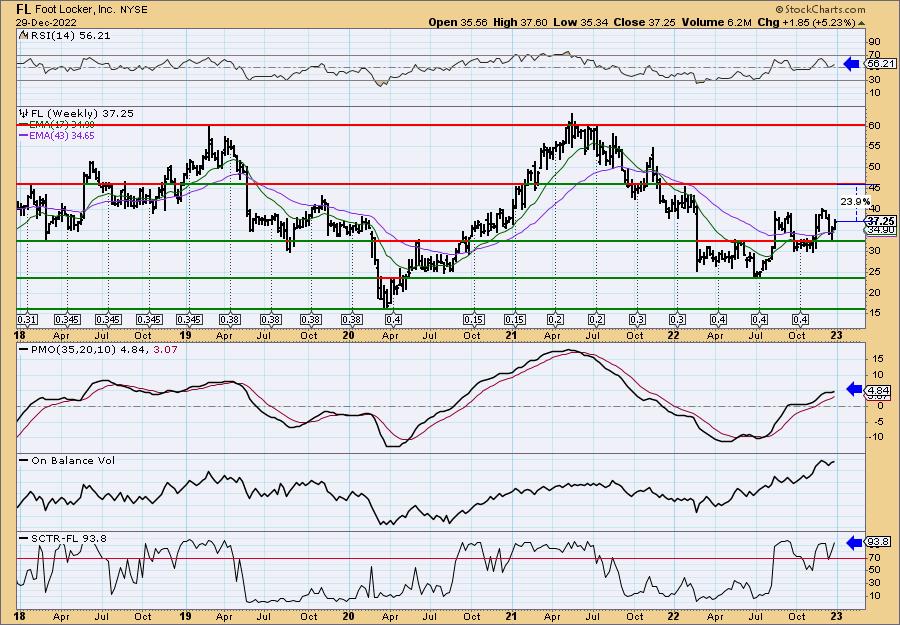
Price bounced off long-term support, but is nearing short-term resistance. Given the positive weekly RSI and newly accelerating weekly PMO, I would expect a breakout above the last two 2022 tops. Upside potential is around 23.9%.
Marathon Petroleum Corp. (MPC)
EARNINGS: 01/31/2023 (BMO)
Marathon Petroleum Corp. is an independent company, which engages in the refining, marketing, and transportation of petroleum products in the United States. It operates through the following segments: Refining and Marketing, and Midstream. The Refining and Marketing segment refines crude oil and other feedstocks at its refineries in the Gulf Coast and Midwest regions of the United States, purchases ethanol and refined products for resale and distributes refined products through various means, including barges, terminals, and trucks that the company owns or operates. The Midstream segment transports, stores, distributes and markets crude oil and refined products principally for the Refining and Marketing segment via refining logistics assets, pipelines, terminals, towboats, and barges. It also gathers, processes, and transports natural gas, and gathers, transports, fractionates, stores, and markets NGLs. The company was founded in 1887 and is headquartered in Findlay, OH.
Predefined Scans Triggered: Moved Above Ichimoku Cloud.
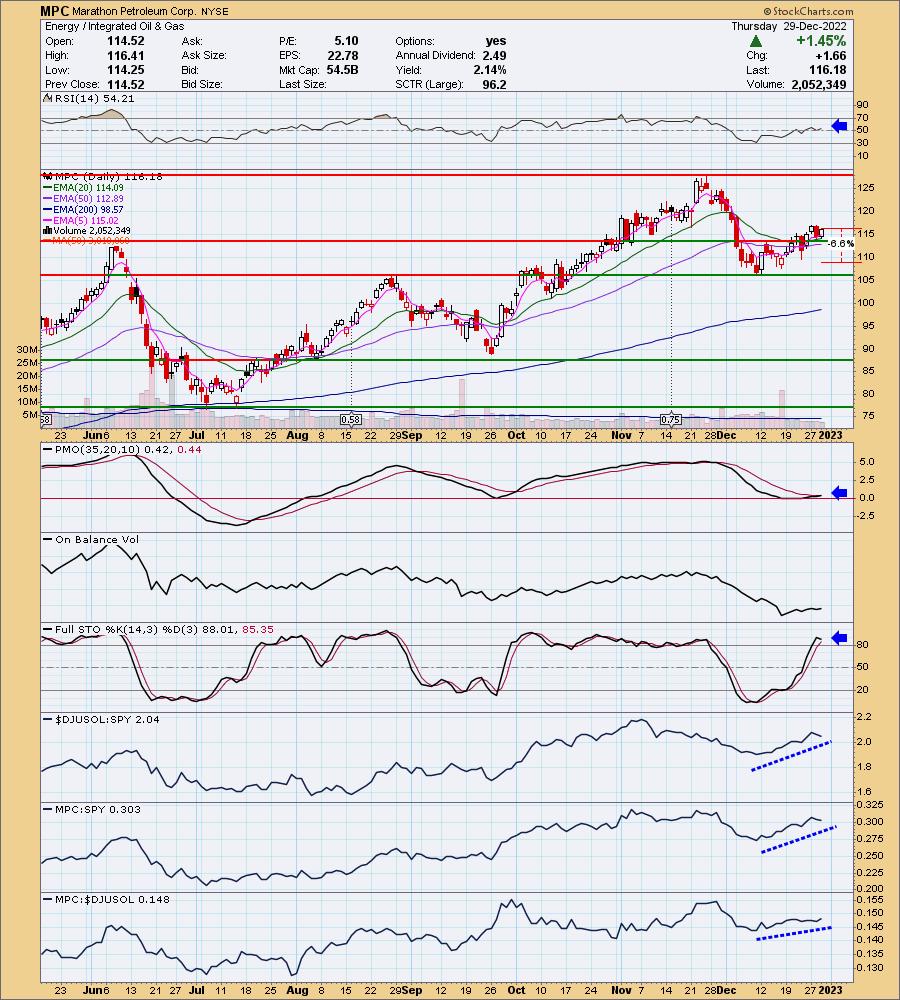
MPC is unchanged in after hours trading. I liked this one because price was above the June 2021 top and key moving averages. I also like this group. If you recall it was my "Industry Group to Watch" last Friday. The RSI is positive and rising. The PMO is about to trigger a crossover BUY signal. Stochastics are above 80. The group is outperforming the SPY and MPC is outperforming both. The stop is set at 6.6% around $108.51.
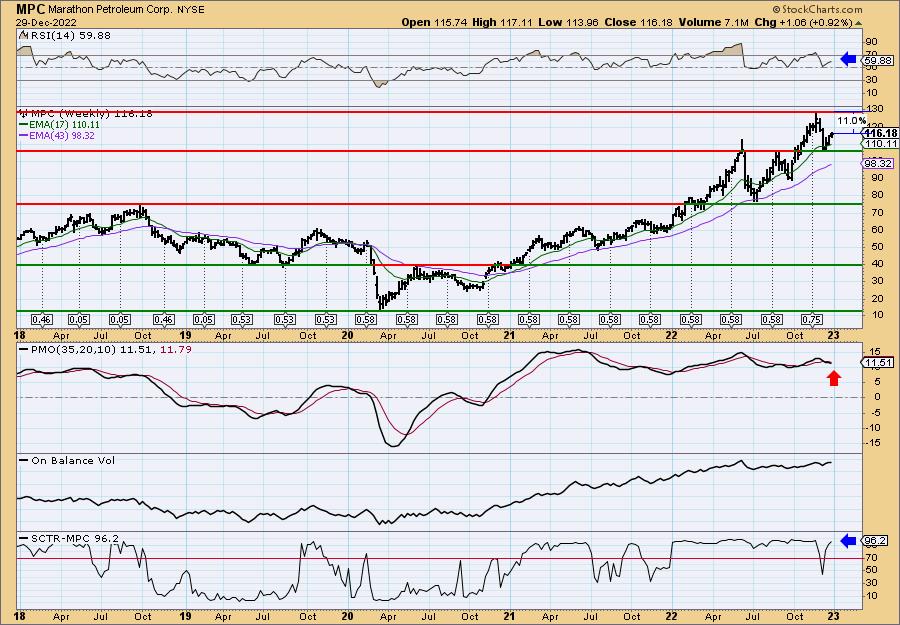
The only problem with the weekly chart is the weekly PMO which is on a SELL signal and falling. That suggests this is more of a short-term trade rather than an intermediate-term investment. The weekly RSI has been positive all year long. The SCTR has spent time in the 90% range all year. I think we can forgive the weekly PMO but keep a tight leash. Overhead resistance arrives soon, so consider an upside target of about 16% or $134.76.
Progressive Corp. (PGR)
EARNINGS: 01/25/2023 (BMO)
Progressive Corp. is an insurance holding company. engages in the provision of personal and commercial auto insurance, residential property insurance, and other specialty property-casualty insurance and related services. It operates through the following segments: Personal Lines, Commercial Lines and Property. The Personal Lines segment includes agency and direct businesses. The Commercial Lines segment writes primary liability and physical damage insurance for automobiles and trucks owned and operated predominately by small business in the auto, for-hire transportation, contractor, for-hire specialty, tow, and for-hire livery markets. The Property segment covers residential property insurance for homeowners, other property owners, and renters. The company was founded on March 10, 1937, and is headquartered in Mayfield Village, OH.
Predefined Scans Triggered: None.
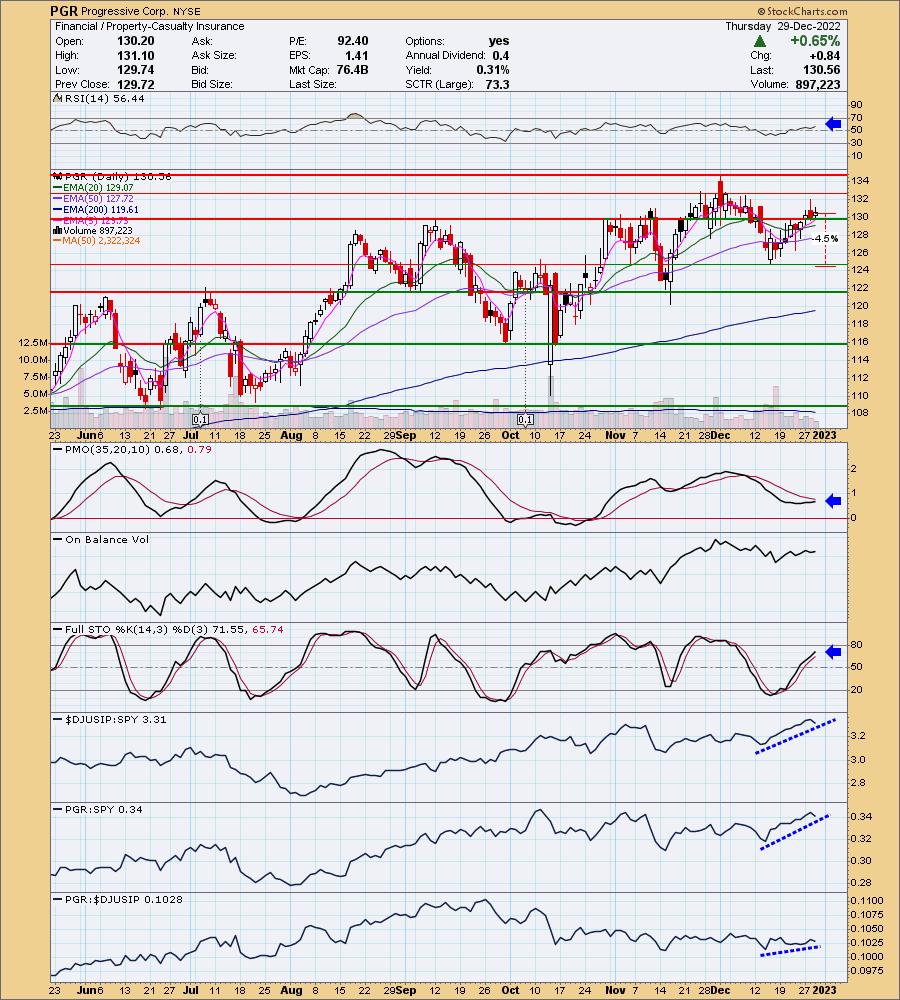
PGR is down -0.35% in after hours trading. I like the breakout above overhead resistance and price's location above key moving averages. The RSI is positive and the PMO while somewhat flat, should trigger a crossover BUY signal shortly. Stochastics are rising nicely and should get above 80 very soon. Relative strength of the insurance groups has been rising and Property-Casualty Insurance is no exception. PGR seems a pretty good performer against the group so it is therefore outperforming the SPY. The stop is about 4.5% below support around $124.68.
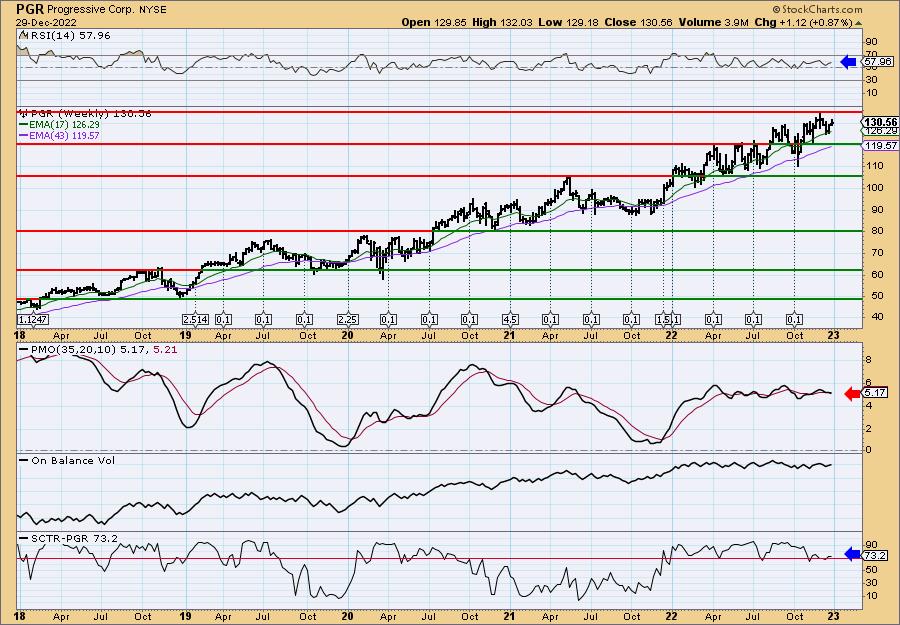
The weekly PMO may look suspect and it is currently on a crossover SELL signal; however, this is indicative of a steady rising trend. The weekly RSI is positive and the SCTR is in the hot zone above 70. Since it is at all-time highs, consider an upside target around 15% or $150.14.
Don't forget, on Thursdays I look at reader-requested symbols, click HERE to send me an email. I read every email I receive and try to answer them all!
Current Market Outlook:
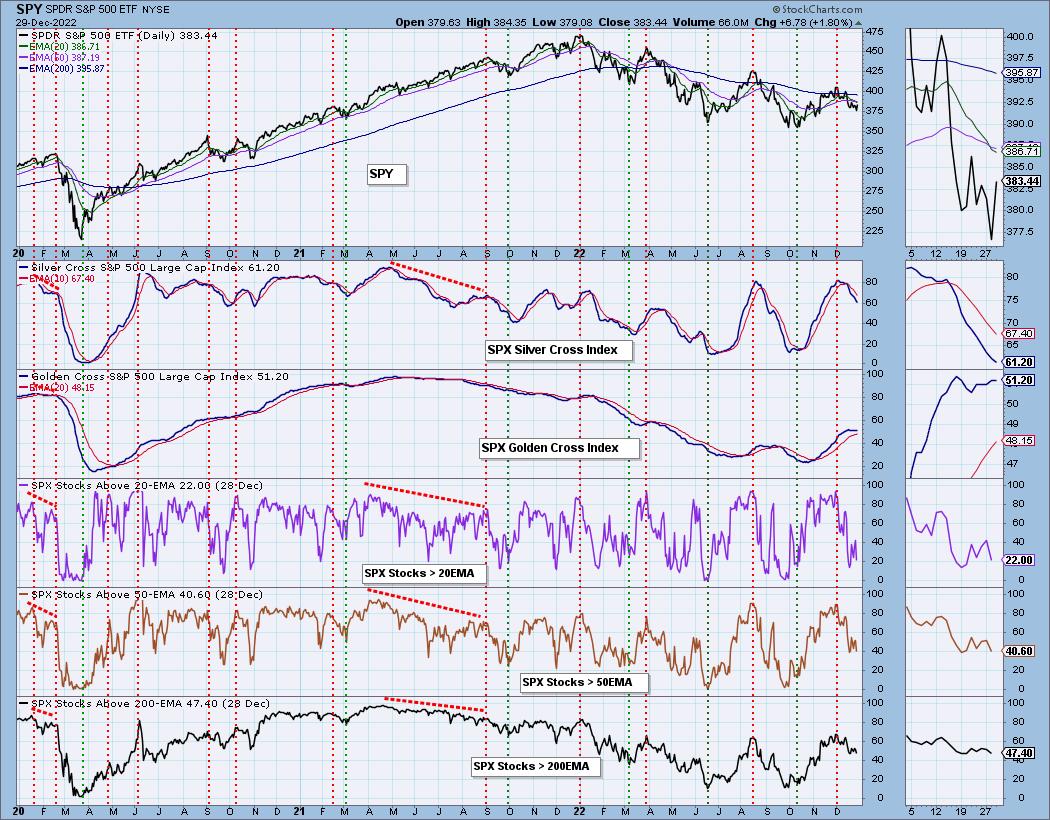
Market Environment: It is important to consider the odds for success by assessing the market tides. The following chart uses different methodologies for objectively showing the depth and trend of participation for intermediate- and long-term time frames.
- The Silver Cross Index (SCI) shows the percentage of SPX stocks on IT Trend Model BUY signals (20-EMA > 50-EMA)
- The Golden Cross Index (GCI) shows the percentage of SPX stocks on LT Trend Model BUY signals (50-EMA > 200-EMA)
Don't forget that as a "Diamonds" member, you have access to our GCI/SCI curated ChartList on DecisionPoint.com. You'll find it under "Members Only" links on the left side on the Blogs and Links Page.
Here is the current chart:
Full Disclosure: I am 12% exposed with a 2% hedge.
I'm required to disclose if I currently own a stock I mention and/or may buy/short it within the next 72 hours.
"Technical Analysis is a windsock, not a crystal ball." - Carl Swenlin
(c) Copyright 2022 DecisionPoint.com
Watch the latest episode of DecisionPoint with Carl & Erin Swenlin on Mondays 7:00p EST or on the DecisionPoint playlist on the StockCharts TV YouTube channel here!
NOTE: The stocks reported herein are from mechanical trading model scans that are based upon moving average relationships, momentum and volume. DecisionPoint analysis is then applied to get five selections from the scans. The selections given should prompt readers to do a chart review using their own analysis process. This letter is not a call for a specific action to buy, sell or short any of the stocks provided. There are NO sure things or guaranteed returns on the daily selection of "Diamonds in the Rough."
Regarding BUY/SELL Signals: The signal status reported herein is based upon mechanical trading model signals and crossovers. They define the implied bias of the price index/stock based upon moving average relationships and momentum, but they do not necessarily call for a specific action. They are information flags that should prompt chart review. Further, they do not call for continuous buying or selling during the life of the signal. For example, a BUY signal will probably (but not necessarily) return the best results if action is taken soon after the signal is generated. Additional opportunities for buying may be found as price zigzags higher, but the trader must look for optimum entry points. Conversely, exit points to preserve gains (or minimize losses) may be evident before the model mechanically closes the signal.
Helpful DecisionPoint Links:
DecisionPoint Shared ChartList and DecisionPoint Chart Gallery
Price Momentum Oscillator (PMO)
Swenlin Trading Oscillators (STO-B and STO-V)
For more links, go to DecisionPoint.com