
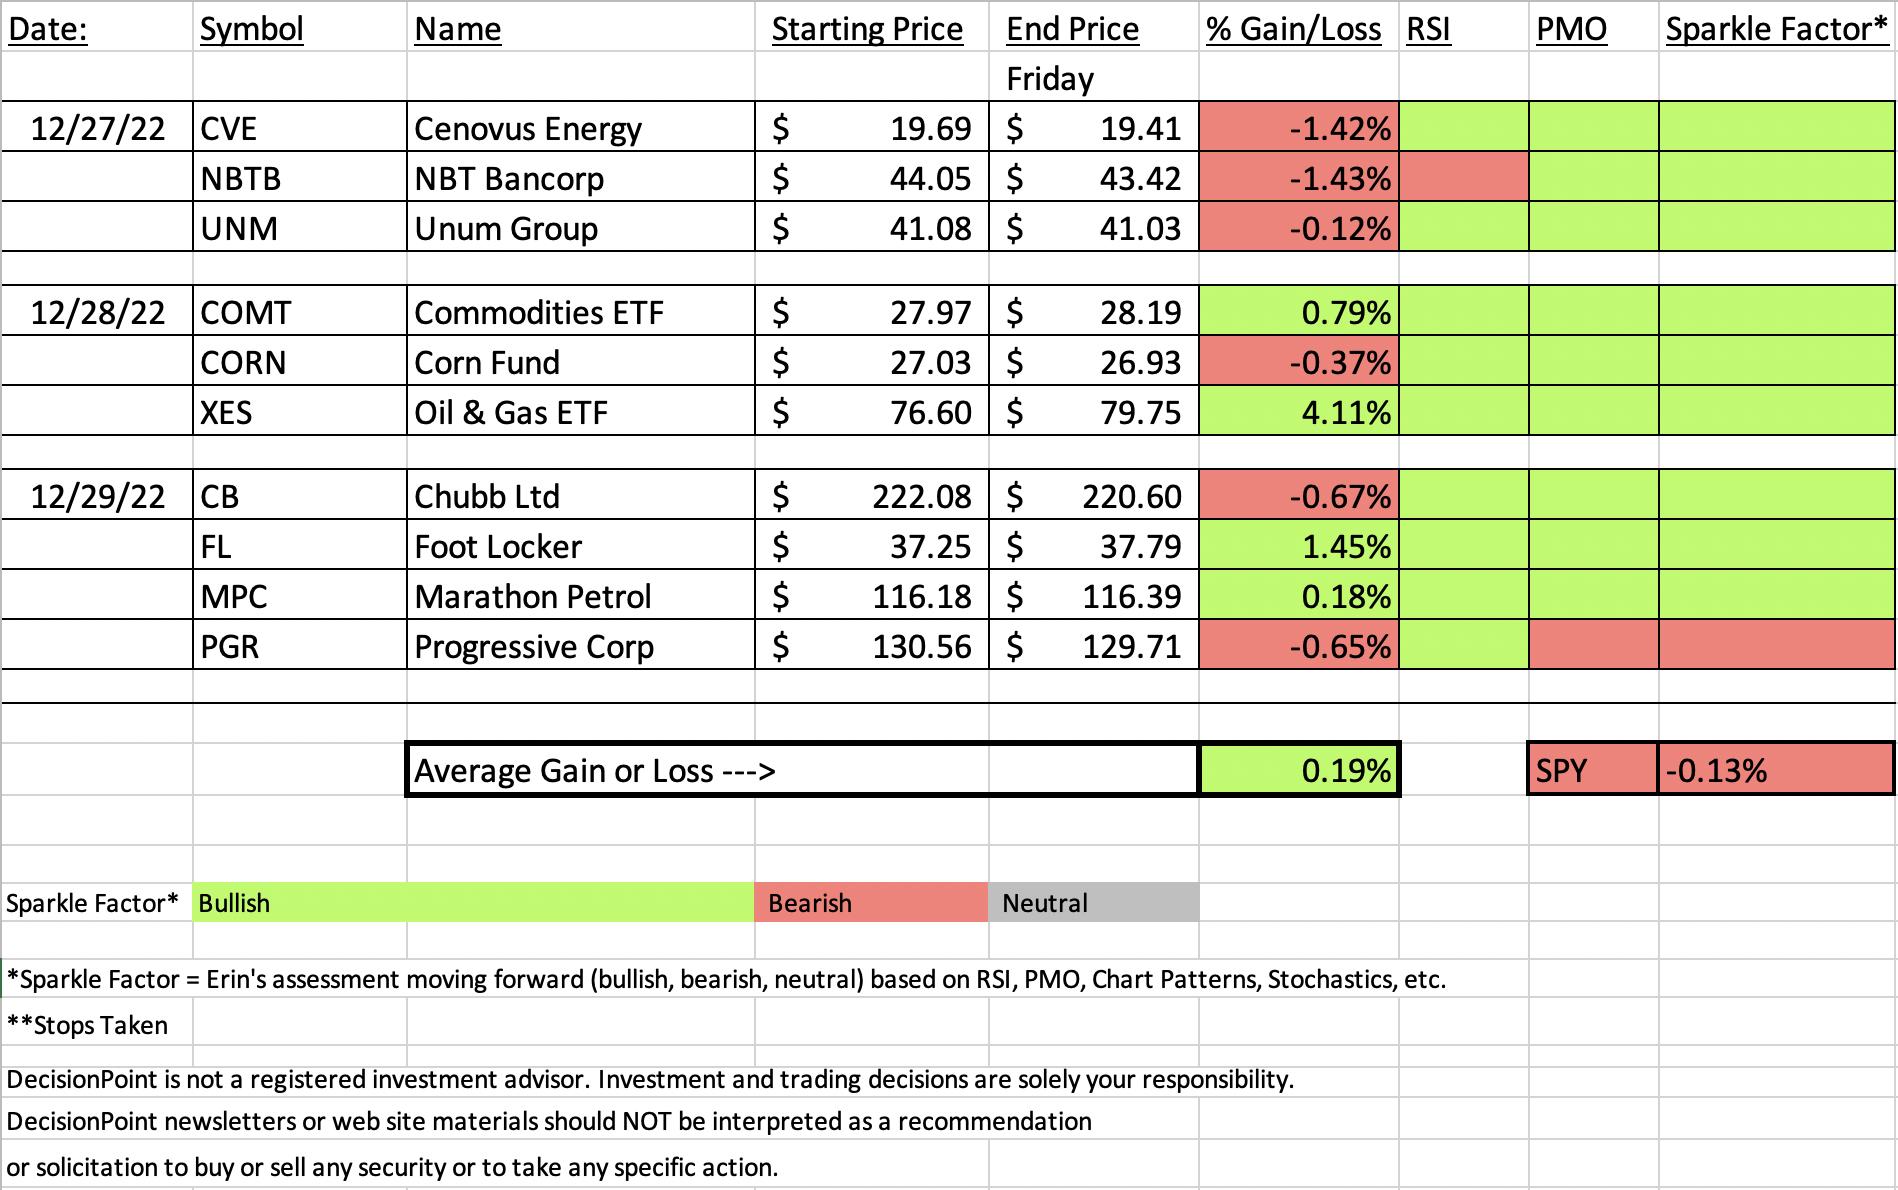
The market was down slightly on the week, but "Diamonds in the Rough" finished higher on average. While we don't go back and look at "Diamonds in the Rough" again, I do give you my opinion on whether it is a hold/buy moving forward. This week I only found one stock that I don't like going into next week.
In fact, the indicators improved enough or were strong enough to see the RSI in positive territory and the PMO rising.
This week's "Darling" was the Oil & Gas ETF (XES). It was up over 4% since Wednesday. Energy and Crude Oil have reversed and this has given XES and beautiful setup.
The "Dog" was only down -1.43%, NBT Bancorp (NBTB). In spite of a bad performance since Tuesday, I still believe the chart has merit. The pullback may've made the chart a bit more bullish if anything.
Thank you as always for your patience regarding my travel.
Good Luck & Good Trading,
Erin

RECORDING LINK (12/30/2022):
Topic: DecisionPoint Diamond Mine (12/30/2022) LIVE Trading Room
Start Time: Dec 30, 2022 09:00 AM PT
Passcode: Dec@30th
REGISTRATION for 1/6/2022:
When: Jan 6, 2023 09:00 AM Pacific Time (US and Canada)
Topic: DecisionPoint Diamond Mine 1/6/2023) LIVE Trading Room
Register in advance for this webinar HERE
After registering, you will receive a confirmation email containing information about joining the webinar.

Our latest DecisionPoint Trading Room recording:
A few items about the spreadsheet: I've put on the spreadsheet whether the RSI is positive (green) or negative (red). The PMO column tells you if it is rising (green) or falling (red). Finally I've added my own "Sparkle Factor" that gives you my assessment going forward, bullish (green), bearish (red) or neutral (gray). The Sparkle Factor is basically my thoughts on whether I expect it to rise or fall. A neutral means it could really go either way so it could be added to a watch list. If you're in a stock I consider "neutral" going forward, the ball is in your court.
Darling:
SPDR S&P Oil & Gas Equipment & Services ETF (XES)
EARNINGS: N/A
XES tracks an equal-weighted index of companies in the oil & gas equipment and services sub-industry of the S&P Total Market Index. Click HERE for more information.
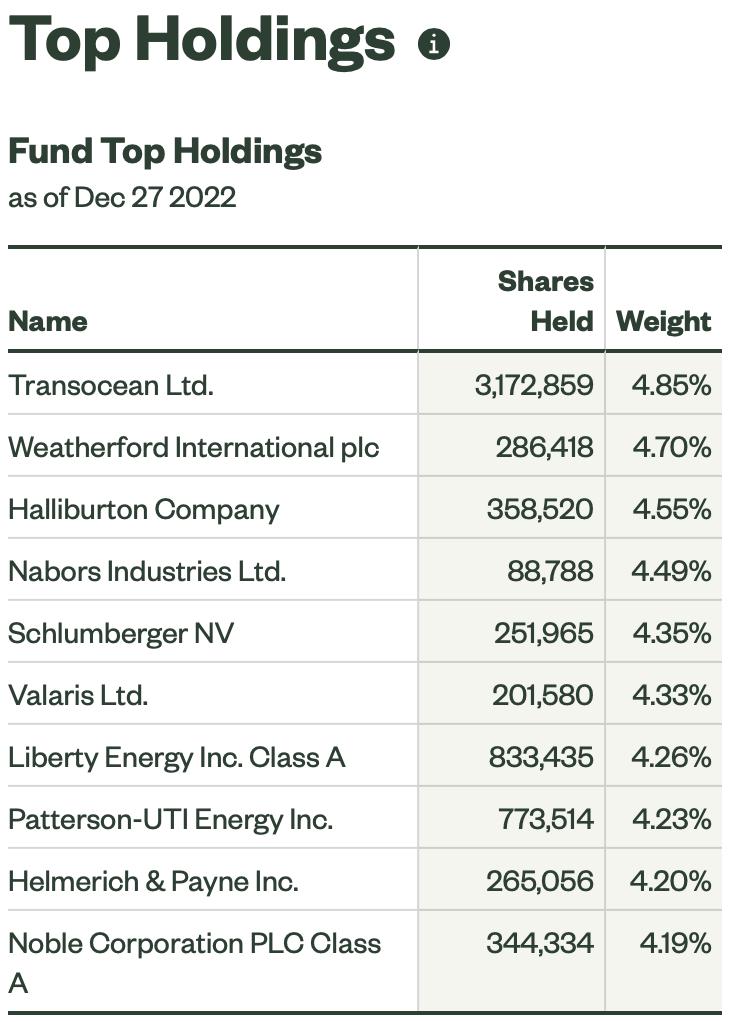
Predefined Scans Triggered: Elder Bar Turned Blue, Evening Star, P&F Ascending Triple Top Breakout, Entered Ichimoku Cloud and P&F Double Top Breakout.
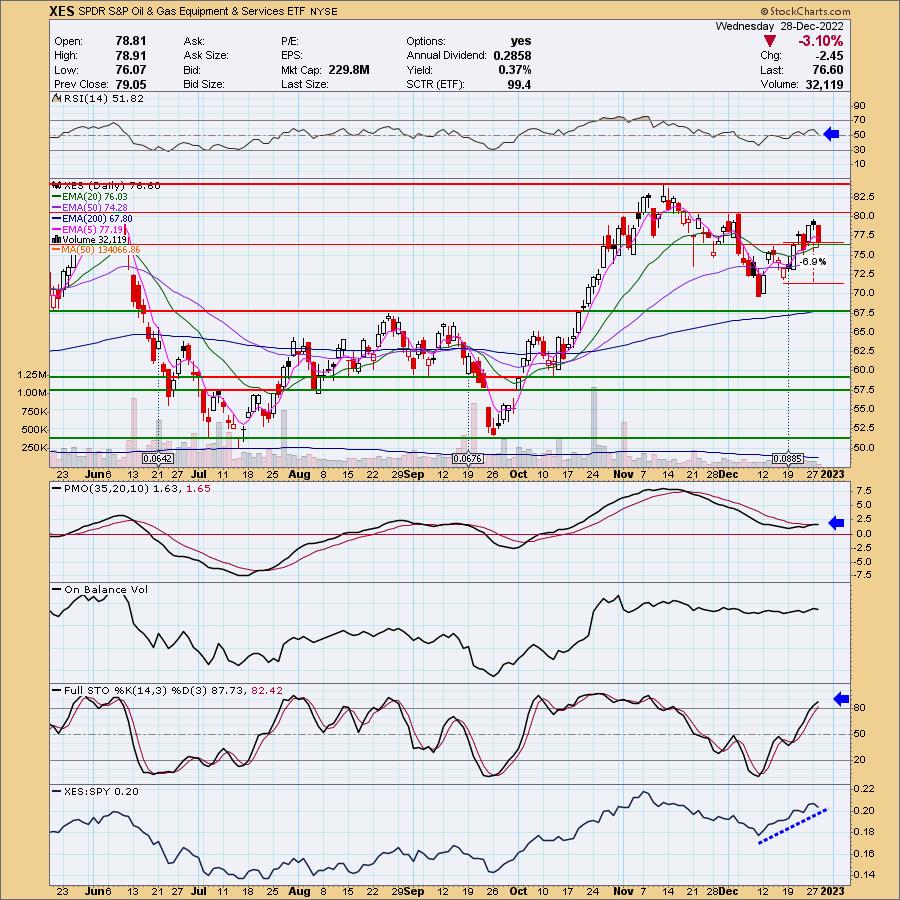
Here are the chart and commentary from Wednesday:
"XES is up +4.33% in after hours trading which will cancel out today's -3.10% decline. The rising trend wasn't compromised today so it wasn't a hard selection. The RSI is positive and will turn up as soon as price does. The PMO is only a few hundredths of a point away from a crossover BUY signal. Stochastics are above 80 and relative strength continues to get stronger. The stop is set below the last price bottom at 6.9% around $71.31."
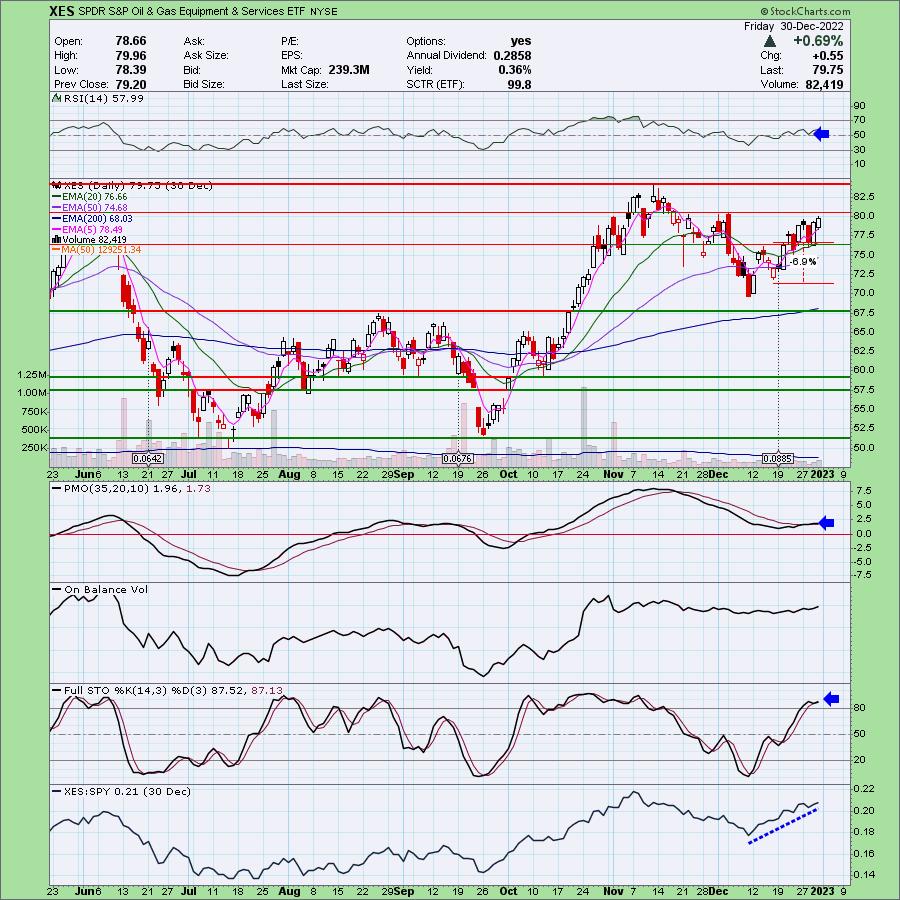
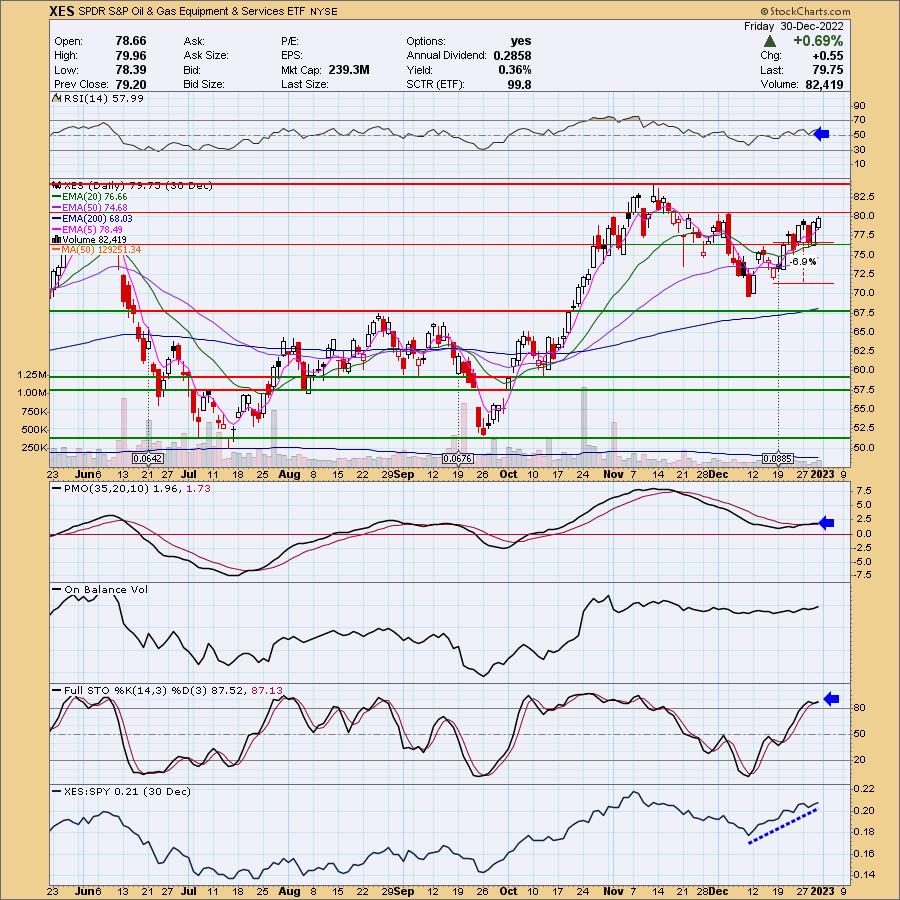
Here is today's chart:
I don't believe this rally is extended yet and the RSI is in agreement. Short-term overhead resistance is arriving about now so we will know even more on Monday about the rally's voracity.
Don't forget, on Thursdays I look at reader-requested symbols, so shoot me an email at erin@decisionpoint.com. I read every email I receive and try to answer them all!
Dud:
NBT Bancorp, Inc. (NBTB)
EARNINGS: 01/25/2023 (AMC)
NBT Bancorp, Inc. is a holding company, which engages in the provision of financial solutions. It offers commercial banking, retail banking, and wealth management, as well as trust and investment services. The company was founded in 1986 and is headquartered in Norwich, NY.
Predefined Scans Triggered: P&F High Pole and Parabolic SAR Buy Signals.
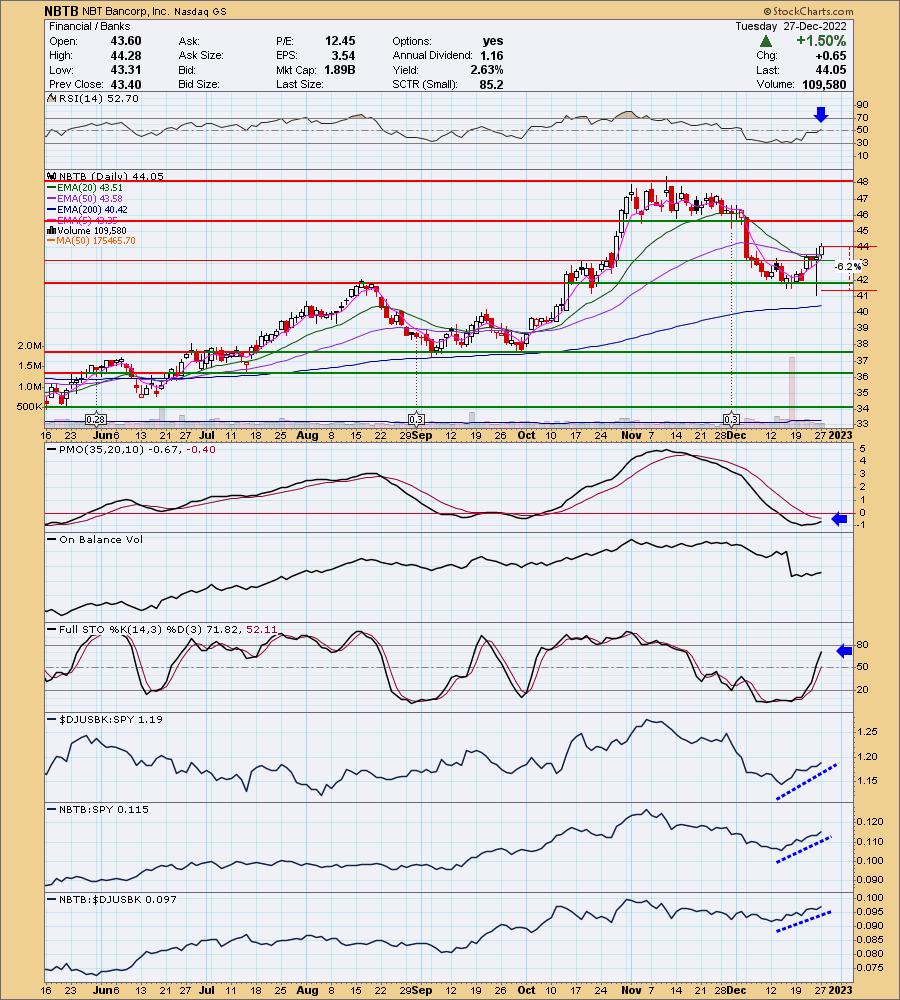
Here are the commentary and chart from Tuesday:
"NBTB is unchanged in after hours trading. I like the cup shaped bottom and today's breakout above the 20/50-day EMAs. Price is nearing a "Silver Cross" of the 20/50-day EMAs which would trigger an IT Trend Model BUY signal. The RSI is positive and the PMO is headed for an oversold crossover BUY signal. Stochastics are nearing 80. Relative strength is bullish against the group and the SPY. The group looks pretty good too. The stop is set at 6.2% or $41.31."
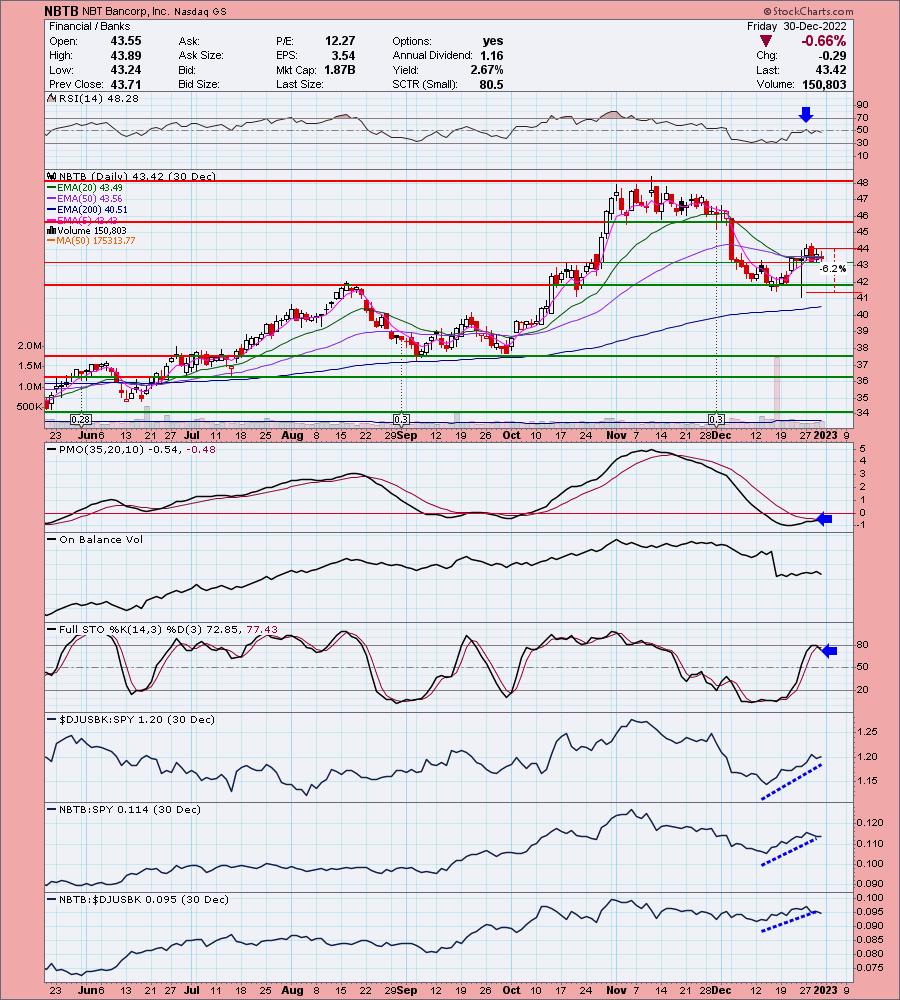
Here is today's chart:
As with last week's "Dud", I don't really see this as a bearish chart. Progressive Insurance (PGR) is far more bearish given it was picked Thursday and turned south on Friday. The RSI is negative and Stochastics falling, but the PMO and price is holding multiple layers of support at the key moving averages and mid-October top. This tells me this is a hold, not a buy.
THIS WEEK's Sector Performance:

DecisionPoint Sector Scoreboard (Mechanical Trend Model Signals):

Click Here to view Carl's annotated Sector ChartList!
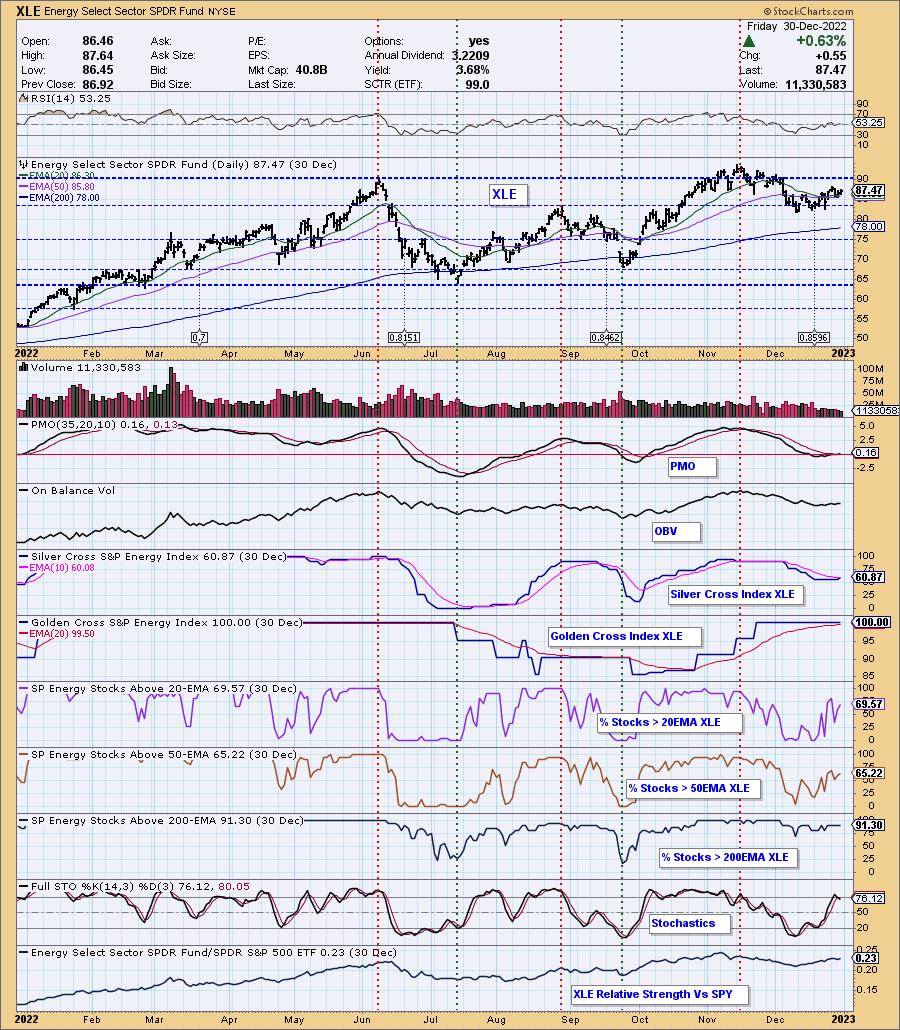
Sector to Watch: Energy (XLE)
This is the "Sector to Watch" again this week, but Communications Services (XLC) was in a close second. The problem with XLC is not a well established rally. It seems just a bit too early if you have a more conservative approach to trading. The RSI is positive and the PMO just triggered a crossover BUY signal. All of the stocks within are in bull markets, meaning their 50-day EMA is above their 200-day EMA, suggesting a bullish bias in the long term. Participation is expanding but isn't overbought; there are more stocks that can begin participating and raise the sector higher.
Industry Group to Watch: Oil & Gas Equipment Services (XES)
Yes, this is a repeat chart, but still worth another look. I do not think it is too late to get involved in this group. I'm eyeing this ETF for my portfolio next week (among others). In the Diamond Mine trading room we mined a few stock symbols to consider: NINE, KLXE and HAL.
Go to our Sector ChartList on DecisionPoint.com to get an in-depth view of all the sectors. On StockCharts.com you can find the Industry Summary.
Merry Christmas!
Good Luck & Good Trading!
- Erin
erin@decisionpoint.com
Full Disclosure: I'm 12% exposed with a 2% hedge. May add XES.
Watch the latest episode of theDecisionPoint Trading Room with Carl & Erin Swenlin on Mondays 3:00p EST!
Technical Analysis is a windsock, not a crystal ball. --Carl Swenlin
NOTE: The stocks reported herein are from mechanical trading model scans that are based upon moving average relationships, momentum and volume. DecisionPoint analysis is then applied to get five selections from the scans. The selections given should prompt readers to do a chart review using their own analysis process. This letter is not a call for a specific action to buy, sell or short any of the stocks provided. There are NO sure things or guaranteed returns on the daily selection of "diamonds in the rough."
Helpful DecisionPoint Links:
DecisionPoint Shared ChartList and DecisionPoint Chart Gallery
Price Momentum Oscillator (PMO)
Swenlin Trading Oscillators (STO-B and STO-V)
(c) Copyright 2023 DecisionPoint.com