
It is Reader Request and Mailbag Day! I will cover four requests and list the other requests. They shouldn't be considered "Runner-ups" like I usually include under the "Diamonds in the Rough". It is more informational, to let you know what symbols are on the minds of other subscribers.
Today's Mailbag question:
Is there a page on the site that discusses your views on stops? How do you feel about moving stops?
Answer: I have a video that I did a number of years ago that gives you some idea of how I operate stops. To sum it up, I like to set them just below support at an EMA or price level in the range of 3% to 8%. I've moved away from thin 3% stops mainly because the market is so much more volatile than it has been since 2019. I think moving stops is smart if you want to preserve profit, but only UP, not down! A stop is like a bid on eBay, it is the MOST you feel comfortable losing. If you move your stop lower, you're just sinking more money into a losing position. Below is the video I did. You'll find all of my workshops on the Blogs and Links page on the lefthand side under FREE.
Don't forget to sign up for tomorrow's Diamond Mine trading room! The registration link is below, as well as the recording of last week's trading room.
Good Luck & Good Trading,
Erin
Today's "Diamonds in the Rough": ACM, GE (Short), PRVB and TK.
Other requests: AGCO (short), PFIX, DCPH, FHI, STNG, FL, GILD and BKR.

RECORDING LINK (2/3/2023):
Topic: DecisionPoint Diamond Mine (2/3/2023) LIVE Trading Room
Passcode: February#3
REGISTRATION for 2/10/2023:
When: Feb 10, 2023 09:00 AM Pacific Time (US and Canada)
Topic: DecisionPoint Diamond Mine (2/10/2023) LIVE Trading Room
Register in advance for this webinar HERE
After registering, you will receive a confirmation email containing information about joining the webinar.

Here is the last recording (2/6):
Welcome to DecisionPoint Diamonds, wherein I highlight ten "Diamonds in the Rough" per week. These are selected from the results of my DecisionPoint Scans which search for stocks that could benefit from the trend and condition of the market. Remember, these are not recommendations to buy or sell, but are the most interesting of the stocks that surfaced in my scans. My objective is to save you the work of the initial, tedious culling process, but you need to apply your own analysis to see if these stocks pique your interest as well. There are no guaranteed winners here!
"Predefined Scans Triggered" are taken from StockCharts.com using the "Symbol Summary" option instead of a "SharpChart" on the workbench.
Stop levels are all rounded down.
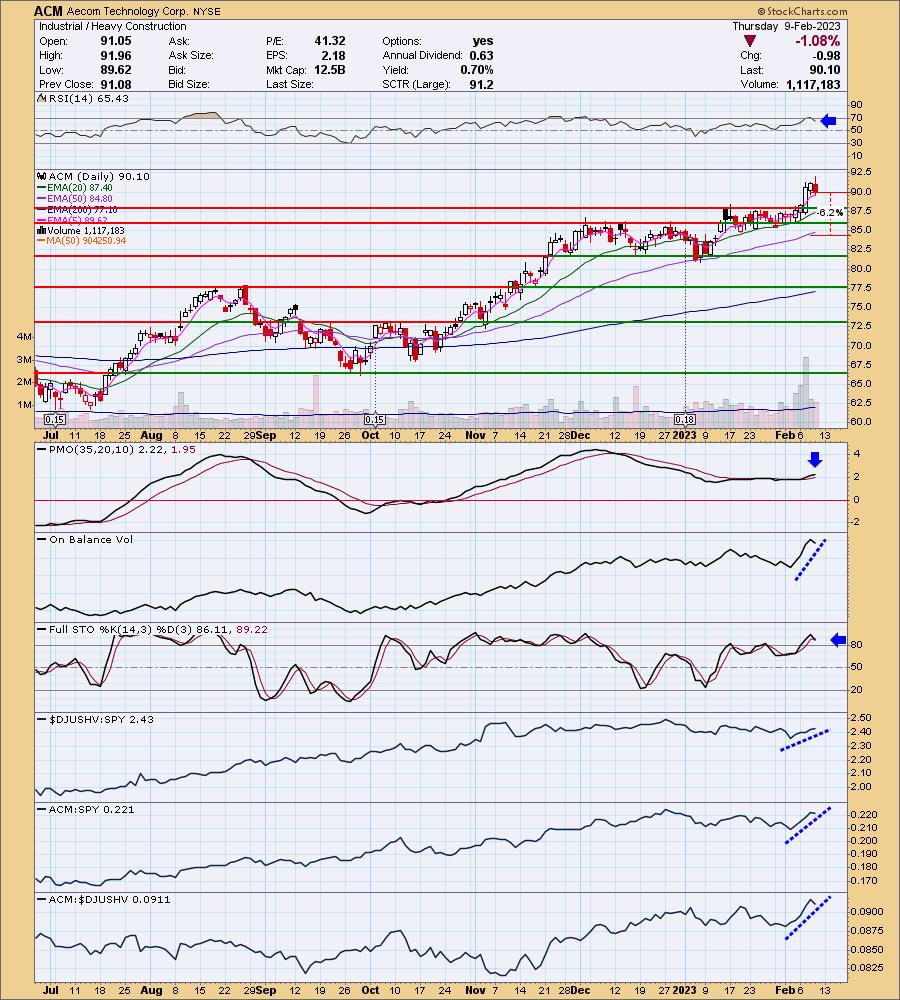
Aecom Technology Corp. (ACM)
EARNINGS: 05/08/2023 (AMC)
AECOM engages in the design, manufacture, financing, and operation of infrastructure assets for governments, businesses and organizations. It operates through the following segments: Americas, International, and AECOM Capital. The Americas segment deals with planning, consulting, architectural and engineering design and construction management services to commercial and government clients in the United States, Canada and Latin America in major end markets such as transportation, water, government, facilities, environmental and energy. The International segment focuses on planning, consulting, architectural and engineering design services to commercial and government clients in Europe, the Middle East, Africa and the Asia-Pacific regions in major end markets such as transportation, water, government, facilities, environmental and energy. The AECOM Capital segment includes investing in real estate, public-private partnership and infrastructure projects. The company was founded on January 31, 1980 and is headquartered in Dallas, TX.
Predefined Scans Triggered: Elder Bar Turned Blue, New 52-week Highs and P&F Double Top Breakout.
ACM is down -4.89% in after hours trading. That decline after hours was a surprise, but it could indicate the breakout needs to be digested. As long as support holds at the mid-January lows, I think it is still viable. I believe the stop level incorporates that thinking. The RSI is positive and today's decline brought it out of overbought territory. The PMO looks excellent as it increases the margin to the signal line. The OBV is behind the move and Stochastics remain above 80. Relative strength for the group is improving and this one is a leader within the group. The stop is set at 6.2% around $84.51.
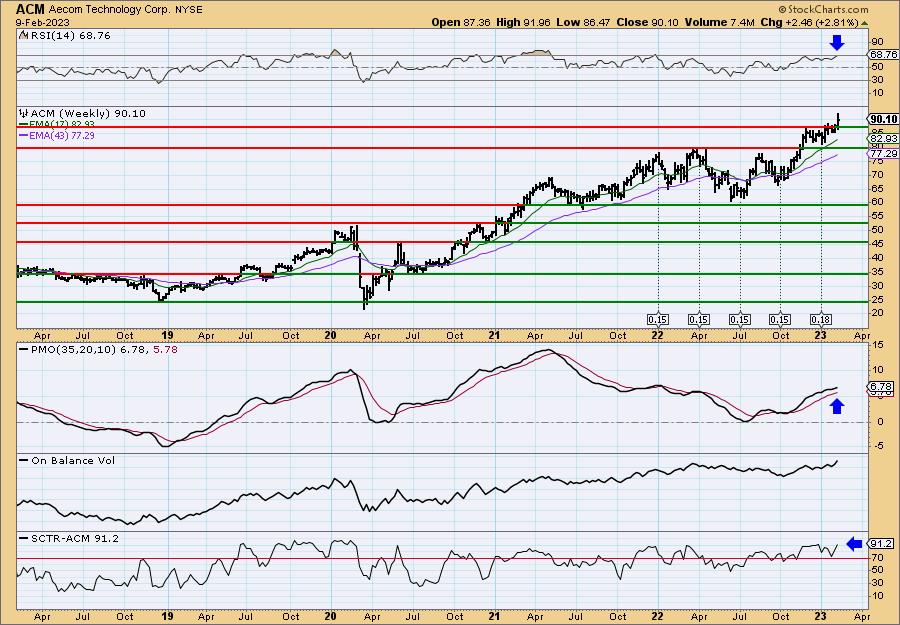
I think the breakout to new all-time highs looks excellent. The weekly RSI is positive and not yet overbought. The weekly PMO is accelerating its ascent. The StockCharts Technical Rank (SCTR) is excellent in the "hot zone" above 70% at a high 91.2%. We call it the "hot zone" because it implies that the stock/ETF is in the top 30% of its "universe" (large-, mid-, small-caps and ETFs) as far as trend and condition, particularly in the intermediate and long terms. Since it is already at all-time highs, consider an upside target of about 15% or $103.62.
General Electric Co. (GE) - SHORT
EARNINGS: 04/25/2023 (BMO)
General Electric Co. is a high-tech industrial company. the firm operates through the following segments: Aviation, Healthcare, Renewable Energy, and Power. The Aviation segment designs and produces commercial and military aircraft engines, integrated engine components, electric power and mechanical aircraft systems. It also provides aftermarket services to support its products. The Healthcare segment provides essential healthcare technologies to developed and emerging markets and has expertise in medical imaging, digital solutions, patient monitoring and diagnostics, drug discovery and performance improvement solutions. Its products and services are sold worldwide primarily to hospitals and medical facilities. The Renewable Energy segments portfolio of business units includes onshore and offshore wind, blade manufacturing, grid solutions, hydro, storage, hybrid renewables and digital services offerings. The Power segment serves power generation, industrial, government and other customers worldwide with products and services related to energy production. Its products and technologies harness resources such as oil, gas, fossil, diesel and nuclear to produce electric power and include gas and steam turbines, full balance of plant, upgrade and service solutions, as well as data-leveraging software. The company was founded by Thomas Alva Edison in 1878 and is headquartered in Boston, MA.
Predefined Scans Triggered: Elder Bar Turned Red.
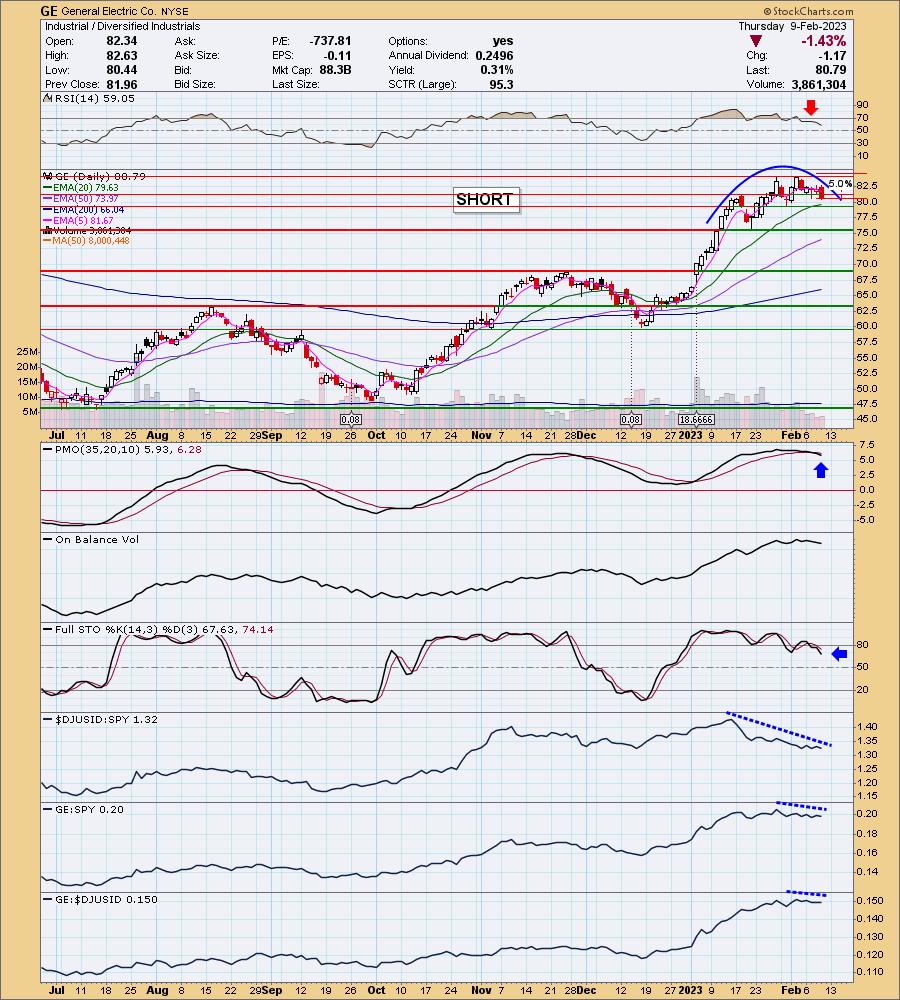
GE is up +0.01% in after hours trading. Our timing was good given we brought this to the table on January 3rd. Now it is creating a bearish rounded top. The RSI is still positive, but it is on its way down. The PMO triggered a crossover SELL signal this week and Stochastics have dropped below 80. The group is struggling and GE is struggling against the group and the SPY. Since this is a short, we set the stop to the upside. I've set it at 5% around $84.83.
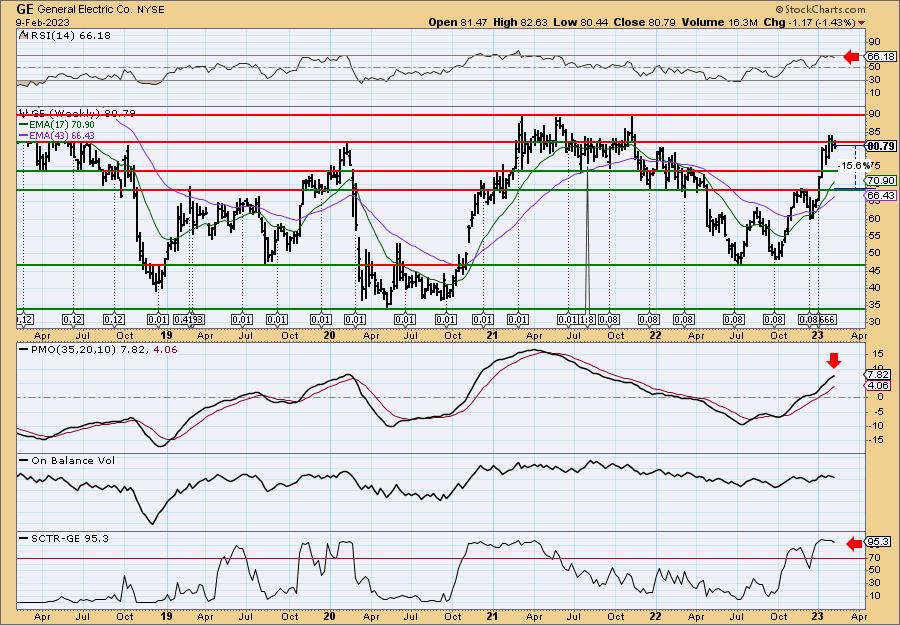
The weekly chart hasn't started to break down yet. It actually looks bullish. I usually consider shorts as near-term positions, but this clarifies that it definitely should be considered short and not long-term. I think a good downside target would offer a 15.6% profit.
Provention Bio, Inc. (PRVB)
EARNINGS: 02/23/2023 (BMO)
Provention Bio, Inc. is a clinical-stage biopharmaceutical company, which engages in the development and commercialization of novel therapeutics and solutions. Its products include PRV-031 for the interception of type 1 diabetes (T1D), PRV-015 for the treatment of gluten-free diet non-responding celiac disease, PRV-6527 for Crohn's disease, PRV-3279 for the treatment of lupus, and PRV-101 for the prevention of acute coxsackie virus B (CVB), and the prevention of type 1 diabetes (T1D) onset. The company was founded by Francisco Leon and Ashleigh Palmer on October 4, 2016 and is headquartered in Red Bank, NJ.
Predefined Scans Triggered: Shooting Star.
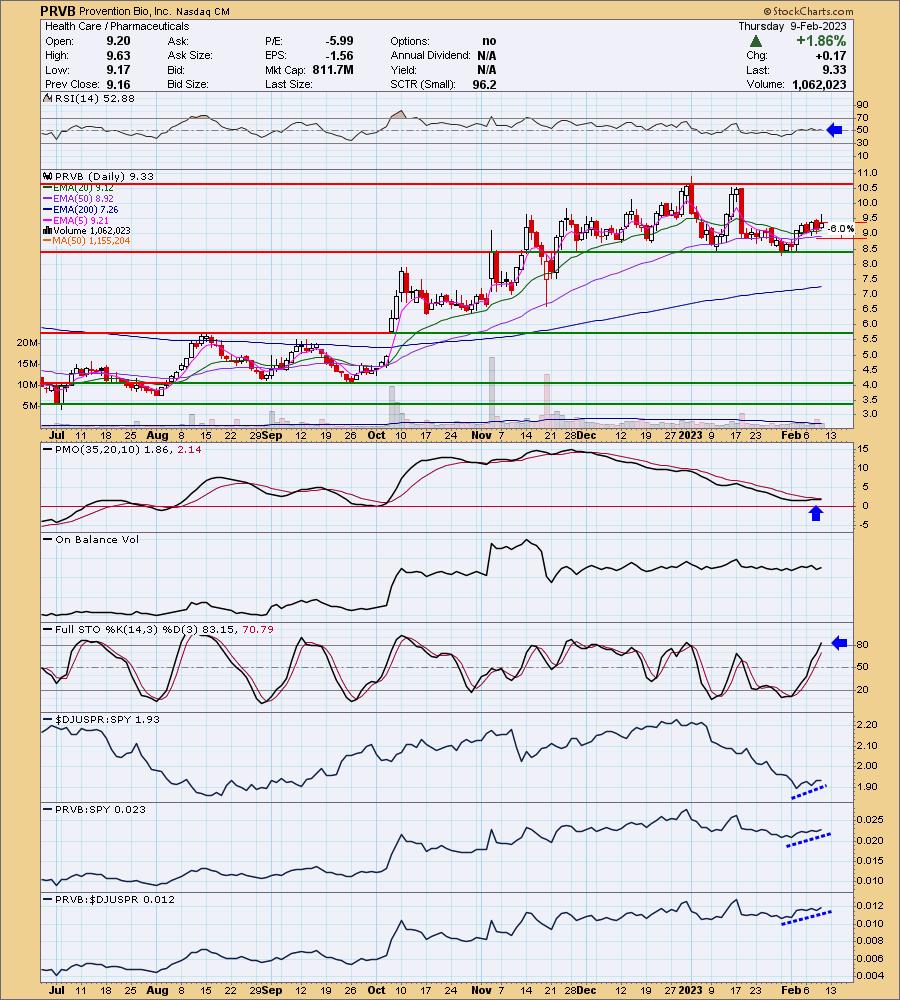
PRVB is up +3.43% in after hours trading. Generally, shooting star candlesticks are bearish. It's similar to a filled black candlestick in that it implies bears had a hand in bringing price well below the intraday high. I don't see this as a problem and based on after hours trading, it shouldn't be. This chart is just getting ripe; it's still early though. The RSI is positive, but has been hugging net neutral (50) this week and last. The PMO is ready to trigger a crossover BUY signal. Stochastics have just risen above 80. Relative strength is improving for this group. Relative strength is positive. The stop is set below the 50-day EMA around 6% or $8.77.
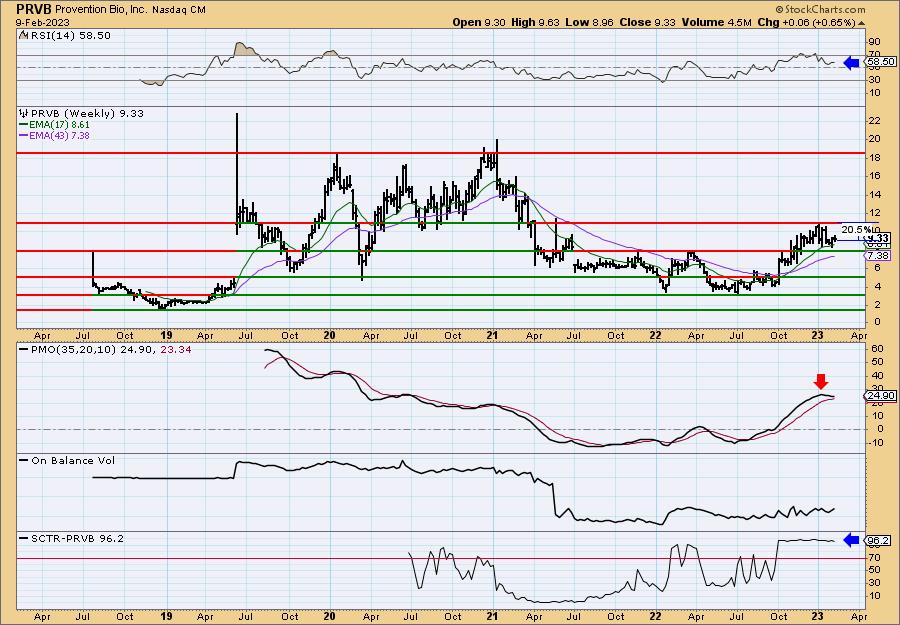
The weekly chart is mixed. The weekly RSI is positive, but the weekly PMO is not. The SCTR is very strong and the OBV is trending higher. If price can reach overhead resistance, it would be an over 20% profit.
Teekay Corp. (TK)
EARNINGS: 02/23/2023 (BMO)
Teekay Corp. provides international crude oil and other marine transportation services. Its lines of business include offshore production (FPSO units) and conventional tankers. The firm operates through the following segments: Teekay Parent and Teekay Tankers. The Teekay Parent owns floating production, storage, and offloading (FPSO) units and a minority investment in Tanker Investments Ltd. The Teekay Tankers segment offers conventional crude oil tankers and product carriers. The company was founded by Jens Torben Karlshoej in 1973 and is headquartered in Hamilton, Bermuda.
Predefined Scans Triggered: Elder Bar Turned Green, New 52-week Highs, Moved Above Upper Price Channel, P&F Double Top Breakout and P&F Triple Top Breakout.
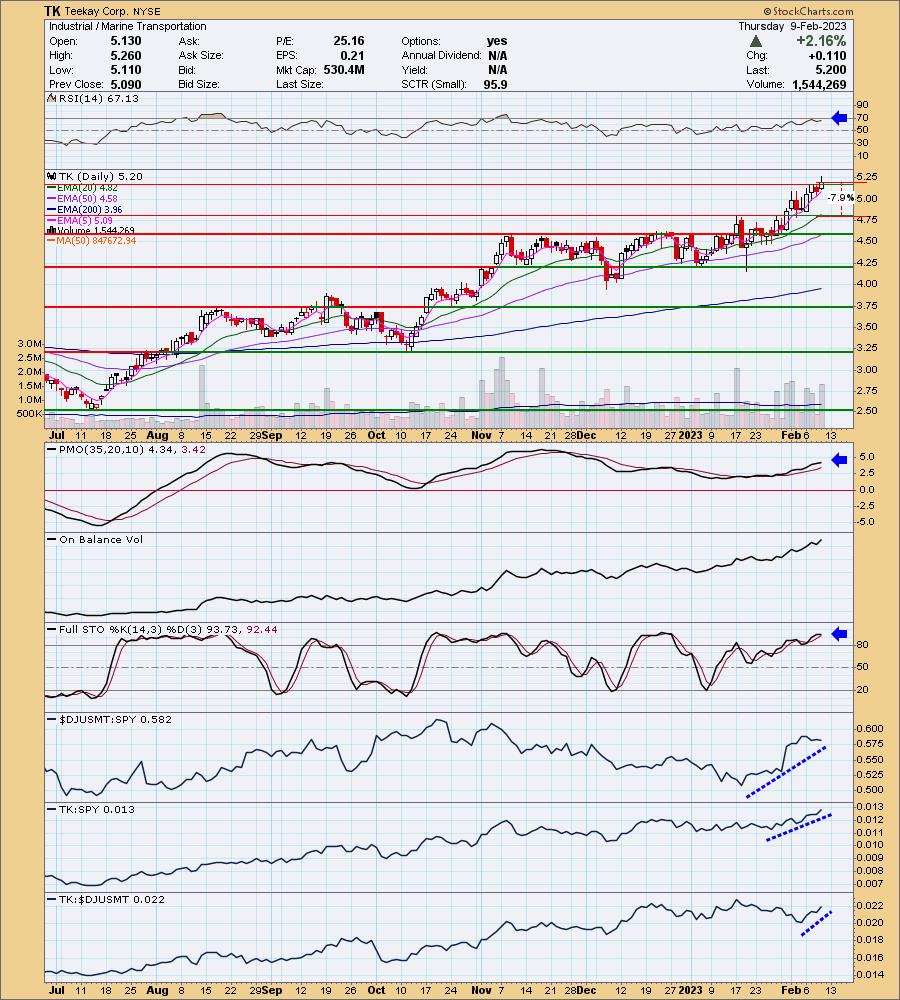
TK is up +3.46% in after hours trading. This group overall has been outperforming. You'll note that STNG was requested and is in the same industry group. The rising trend is holding and price is setting new 52-week highs. Log this under "winners keep on winning". The RSI is positive and not yet overbought. The PMO is rising on a BUY signal and isn't overbought. Stochastics are oscillating above 80 and the OBV is rising to confirm this rally. I've set the stop rather deep, but it lines up with support around 7.9% or $4.78.
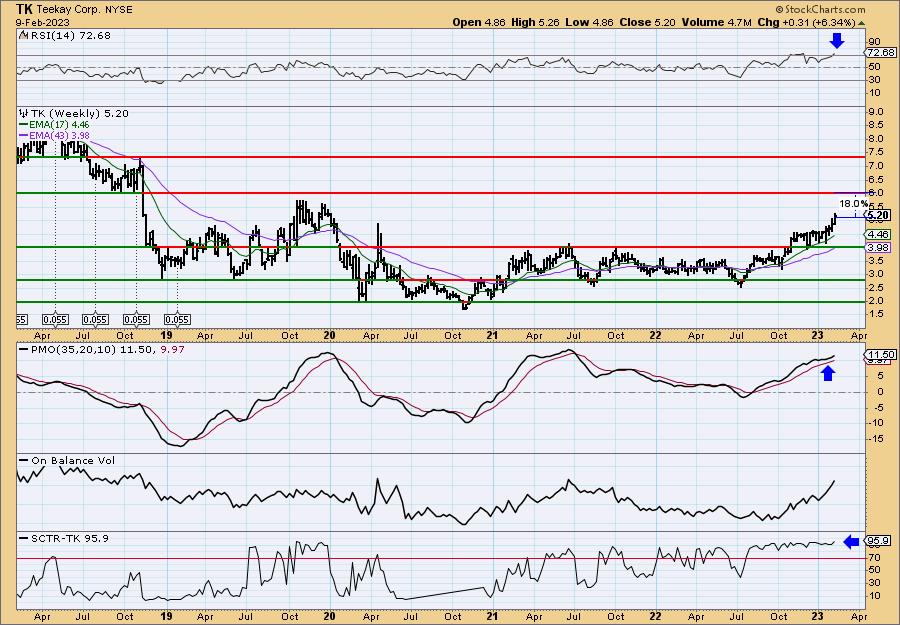
The weekly chart looks good, although the weekly RSI is a bit on the overbought side. The weekly PMO is overbought too, but it is beginning to accelerate higher. The SCTR is top-notch at 95.9%. This could be considered an intermediate-term trade.
Don't forget, on Thursdays I look at reader-requested symbols, click HERE to send me an email. I read every email I receive and try to answer them all!
Current Market Outlook:
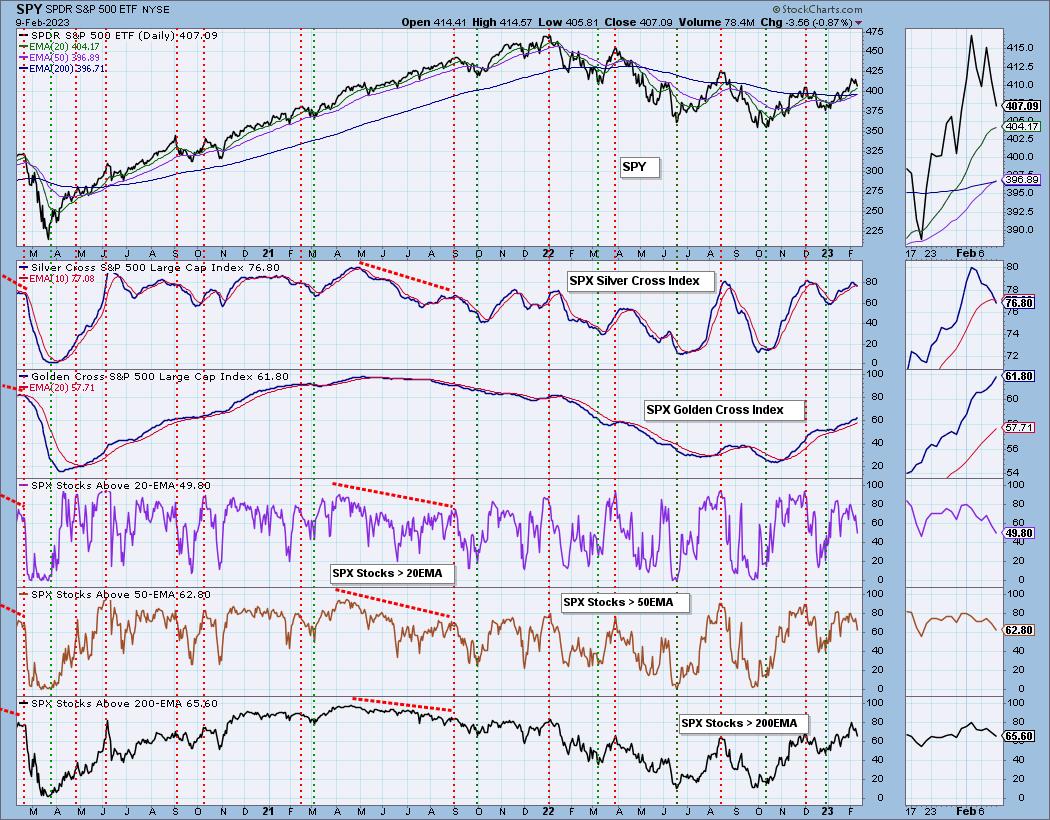
Market Environment: It is important to consider the odds for success by assessing the market tides. The following chart uses different methodologies for objectively showing the depth and trend of participation for intermediate- and long-term time frames.
- The Silver Cross Index (SCI) shows the percentage of SPX stocks on IT Trend Model BUY signals (20-EMA > 50-EMA)
- The Golden Cross Index (GCI) shows the percentage of SPX stocks on LT Trend Model BUY signals (50-EMA > 200-EMA)
Don't forget that as a "Diamonds" member, you have access to our GCI/SCI curated ChartList on DecisionPoint.com. You'll find it under "Members Only" links on the left side on the Blogs and Links Page.
Here is the current chart:
Full Disclosure: I am 20% exposed. GE short is on my radar.
I'm required to disclose if I currently own a stock I mention and/or may buy/short it within the next 72 hours.
"Technical Analysis is a windsock, not a crystal ball." - Carl Swenlin
(c) Copyright 2023 DecisionPoint.com
Watch the latest episode of DecisionPoint Trading Room with Carl & Erin Swenlin on Mondays 7:00p EST or on the DecisionPoint playlist on the StockCharts TV YouTube channel here!
NOTE: The stocks reported herein are from mechanical trading model scans that are based upon moving average relationships, momentum and volume. DecisionPoint analysis is then applied to get five selections from the scans. The selections given should prompt readers to do a chart review using their own analysis process. This letter is not a call for a specific action to buy, sell or short any of the stocks provided. There are NO sure things or guaranteed returns on the daily selection of "Diamonds in the Rough."
Regarding BUY/SELL Signals: The signal status reported herein is based upon mechanical trading model signals and crossovers. They define the implied bias of the price index/stock based upon moving average relationships and momentum, but they do not necessarily call for a specific action. They are information flags that should prompt chart review. Further, they do not call for continuous buying or selling during the life of the signal. For example, a BUY signal will probably (but not necessarily) return the best results if action is taken soon after the signal is generated. Additional opportunities for buying may be found as price zigzags higher, but the trader must look for optimum entry points. Conversely, exit points to preserve gains (or minimize losses) may be evident before the model mechanically closes the signal.
Helpful DecisionPoint Links:
DecisionPoint Shared ChartList and DecisionPoint Chart Gallery
Price Momentum Oscillator (PMO)
Swenlin Trading Oscillators (STO-B and STO-V)
For more links, go to DecisionPoint.com