
There weren't too many requests today so I decided to run my Diamond scans to find a good chart to add. I found what I thought was a great looking chart and then I dove into the requests that came in. Funny thing, the stock I picked came from the same industry group as one of our requests and to be honest, I think his chart might be a bit stronger as the stock has a more bullish bias. We will playing "This or That" on these two stocks. The industry group is Home Builders.
On Reader Request Day if you submit a stock and I don't select it, I will give you brief input via email. If you've given me more than one stock, I won't be able to give you my opinion on each, but more than likely one of them will be selected.
No mailbag today. Remember you can send your questions as well as symbol requests! Also, don't forget to sign up for the Diamond Mine Trading Room! The link is below. Based on a suggestion from a subscriber, for those who can't attend live, I will send out the recording as soon as it is available so you don't have to wait until the end of day.
Good Luck & Good Trading,
Erin
Today's "Diamonds in the Rough": LEN, LGIH, NRIX and TAK.
Other requests: CANO, JEPQ, QYLD, AMD and GWRE.

RECORDING LINK (3/10/2023):
Topic: DecisionPoint Diamond Mine (3/10/2023) LIVE Trading Room
Passcode: March@10th
REGISTRATION for 3/17/2023:
When: Mar 17, 2023 09:00 AM Pacific Time (US and Canada)
Topic: DecisionPoint Diamond Mine (3/17/2023) LIVE Trading Room
Register in advance for this webinar HERE
After registering, you will receive a confirmation email containing information about joining the webinar.

Here is the last recording (3/13):
Welcome to DecisionPoint Diamonds, wherein I highlight ten "Diamonds in the Rough" per week. These are selected from the results of my DecisionPoint Scans which search for stocks that could benefit from the trend and condition of the market. Remember, these are not recommendations to buy or sell, but are the most interesting of the stocks that surfaced in my scans. My objective is to save you the work of the initial, tedious culling process, but you need to apply your own analysis to see if these stocks pique your interest as well. There are no guaranteed winners here!
"Predefined Scans Triggered" are taken from StockCharts.com using the "Symbol Summary" option instead of a "SharpChart" on the workbench.
Stop levels are all rounded down.
Lennar Corp. (LEN)
EARNINGS: 06/20/2023 (AMC)
Lennar Corp. engages in the provision of real estate related financial and investment management services. It operates through the following segments: Homebuilding East, Central, Texas, and West, Financial Services, Multifamily, and Lennar Other. The Homebuilding East, Central, Texas, and West segment constructs and sells homes primarily for first-time, move-up, and active adult homebuyers primarily under the Lennar brand name. In addition, the company's homebuilding operations purchase, develop, and sell land to third parties. The Financial Services segment focuses on mortgage financing, title, and closing services for buyers. The Multifamily segment is involved in the development, construction, and property management of multifamily rental properties. The Lennar Other segment includes strategic investments in technology companies. The company was founded in 1954 and is headquartered in Miami, FL.
Predefined Scans Triggered: Moved Above Upper Bollinger Band, Moved Above Ichimoku Cloud and P&F Double Top Breakout.
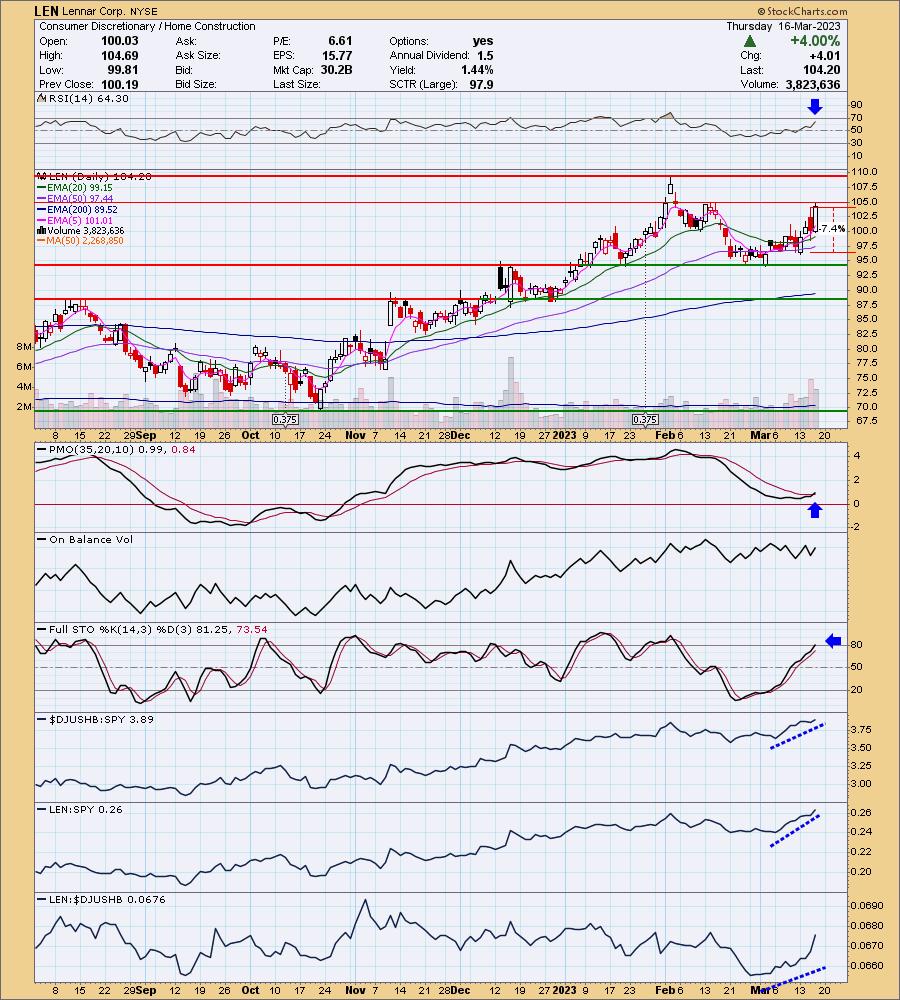
LEN is down -0.41% in after hours trading. This is the stronger of the two home builder stocks. The PMO has remained above the zero line and just triggered a crossover BUY signal. The RSI is positive and price is about to hit new 52-week highs and based on the weekly chart, a new all-time high isn't far away. Stochastics popped above 80. Relative strength of LEN to the group is excellent and still increasing. Today saw a big bullish engulfing candlestick. Overhead resistance could be a struggle only because it is a resistance zone versus just one single line of resistance. With indicators looking as they do, I suspect it won't have much trouble getting through it though. The stop is set at 7.4% around $96.48.
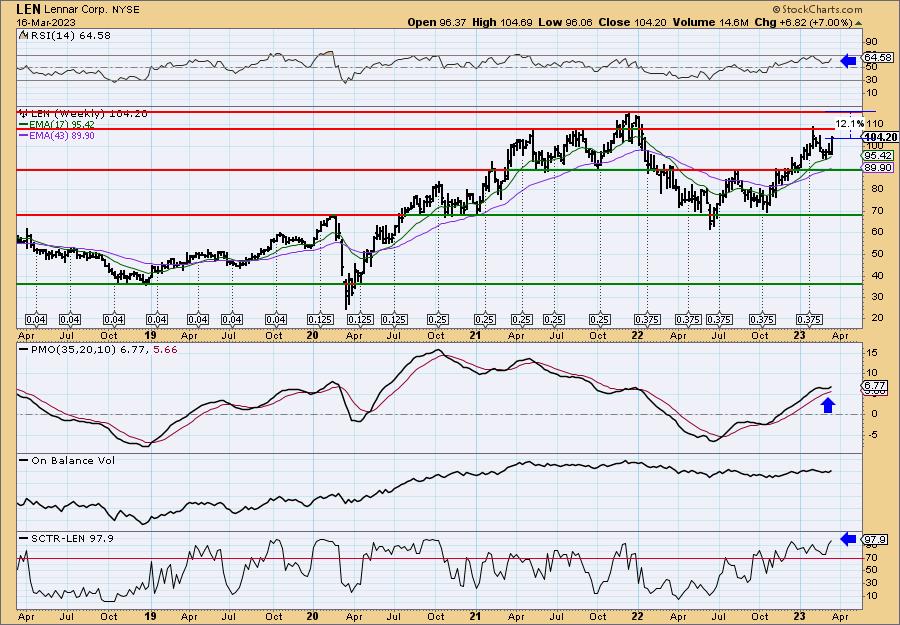
The resistance zone continues with overhead resistance also at new all-time highs. The weekly indicators look excellent so this one could be considered a more intermediate-term investment. The weekly RSI is positive and not overbought. The weekly PMO has bottomed above its signal line which is especially bullish. The StockCharts Technical Rank (SCTR) is at the top of the "hot zone"* above 70. If it reaches all-time highs, it would be a 12.1% gain, but I would look for at least a 17% gain up to around $121.91.
*We call it the "hot zone" because it implies that the stock/ETF is in the top 30% of its "universe" (large-, mid-, small-caps and ETFs) as far as trend and condition, particularly in the intermediate and long terms.
LGI Homes, Inc. (LGIH)
EARNINGS: 05/09/2023 (BMO)
LGI Homes, Inc. engages in the design, construction, marketing, and sale of new homes. It focuses on the residential land development business. It operates through the following segments: Central, West, Southeast, Florida, Midwest, Mid-Atlantic, and Northwest. The company was founded by Eric Thomas Lipar in 2003 and is headquartered in The Woodlands, TX.
Predefined Scans Triggered: Bullish MACD Crossovers and Parabolic SAR Buy Signals.
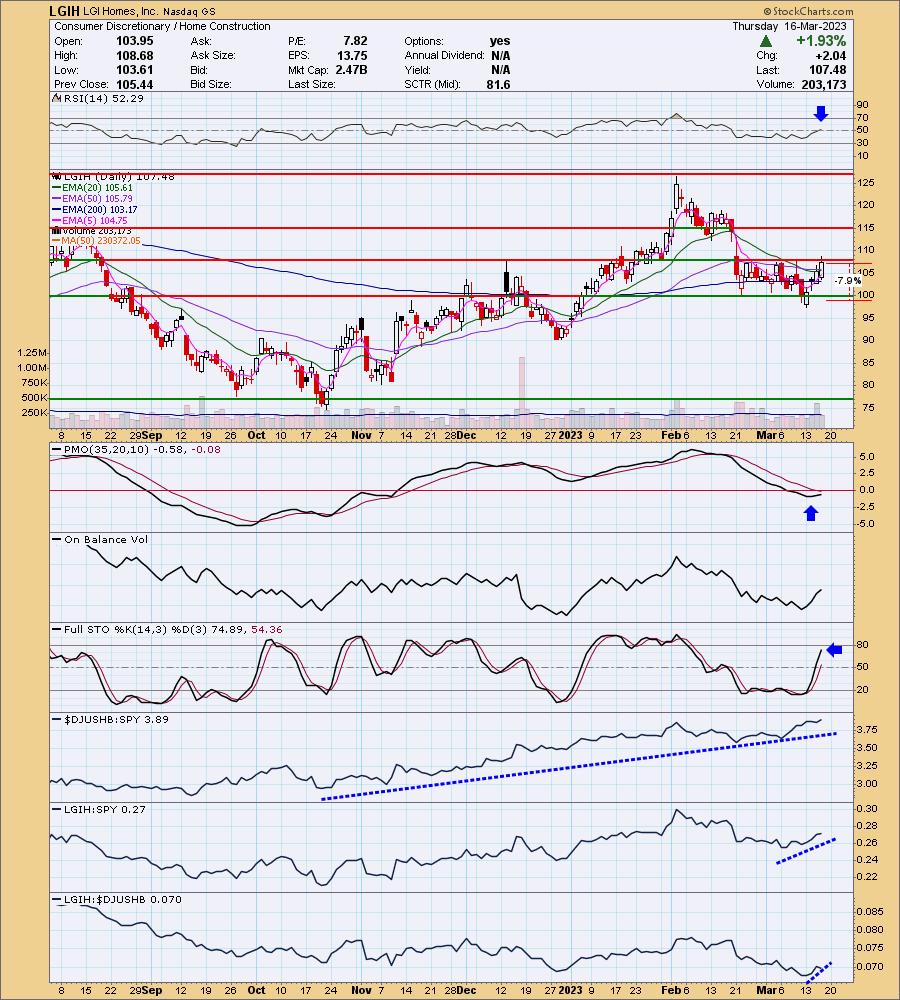
LGIH is down -1.75% in after hours trading (which is more than LEN). One of the main reasons I selected this one from my scans was upside potential because it was beat down after earnings. It is up against overhead resistance right now, but indicators are getting bullish. The RSI is now in positive territory and the PMO has turned up just under the zero line (LEN's PMO was above the zero line). Stochastics are rising strongly. Obviously this one very much underperformed the group during its decline, but it is beginning to show relative strength against the group. LEN has been a leader within the group. The stop is set below support at $100 around 7.9% or $98.98.
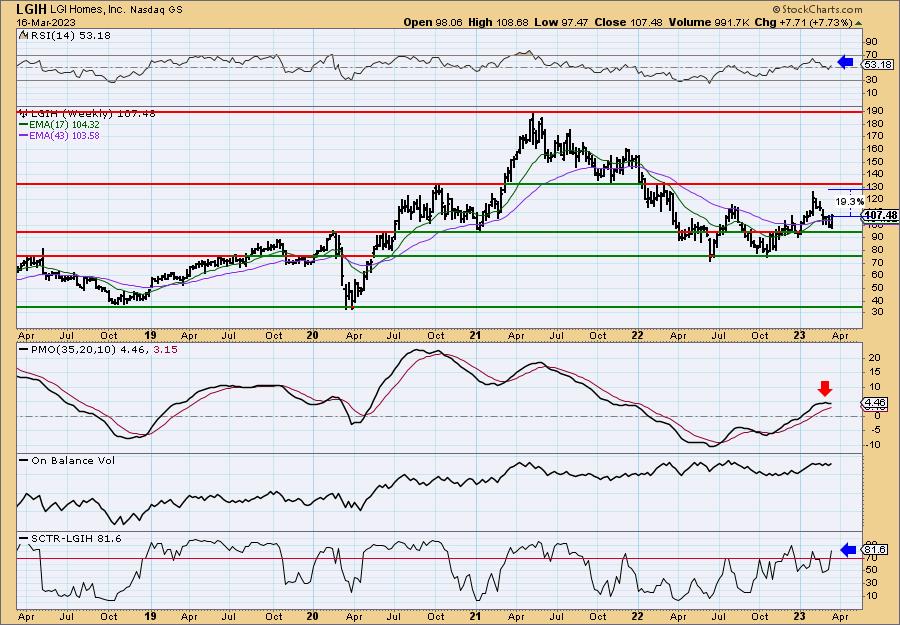
This is what made LGIH so appealing as a reversal candidate...not the indicators, but upside potential if it can catch back up to its group. The weekly RSI is good, but the weekly PMO is suspect. It does appear it may be decelerating its decline which is good. The SCTR is in the "hot zone" and healthy at 81.6%. Upside potential if it reaches the 2023 high is over 19%. So I would say that LEN wins the "This or That" contest, but for a beatdown reversal candidate, LGIH doesn't look that bad.
Nurix Therapeutics Inc. (NRIX)
EARNINGS: 04/06/2023 (AMC)
Nurix Therapeutics, Inc. is a biopharmaceutical company. It focuses on the discovery, development and commercialization of oral, small molecule therapies designed to modulate cellular protein levels as a novel treatment approach for cancer and immune disorders. The company was founded by John Kuriyan, Michael Rap, and Arthur Weiss in 2009 and is headquartered in San Francisco, CA.
Predefined Scans Triggered: P&F Descending Triple Bottom Breakdown, Elder Bar Turned Red and P&F Double Bottom Breakout.
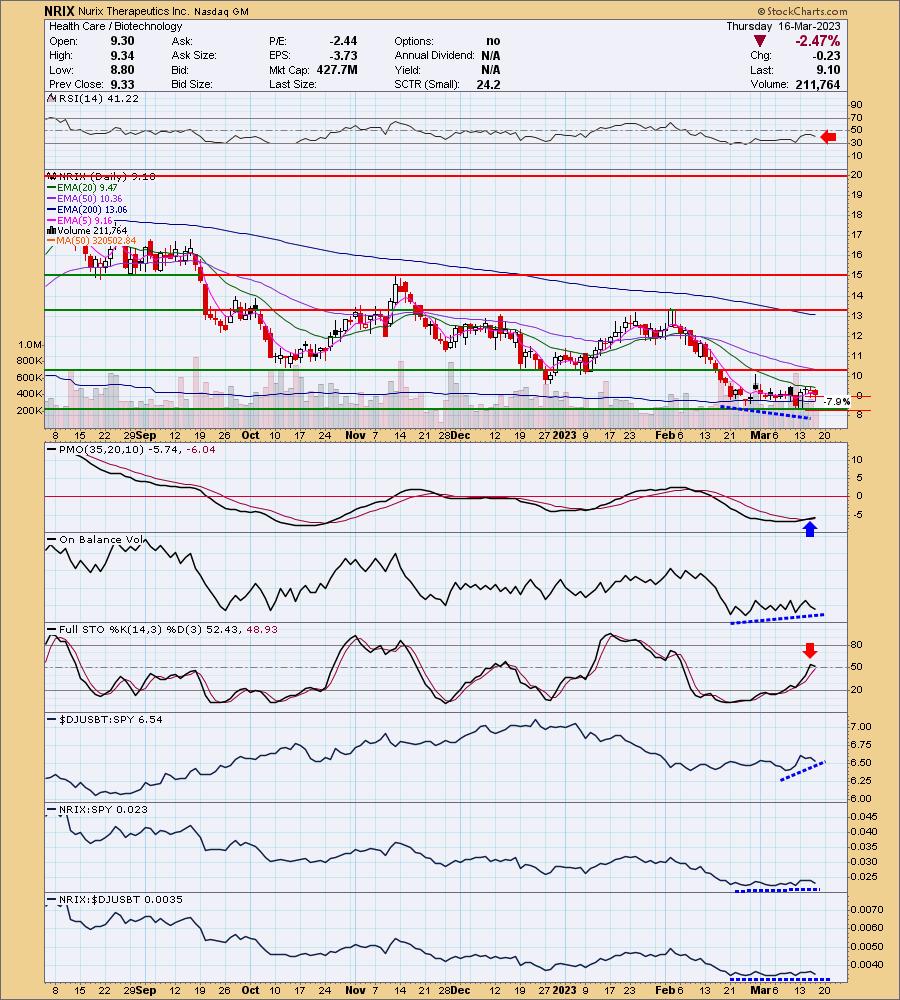
NRIX is unchanged in after hours trading. This is likely the weakest chart today, but I wanted to give this subscriber my thoughts with charts. It isn't bearish necessarily, it just has work to do and keep in mind it is low-priced and therefore volatile so be very careful. The RSI unfortunately is negative due to the trading range it has been stuck in. The PMO has just triggered a crossover BUY signal so momentum could be building under the surface, but there is also a likelihood that the PMO is reverting back to zero because there is no momentum at all. There is a positive OBV divergence, but Stochastics did tick down. This one is performing slightly better than the SPY. Biotechs haven't decided if they want to outperform, but performance is trending a bit higher. Bottom line, be careful with this one; it has bullish characteristics, but also has problems. The stop has to be set deep due to volatility at 7.9% or $8.38.
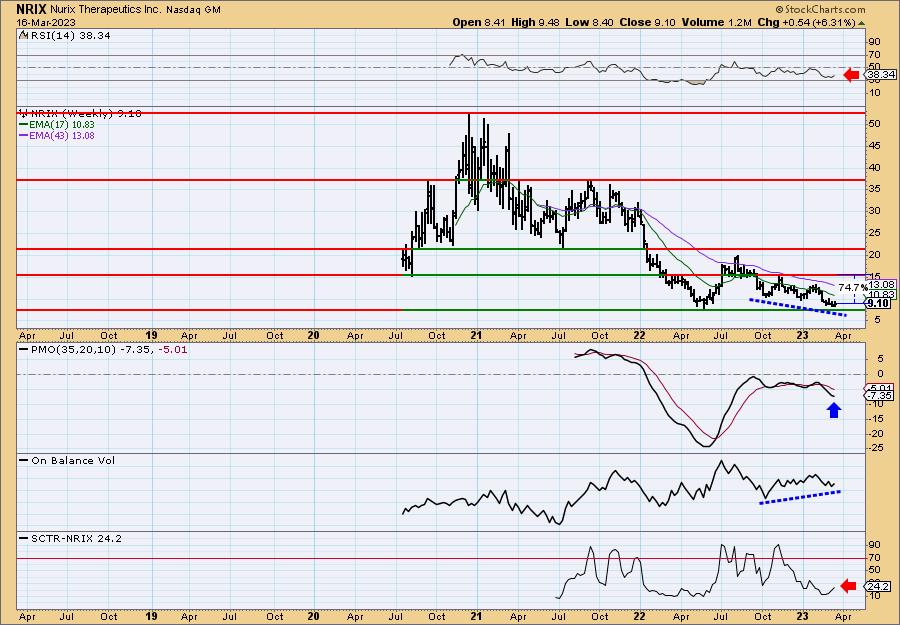
I can see why this subscriber is interested in this one when I see the upside potential available. Biotechs tend to be this way, lots of upside potential, but plenty of downside to have to swallow along the way. It isn't my cup of tea. The weekly RSI is negative, but trying to rise. The weekly PMO is turning up and there is a positive OBV divergence. The SCTR is improving, but is at an anemic 24.2%.
Takeda Pharmaceutical Co. Ltd. (TAK)
EARNINGS: 05/11/2023 (BMO)
Takeda Pharmaceutical Co., Ltd. engages in the research and development, manufacture, import and export sale, and marketing of pharmaceutical drugs. It operates through the following segments: Prescription Drug, Consumer Healthcare, and Other. The Prescription Drugs segment includes the manufacture and sale of pharmaceutical products. The Consumer Healthcare segment includes the manufacture and sale of OTC drugs and quasi-drugs. The Other segment includes manufacture and sale of reagents, clinical diagnostics, and chemical products. The company was founded by Takeda Chobei on June 12, 1781 and is headquartered in Osaka, Japan.
Predefined Scans Triggered: None.
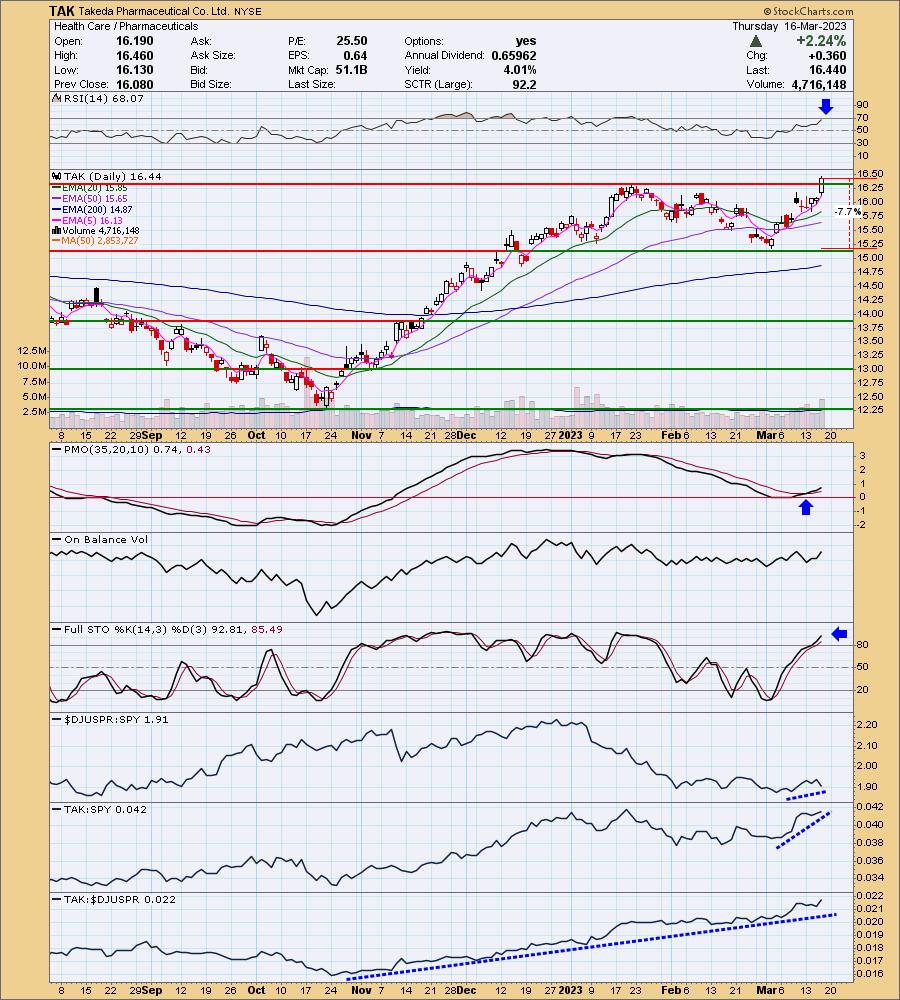
TAK is down -2.13% in after hours trading. I don't like seeing that after hours action, particularly after a strong breakout, but we will see how it all translates tomorrow. The charts are great so I had to present them. The RSI is positive and as noted, there was an excellent breakout today. The PMO has given us a BUY signal just above the zero line and Stochastics are rising strongly above 80. The group is starting to show some outperformance and if it gets going, we should count on TAK to be a leader, notice how strong it has been performing against the group since last November. The stop is set below the March low at 7.7% or $15.17.
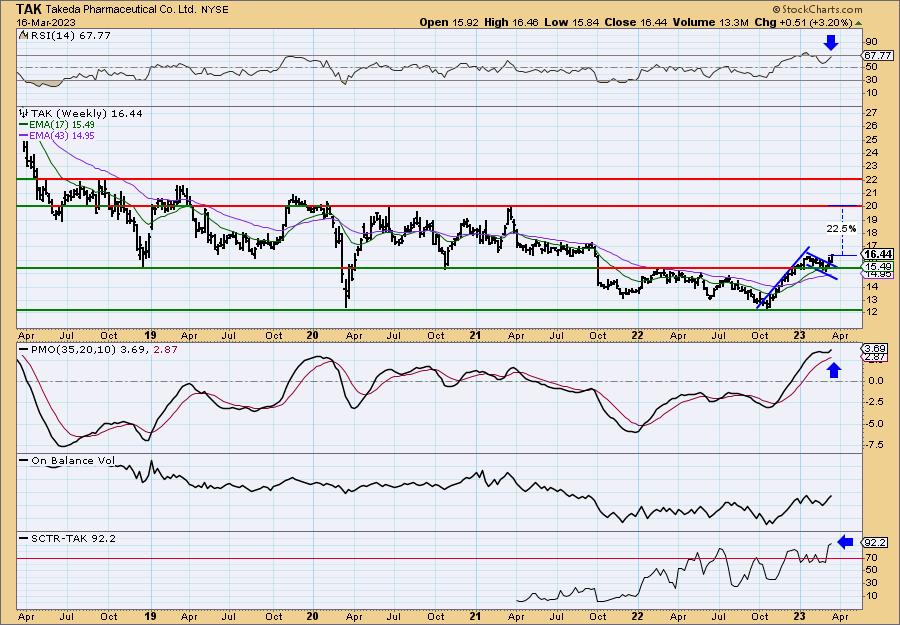
It is somewhat noticeable on the daily chart above, but it dominates the weekly chart. There is a very bullish flag formation and price broke out of it last week. Last week it did close within, but this week it is showing follow-through. The weekly PMO has bottomed above the signal line which is especially bullish in the intermediate term. The SCTR is a very strong 92.2%. Upside potential is about 22.5% should it reach the 2020/2021 highs.
Don't forget, on Thursdays I look at reader-requested symbols, click HERE to send me an email. I read every email I receive and try to answer them all!
Current Market Outlook:
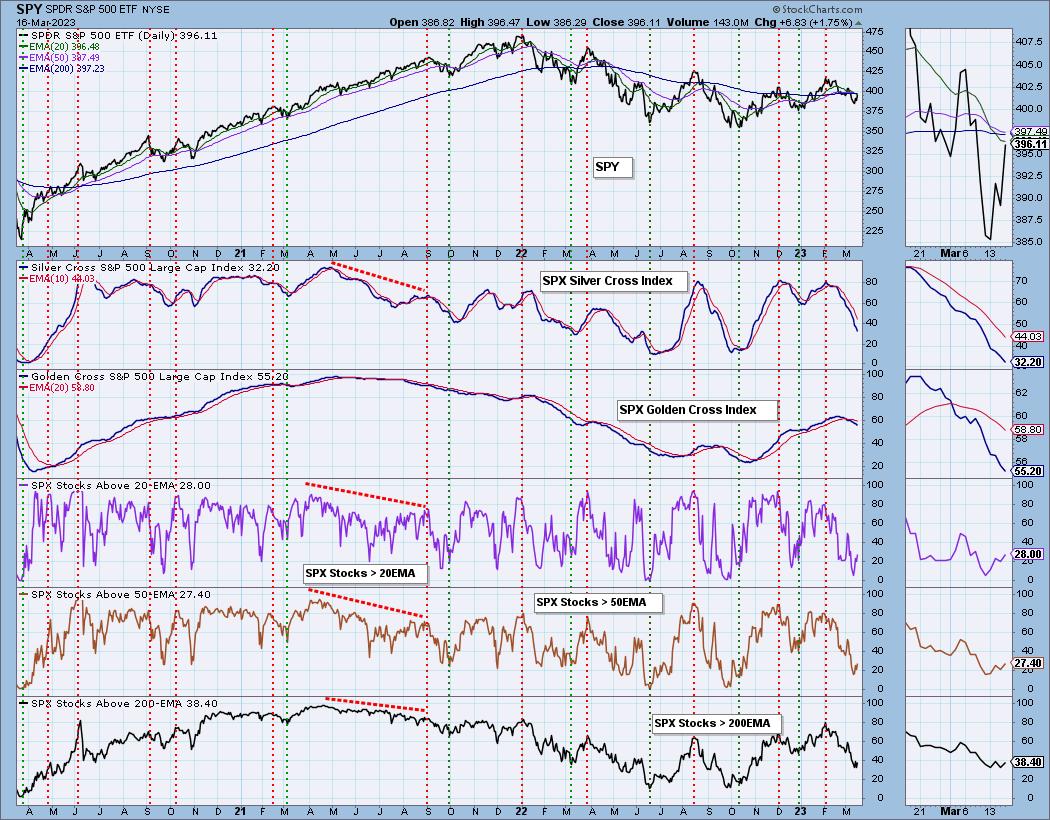
Market Environment: It is important to consider the odds for success by assessing the market tides. The following chart uses different methodologies for objectively showing the depth and trend of participation for intermediate- and long-term time frames.
- The Silver Cross Index (SCI) shows the percentage of SPX stocks on IT Trend Model BUY signals (20-EMA > 50-EMA)
- The Golden Cross Index (GCI) shows the percentage of SPX stocks on LT Trend Model BUY signals (50-EMA > 200-EMA)
Don't forget that as a "Diamonds" member, you have access to our GCI/SCI curated ChartList on DecisionPoint.com. You'll find it under "Members Only" links on the left side on the Blogs and Links Page.
Here is the current chart:
Full Disclosure: I am 13% long, 2% short.
I'm required to disclose if I currently own a stock I mention and/or may buy/short it within the next 72 hours.
"Technical Analysis is a windsock, not a crystal ball." - Carl Swenlin
(c) Copyright 2023 DecisionPoint.com
Watch the latest episode of DecisionPoint Trading Room with Carl & Erin Swenlin on Mondays 7:00p EST or on the DecisionPoint playlist on the StockCharts TV YouTube channel here!
NOTE: The stocks reported herein are from mechanical trading model scans that are based upon moving average relationships, momentum and volume. DecisionPoint analysis is then applied to get five selections from the scans. The selections given should prompt readers to do a chart review using their own analysis process. This letter is not a call for a specific action to buy, sell or short any of the stocks provided. There are NO sure things or guaranteed returns on the daily selection of "Diamonds in the Rough."
Regarding BUY/SELL Signals: The signal status reported herein is based upon mechanical trading model signals and crossovers. They define the implied bias of the price index/stock based upon moving average relationships and momentum, but they do not necessarily call for a specific action. They are information flags that should prompt chart review. Further, they do not call for continuous buying or selling during the life of the signal. For example, a BUY signal will probably (but not necessarily) return the best results if action is taken soon after the signal is generated. Additional opportunities for buying may be found as price zigzags higher, but the trader must look for optimum entry points. Conversely, exit points to preserve gains (or minimize losses) may be evident before the model mechanically closes the signal.
Helpful DecisionPoint Links:
DecisionPoint Shared ChartList and DecisionPoint Chart Gallery
Price Momentum Oscillator (PMO)
Swenlin Trading Oscillators (STO-B and STO-V)
For more links, go to DecisionPoint.com