
Ultimately the SPY finished higher this week, but it was clear that tech in general was one of the driving forces given the Nasdaq and Nasdaq 100 outperformed the SPY by a mile. The SPY finished up +1.44% while $COMPQ finished the week up +4.41%! During today's Diamond Mine trading room I discussed how Financials, particularly Banks had hijacked the market this week with all of the problems with select regional banks and Credit Suisse. The news was just beginning to blow over regarding SVB and Silvergate when fresh new problems surfaced on Wednesday with Credit Suisse and First Republic Bank. The big guys like Wells Fargo and Chase are bailing out banks that are struggling, but that is only a small bandaid. We expect this to be a contagion.
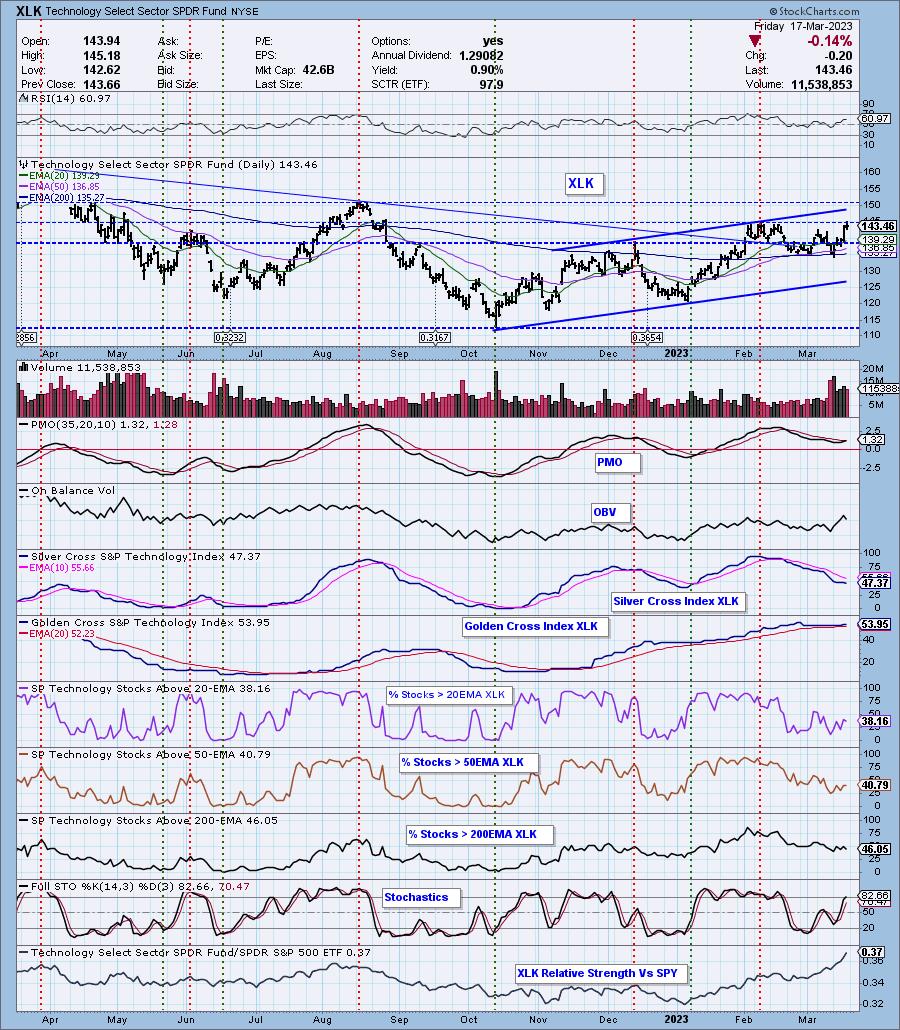
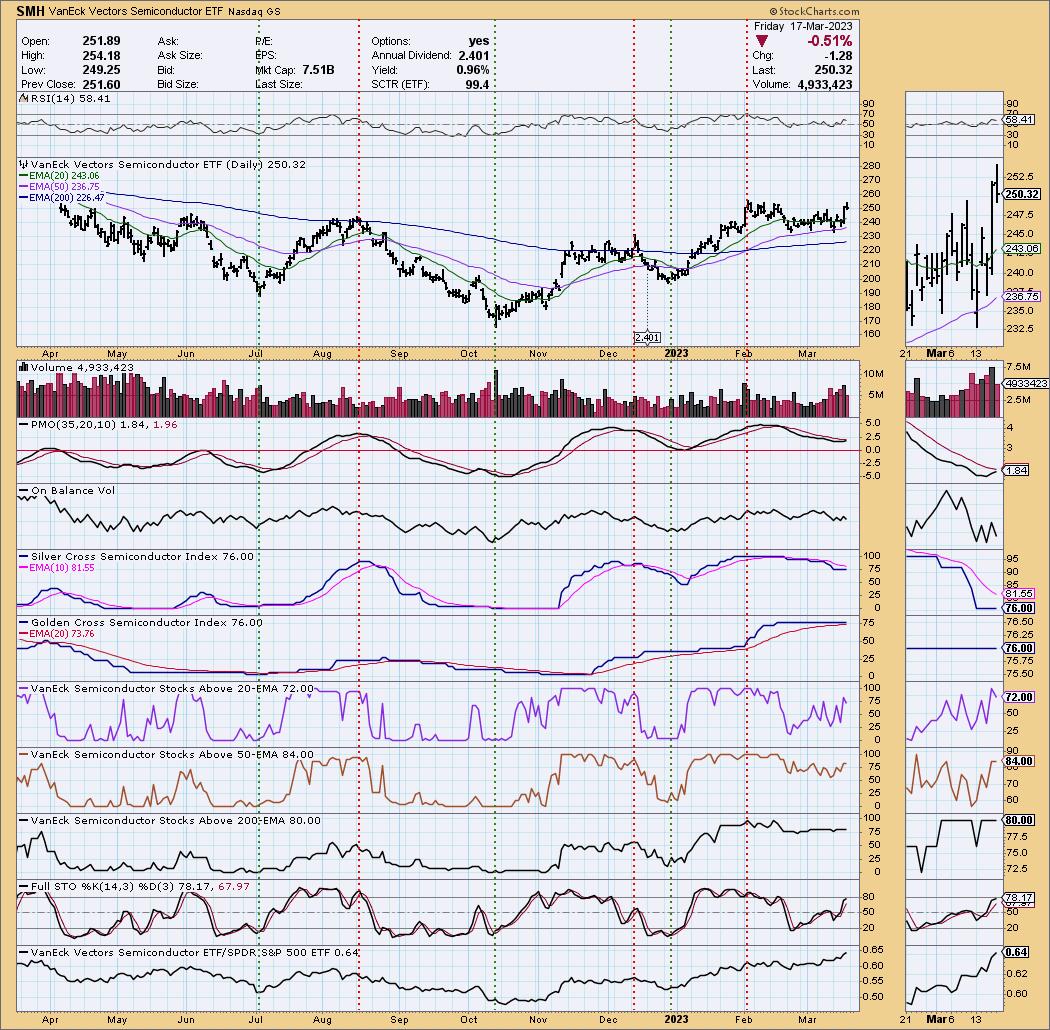
I told Diamond Mine attendees that I would decide after the market close which of the two sectors, Technology (XLK) and Utilities (XLU), would be "Sector to Watch". Given the strength of the Nasdaq and the fact that Technology almost finished higher today, I'm going with XLK. Picking the Industry Group to Watch was easy. Semiconductors are leading this sector higher and I have an "under the hood" chart for Semis to help prove my point.
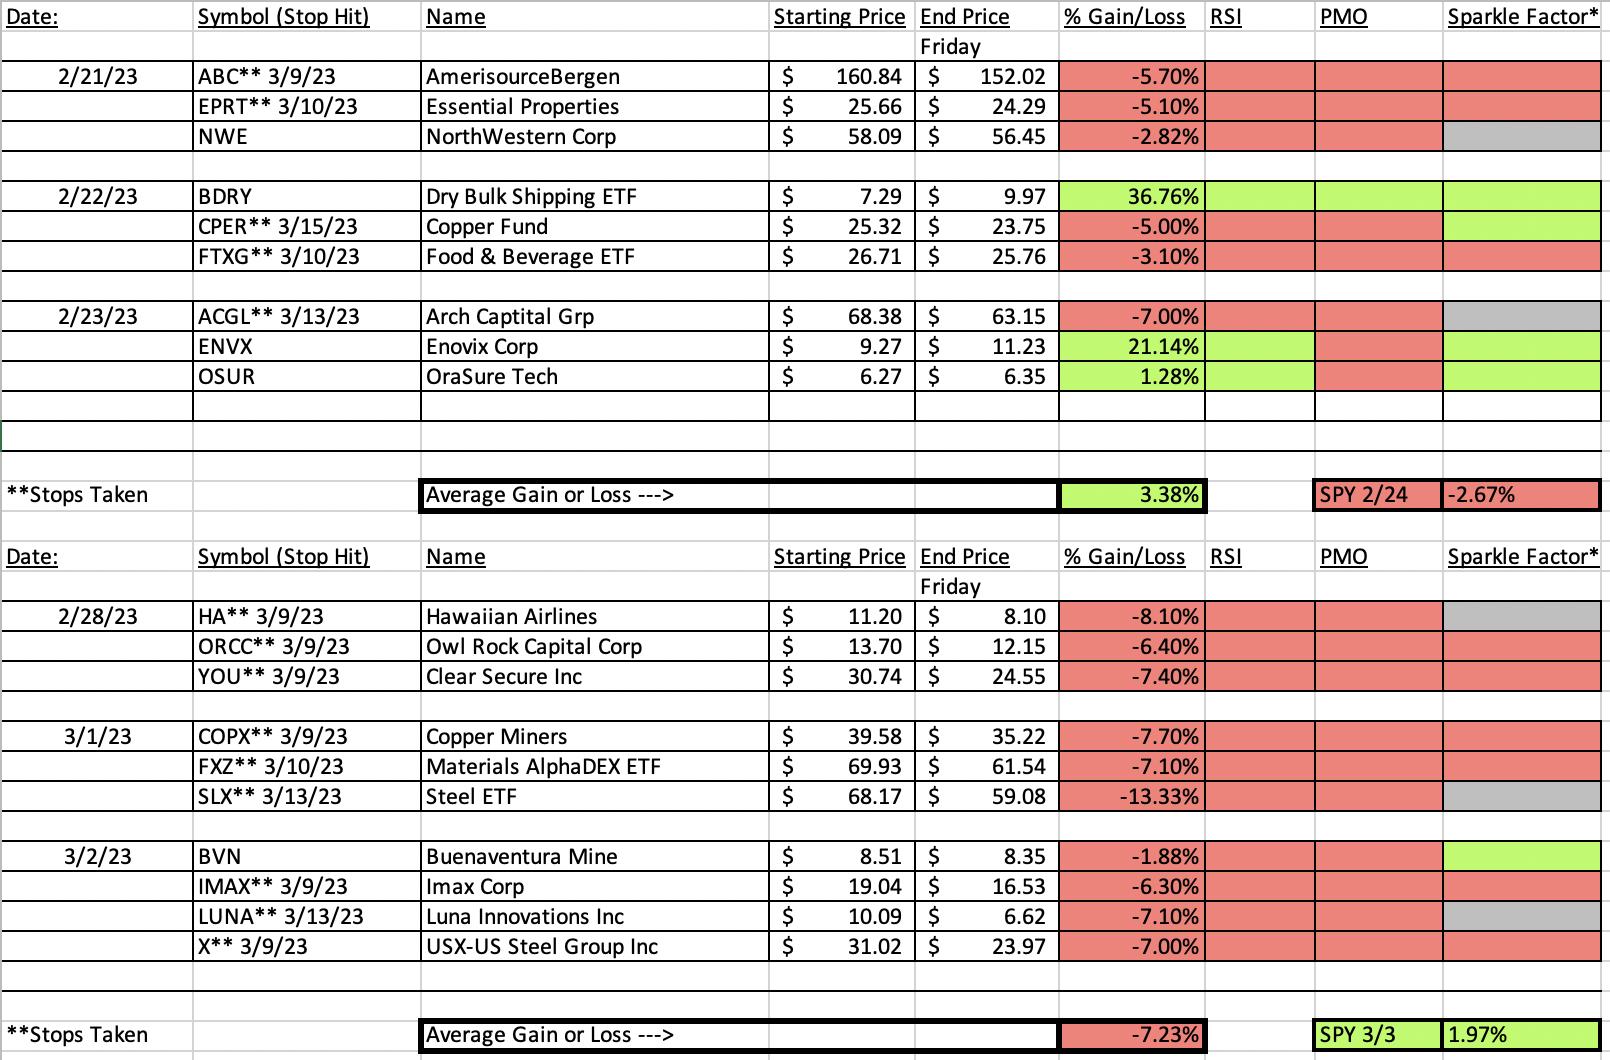
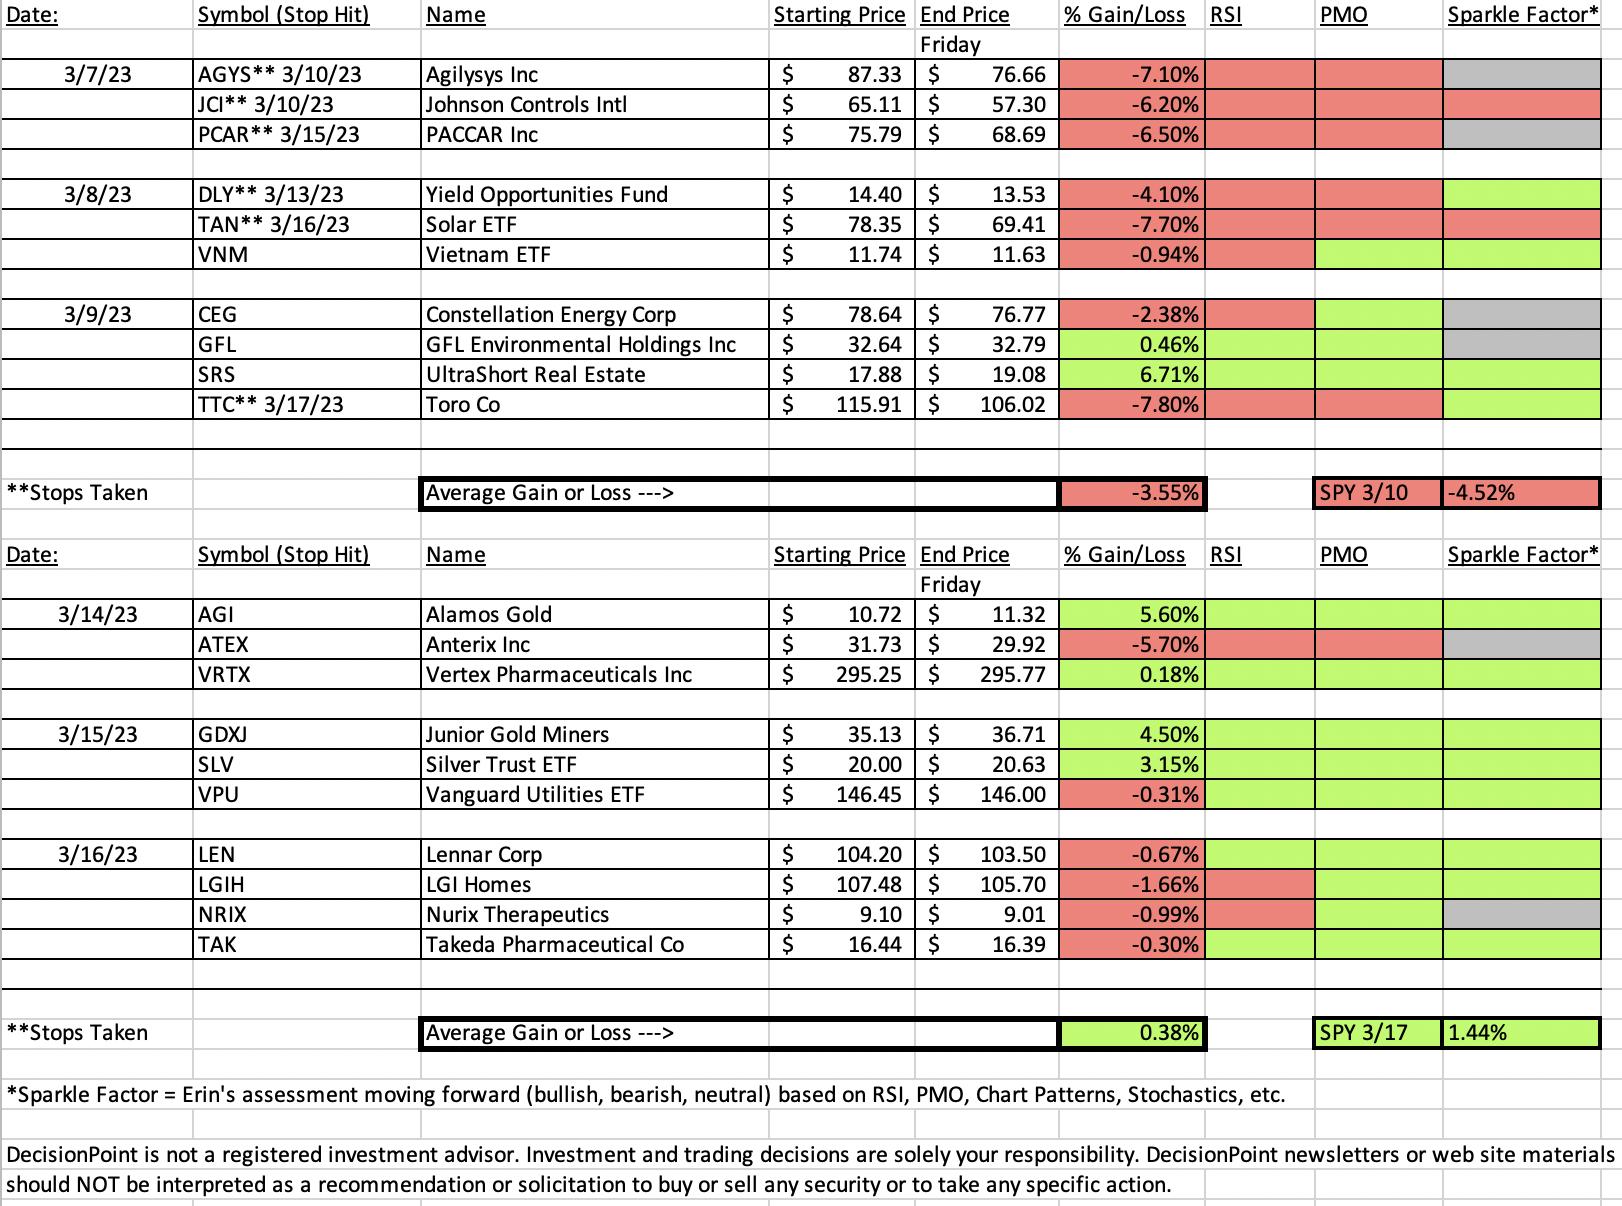
No surprise, our "Darling" this week was Alamos Gold (AGI) given it is in the hot Gold Miners industry group. Interestingly, our "Dud" this week was a tech stock, Anterix (ATEX) which is a Software stock. The chart doesn't look terrible, but I don't see it as an add, more of a hold.
Have a great weekend!
Good Luck & Good Trading,
Erin

RECORDING LINK (3/17/2023):
Topic: DecisionPoint Diamond Mine (3/17/2023) LIVE Trading Room
Passcode: March#17th
REGISTRATION for 3/24/2023:
When: Mar 24, 2023 09:00 AM Pacific Time (US and Canada)
Topic: DecisionPoint Diamond Mine (3/24/2023) LIVE Trading Room
Register in advance for this webinar HERE.
After registering, you will receive a confirmation email containing information about joining the webinar.

Our latest DecisionPoint Trading Room recording (3/13/2023):
A few items about the spreadsheet: I've put on the spreadsheet whether the RSI is positive (green) or negative (red). The PMO column tells you if it is rising (green) or falling (red). Finally I've added my own "Sparkle Factor" that gives you my assessment going forward, bullish (green), bearish (red) or neutral (gray). The Sparkle Factor is basically my thoughts on whether I expect it to rise or fall. A neutral means it could really go either way so it could be added to a watch list. If you're in a stock I consider "neutral" going forward, the ball is in your court.
Darling:
Alamos Gold Inc. (AGI)
EARNINGS: 04/26/2023 (AMC)
Alamos Gold, Inc. engages in the exploration, development, mining and extraction of precious metals. It operates through the following segments: Young-Davidson, Mulatos, Island Gold, Elchanate, Kirazli and Corporate and Other. The company was founded on February 21, 2003 and is headquartered in Toronto, Canada.
Predefined Scans Triggered: Moved Above Upper Price Channel.
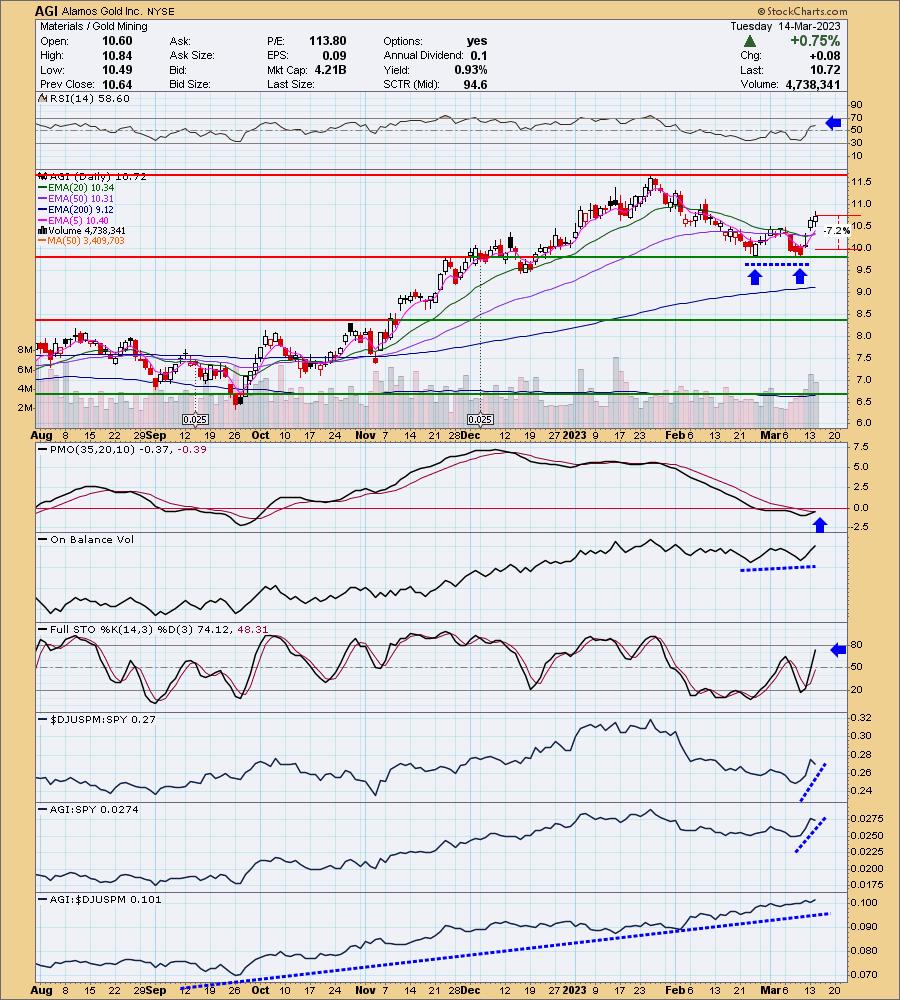
Below are the commentary and chart from Tuesday (3/14/23):
"AGI is up +0.09% in after hours trading. There are quite a few Gold Miners that look good, but this one had the best internal strength given price has remained well above its 200-day EMA and is already above the 5/20/50-day EMAs. There is a bullish double-bottom pattern that has been confirmed with the rally this week. The RSI is positive. We have a slight positive divergence between OBV lows (rising) and price lows (flat). Stochastics are rising strongly and as noted at the beginning of this paragraph, relative strength is fantastic against the group, telling us AGI is a leader in this area. The group has improved its relative strength so consequently AGI is showing excellent relative strength against the SPY. The stop is set just below the middle of the double-bottom pattern at 7.2% around $9.94."
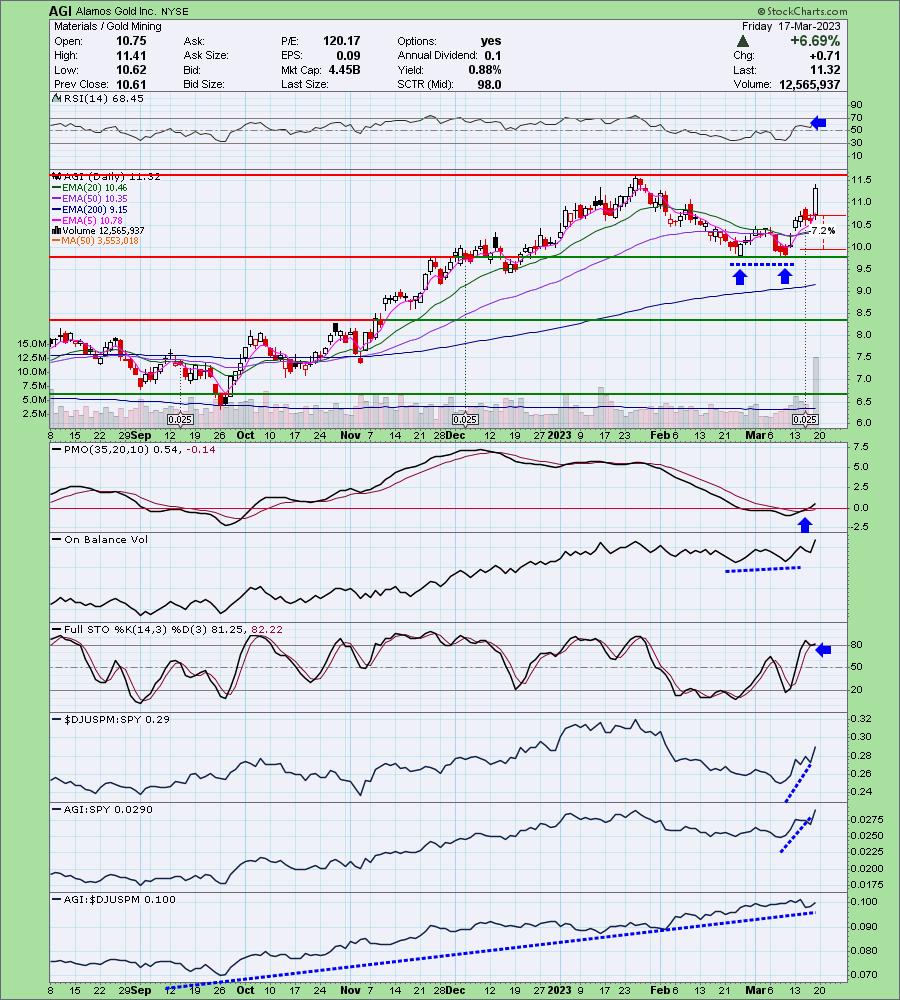
Here is today's chart:
Today was the game changer for AGI which didn't do much after we picked it. The indicators are strong and the OBV positive divergence is doing its job by extending this rally. I imagine it will pause at overhead resistance, but given gold sentiment and the very positive indicators, I would look for AGI to breakout. This one should ride the tide higher.
Don't forget, on Thursdays I look at reader-requested symbols, so shoot me an email at erin@decisionpoint.com. I read every email I receive and try to answer them all!
Dud:
Anterix Inc. (ATEX)
EARNINGS: 05/25/2023 (AMC)
Anterix, Inc. operates as a wireless communications company. The firm focuses on commercializing spectrum assets to enable targeted utility and critical infrastructure customers to deploy private broadband networks, technologies and solutions. It's solutions include Private LTE and Active Ecosystem. The company was founded by Peter Joel Lasensky and Richard Edward Rohmann in 1997 and is headquartered in Woodland Park, NJ.
Predefined Scans Triggered: P&F Double Bottom Breakout.
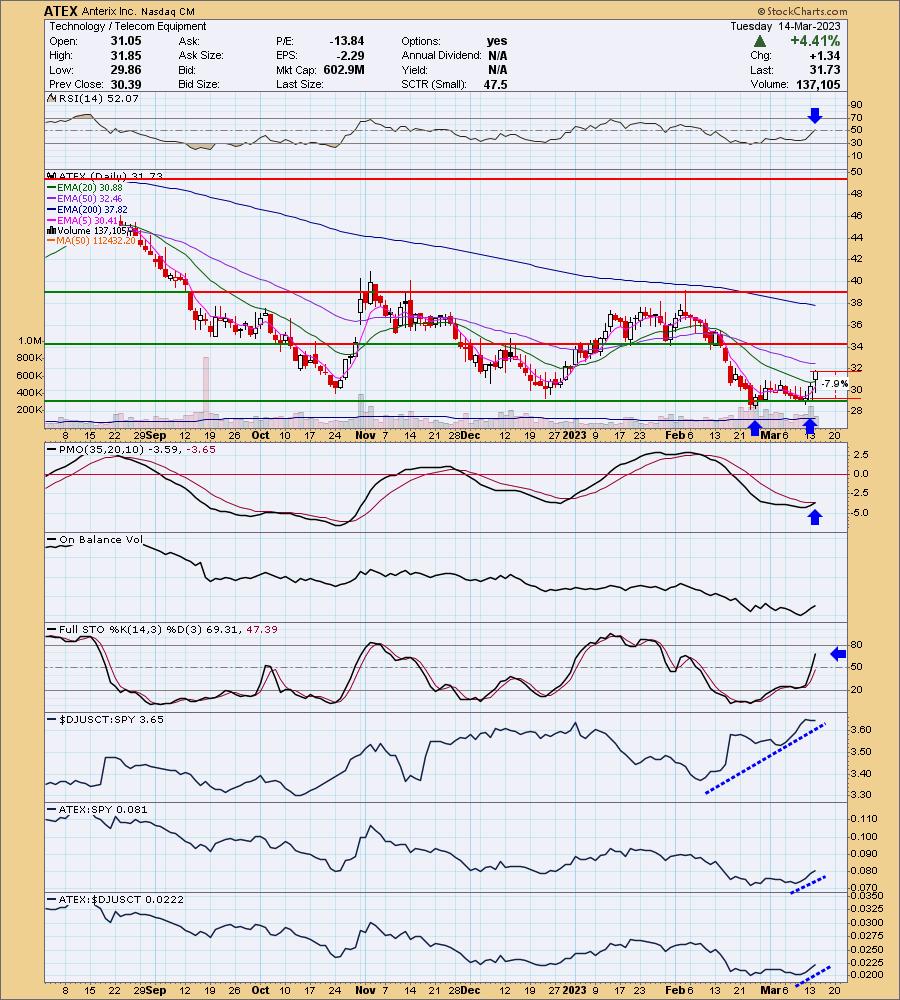
Below are the commentary and chart from Tuesday (3/14/23):
"ATEX is unchanged in after hours trading. I spy a bullish double-bottom pattern that was confirmed on today's strong rally. I'm not a fan of this sector, but this is a pretty enticing chart. The RSI just moved into positive territory and the PMO triggered a crossover BUY signal today. Stochastics are rising strongly in positive territory suggesting internal strength. Relative strength is very good for the group and ATEX is showing strength against both the group and SPY. The stop would be too deep if I set it below the double-bottom due to today's over 4.4% rally, so I opted to set it at a level I would be comfortable with at 7.9% around $29.22."
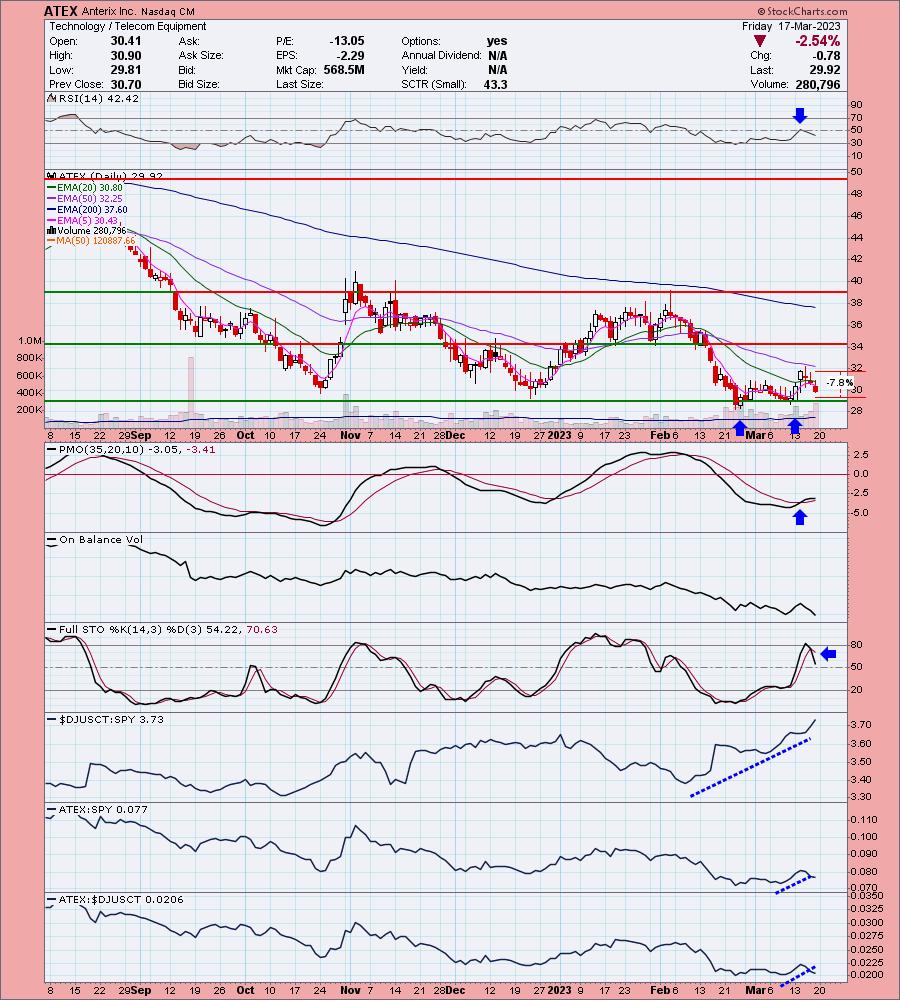
Here is today's chart:
After confirming the small double-bottom, price failed to follow-through as the pattern suggested it would. The RSI is negative now and Stochastics are headed downward. The PMO is also trying to top. I still would view this as a hold because support hasn't broken and if Technology is going to lead next week on a possible rally, we should see a rebound there. It comes down to risk appetite at this point.
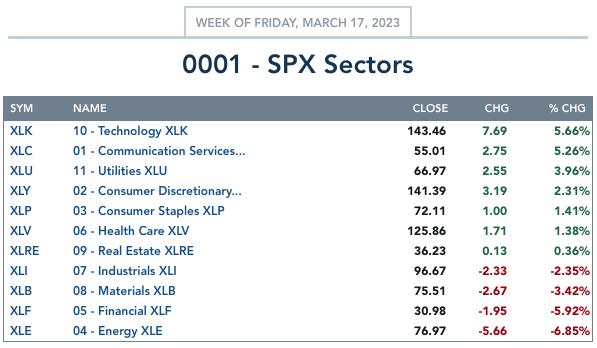
THIS WEEK's Sector Performance:
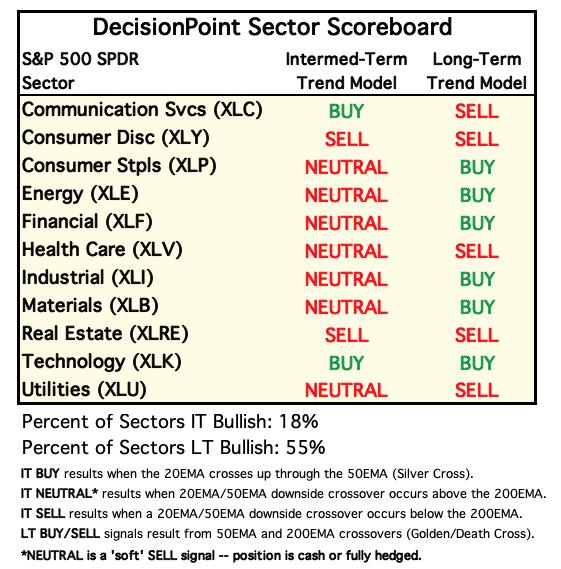
DecisionPoint Sector Scoreboard (Mechanical Trend Model Signals):
Click Here to view Carl's annotated Sector ChartList!
Sector to Watch: Technology (XLK)
While the SPY doesn't look that healthy, the Nasdaq is very healthy as noted in the opening. While participation numbers weren't as high as XLU's, I decided it would likely be in the spotlight. XLK held up on this week's volatile trading, finishing the week up +5.66%. Communication Services (XLC) also had a spectacular week as it was up +5.26%. The XLC chart looks pretty good, but it didn't break above March's earlier top as XLK has.
The PMO triggered a crossover BUY signal today. The RSI is positive and Stochastics just moved above 80. Participation is not above 50% as I would like it and it is not improving very quickly considering the rally this week. The Silver Cross Index (SCI) is moving lower due to not enough stocks above their 20/50-day EMAs to keep it rising. It's early as we don't have the breakout above resistance at the February high, but with indicators looking so bullish, I think it will overcome.
Industry Group to Watch: Semiconductors (SMH)
SMH is up +0.12% in after hours trading. The chart resembles the XLK chart, but notice the very strong participation numbers. 76% have a 20-day EMA greater than their 50-day EMA (Silver Cross Index). We have excellent participation of stocks above their 20/50/200-day EMAs. This selection was a no-brainer.
Go to our Sector ChartList on DecisionPoint.com to get an in-depth view of all the sectors. On StockCharts.com you can find the Industry Summary.
Good Luck & Good Trading!
- Erin
erin@decisionpoint.com
Full Disclosure: I'm 13% long, 2% short. Will look to add a tech stock or ETF should the market continue its short-term rising trend as Swenlin Trading Oscillators (STOs) suggest.
Watch the latest episode of the DecisionPoint Trading Room with Carl & Erin Swenlin on Mondays 3:00p EST!
Technical Analysis is a windsock, not a crystal ball. --Carl Swenlin
NOTE: The stocks reported herein are from mechanical trading model scans that are based upon moving average relationships, momentum and volume. DecisionPoint analysis is then applied to get selections from the scans. The selections given should prompt readers to do a chart review using their own analysis process. This letter is not a call for a specific action to buy, sell or short any of the stocks provided. There are NO sure things or guaranteed returns on the selection of "diamonds in the rough."
Helpful DecisionPoint Links:
DecisionPoint Shared ChartList and DecisionPoint Chart Gallery
Price Momentum Oscillator (PMO)
Swenlin Trading Oscillators (STO-B and STO-V)
(c) Copyright 2023 DecisionPoint.com