
Reader Requests came in light and none were presentable on the bull side. Therefore, I had to run a number of my Diamond Scans. It appeared clear quickly that longs are not the way to go right now. My bullish scans returned very few results and what did appear wasn't usable. I decided to run my Diamond Dog Scan. Boom! Lots of results to look at. I found the ugliest of the bunch in my opinion. So today will be all about shorting.
Today's rally may make you unsure about shorting. If you ever had a bad feeling about a position, don't get in it. You may be wrong, but many times your brain is crunching the chart and maybe you don't know exactly why you don't like an investment, but your brain does.
NVDA goosed the market today and sent quite few tech stocks upward. I noticed the results on the bull side were nearly all stocks that were in very bearish setups before today. Therefore, I don't trust them and went short instead.
Stay defensive and don't short if that isn't your cup of tea. Consider looking at inverse ETFs. The Financial ETF (XLF) looks very bearish again. I use SKF as a way to short that sector.
Good Luck & Good Trading,
Erin
Today's "Diamonds in the Rough": CLF (Short), JD (Short), MRCY (Short) and SQM (Short).
Other shorts to consider: AVNT (Short), BEAM (Short) and LIT (Short).
** JULY VACATION **
I will be in Europe 7/14 - 7/27 so there will not be any Diamonds reports or trading rooms during that time. All subscribers with active subscriptions on 7/27 will be compensated with two weeks added to their renewal date.

RECORDING LINK (5/19/2023):
Topic: DecisionPoint Diamond Mine (5/19/2023) LIVE Trading Room
Passcode: May#19th
REGISTRATION for 5/26/2023:
When: May 26, 2023 09:00 AM Pacific Time (US and Canada)
Topic: DecisionPoint Diamond Mine (5/26/2023) LIVE Trading Room
Register in advance for this webinar HERE
After registering, you will receive a confirmation email containing information about joining the webinar.

Here is the last recording (5/22):
Welcome to DecisionPoint Diamonds, wherein I highlight ten "Diamonds in the Rough" per week. These are selected from the results of my DecisionPoint Scans which search for stocks that could benefit from the trend and condition of the market. Remember, these are not recommendations to buy or sell, but are the most interesting of the stocks that surfaced in my scans. My objective is to save you the work of the initial, tedious culling process, but you need to apply your own analysis to see if these stocks pique your interest as well. There are no guaranteed winners here!
"Predefined Scans Triggered" are taken from StockCharts.com using the "Symbol Summary" option instead of a "SharpChart" on the workbench.
Stop levels are all rounded down.
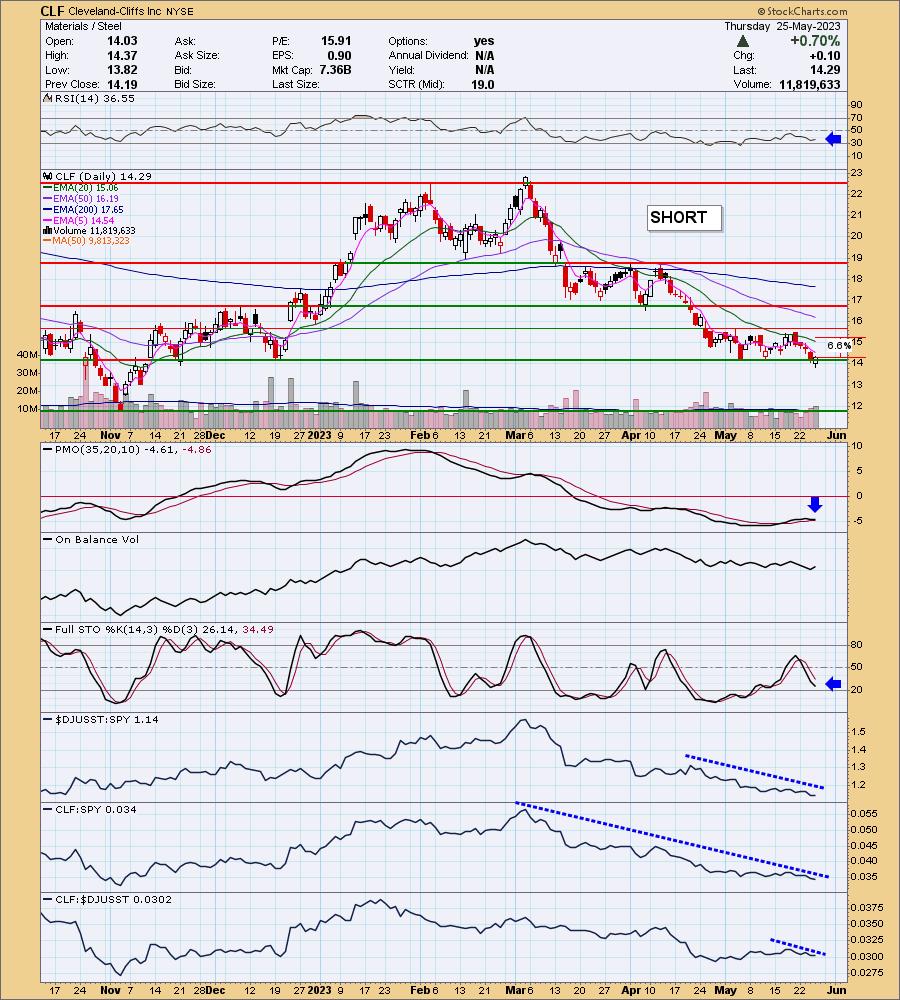
Cleveland-Cliffs Inc (CLF) - Short
EARNINGS: 07/21/2023 (AMC)
Cleveland-Cliffs, Inc. operates as a flat-rolled steel company, which supplies iron ore pellets to the North American steel industry. It engages in the production of metallic and coke, iron making, steelmaking, rolling and finishing, and downstream tubular components, stamping, and tooling. The company was founded in 1847 and is headquartered in Cleveland, OH.
Predefined Scans Triggered: P&F Descending Triple Bottom Breakdown and P&F Double Bottom Breakout.
CLF is down -0.07% in after hours trading. It may have finished higher today, but a breakdown did occur. Price managed to close above support but it is weak. The RSI is in negative territory and the PMO is near a Crossover SELL signal well below the zero line. Stochastics are falling in negative territory. Relative strength is terrible for the group and CLF. The stop is upward since this is a short and I've set it above the 20-day EMA around 6.6% or $13.34.
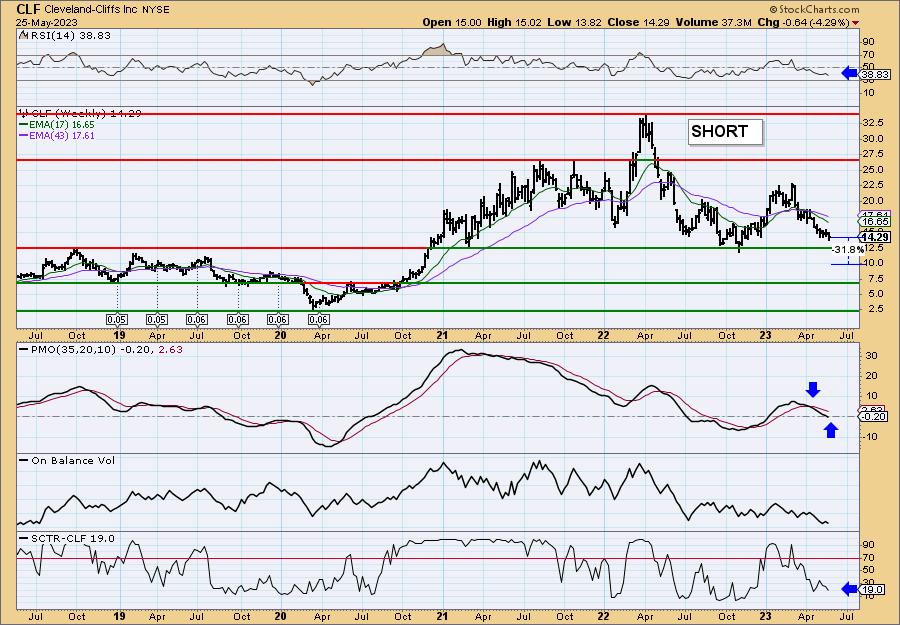
The weekly chart looks bad too with the exception that support is still available in the long term at $12.50. That is about 12% away, but I've opted to make downside potential deeper as I think the charts warrant that. The weekly RSI is negative and falling. The weekly PMO is not only on a Crossover SELL Signal, it just moved beneath the zero line. The SCTR is well outside the "hot zone" above 70*.
*If a stock is in the "hot zone" above 70, it implies that it is stronger than 70% of its universe (large-, mid-, small-caps and ETFs) primarily in the intermediate to long terms.
JD.com, Inc. (JD)
EARNINGS: 08/23/2023 (BMO)
JD.com, Inc. is a technology-driven E-commerce company. It engages in the sale of electronics products and general merchandise products, including audio, video products, and books. It operates through the following segments: JD Retail, JD Logistics, and New Businesses. The JD Retail segment offers online retail, online marketplace, and marketing services. The JD Logistics segment includes internal and external logistics businesses. The New Businesses segment is composed of JD Property, Jingxi, overseas businesses and technology initiatives. The company was founded on June 18, 1998 by Qiang Dong Liu and is headquartered in Beijing, China.
Predefined Scans Triggered: P&F Descending Triple Bottom Breakdown, Moved Below Lower Bollinger Band, Stocks in a New Downtrend (ADX), Moved Below Lower Price Channel, New 52-week Lows, P&F Double Bottom Breakout and Moved Below Lower Keltner Channel.
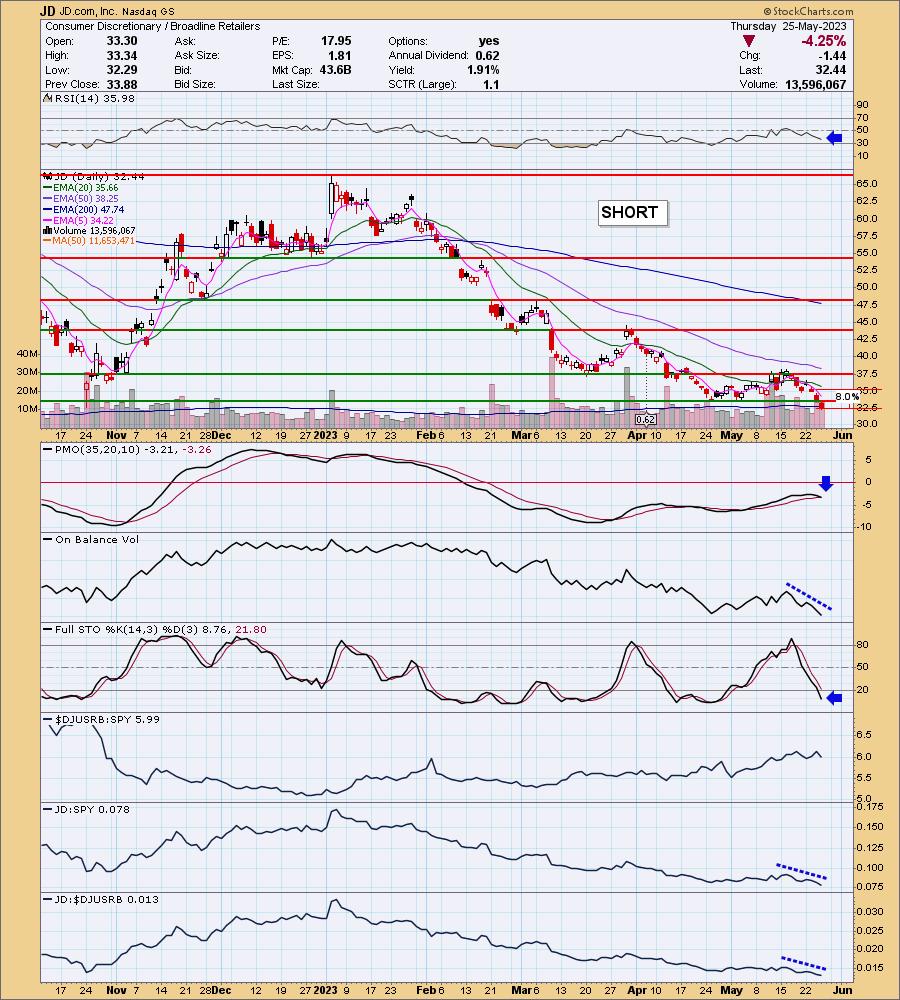
JD is up +0.65% in after hours trading. JD just hit new 52-week lows after breaking support today. The indicators are very bearish. The RSI is negative and falling. There is a PMO Crossover SELL Signal about to execute. The PMO has topped well beneath the zero line as well. The OBV shows volume on this sell off. Stochastics are very weak below 20. Notice that the industry group has been doing fairly well against the SPY, but JD has been a terrible performer this month against the group and SPY. I've set the upward stop at 8% around $29.84.
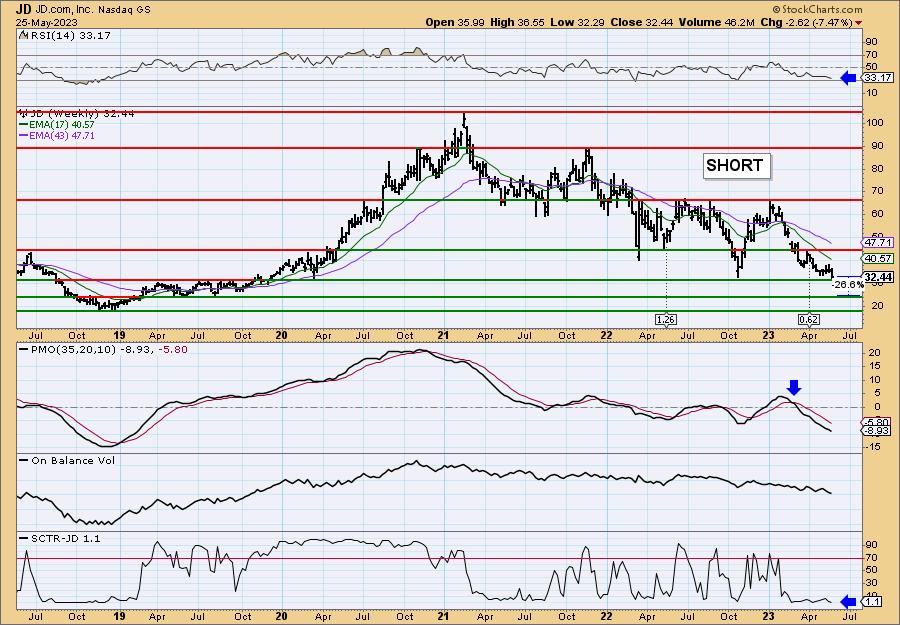
Price is still technically holding longer-term support, but given the abysmal indicators, I doubt it will hold that level. The weekly RSI is falling in negative territory. The weekly PMO continues to decline on its Crossover SELL Signal. The SCTR couldn't be much worse. If this line of support is broken, I would look for an over 26% decline.
Mercury Systems Inc. (MRCY)
EARNINGS: 08/01/2023 (AMC)
Mercury Systems, Inc. is a global commercial technology company, which serves the aerospace and defense industry. It offers products through the following categories: Components, Modules and Sub-Assemblies, and Integrated Subsystems. The Components category refers to technology elements performing a single, discrete technological function, which when physically combined with other components may be used to create a module or sub-assembly. The Modules and Sub-Assemblies category includes combinations of multiple functional technology elements and components that work together to perform multiple functions but are resident on or within a single board or housing. The Integrated Subsystems category covers multiple modules and sub-assemblies combined with a backplane or similar functional element and software to enable a solution. The company was founded on July 14, 1981, and is headquartered in Andover, MA.
Predefined Scans Triggered: None.
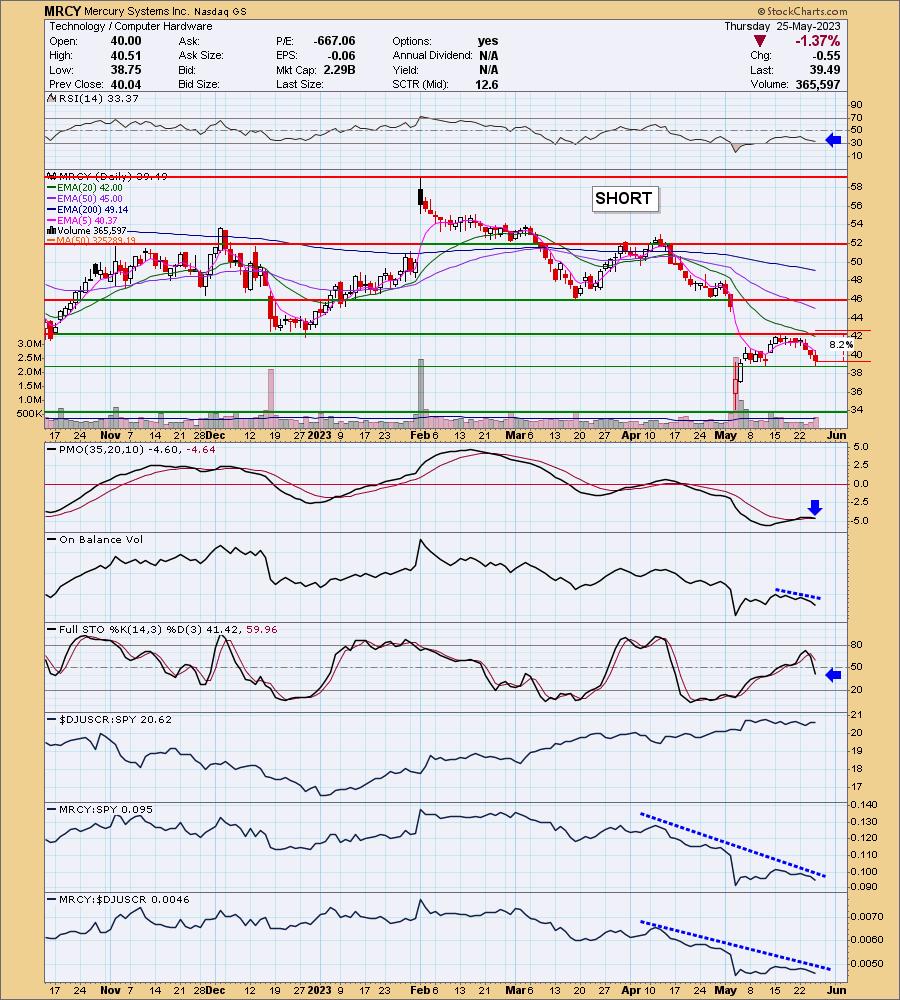
MRCY is up +1.32% in after hours trading. This could give us a better entry on this short. It is at short-term support on the daily chart so bounce here isn't out of the question, but a look at these indicators and you have to believe it will trickle lower. The weekly RSI is in negative territory and the weekly PMO is about to trigger a Crossover SELL Signal well beneath the zero line. Downside volume is getting stronger. Stochastics are tanking quickly and are now in negative territory. The industry group is holding its own against the SPY, but MRCY has been underperforming since April. The upward stop is set at 8.2% or $36.25 above overhead resistance at the May top.
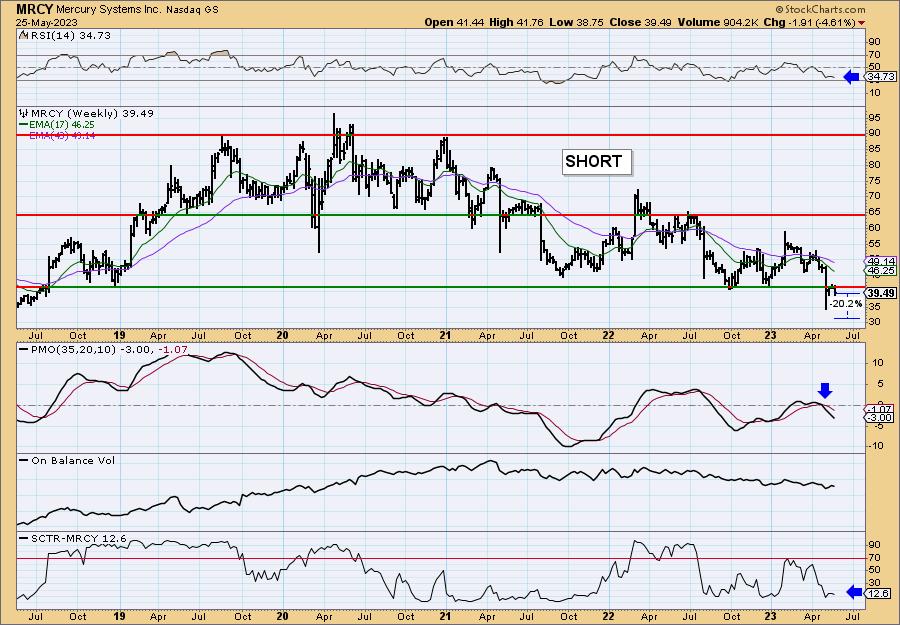
The weekly chart shows a big breakdown followed by an unsuccessful attempt to regain support. The weekly RSI is negative and the weekly PMO is falling on a SELL Signal. The SCTR is very low at 12.6%. I'm using 20% has my downside target.
Sociedad Quimica Y Minera (SQM)
EARNINGS: 08/16/2023 (AMC)
Sociedad Quimica y Minera de Chile SA engages in the production and distribution of fertilizers, potassium nitrate, iodine, and lithium chemicals. It operates through the following segments: Specialty Plant Nutrients, Iodine and Derivatives, Lithium and Derivatives, Industrial Chemicals, Potassium, and Other Products and Services. The Specialty Plant Nutrients segment produces potassium nitrate, sodium nitrate, sodium potassium nitrate, and specialty blends. The Iodine and Derivatives segment manufactures iodine and iodine derivatives, which are used in a wide range of medical, pharmaceutical, agricultural, and industrial applications. The Lithium and Derivatives segment covers lithium carbonate for electrochemical materials for batteries, frits for the ceramic and enamel industries, heat-resistant glass, air conditioning chemicals, continuous casting powder for steel extrusion, primary aluminum smelting process, pharmaceuticals, and lithium derivatives. The Industrial Chemicals segment comprises industrial chemicals including sodium nitrate, potassium nitrate, and boric acid. The Potassium segment produces potassium chloride and potassium sulfate. The Other Products and Services segment deals with other fertilizers and blends. The company was founded on June 17, 1968 and is headquartered in Santiago, Chile.
Predefined Scans Triggered: P&F Double Bottom Breakout.
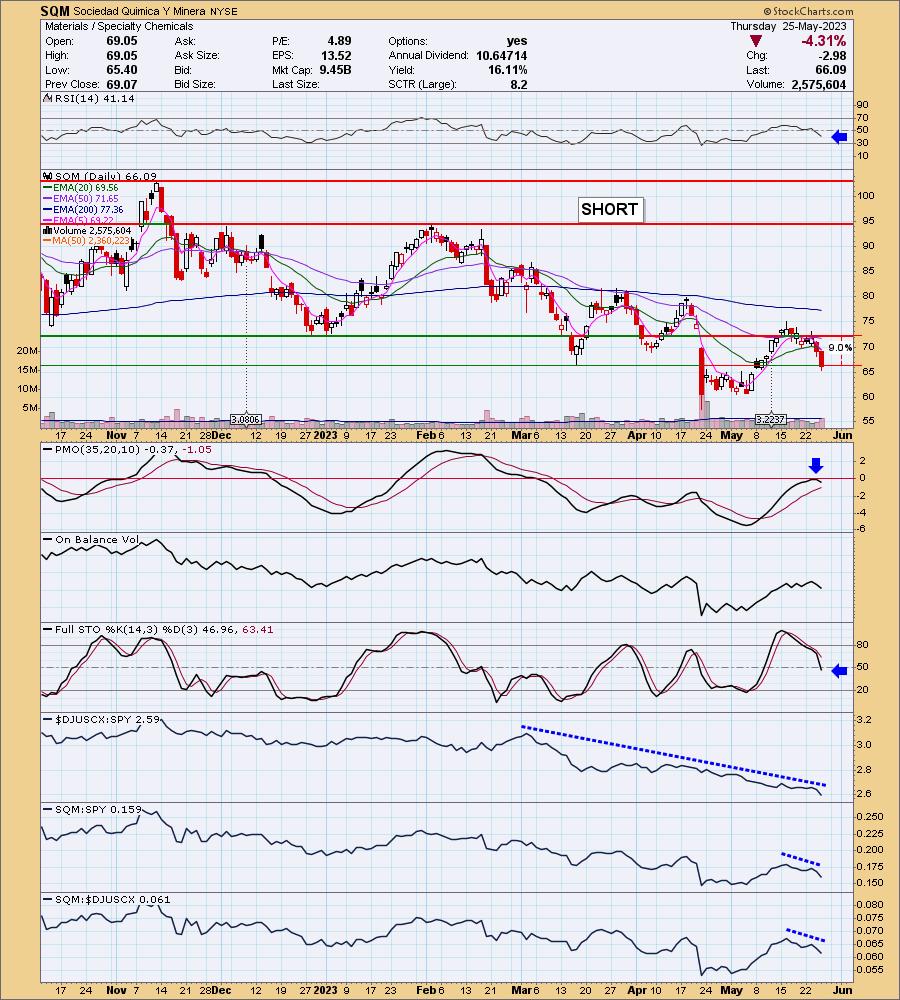
SQM is unchanged in after hours trading. This short-term rounded top looks very bearish. Price closed beneath the March low. The indicators are very bearish with the RSI falling below net neutral (50). The PMO topped beneath the zero line. Stochastics just moved into negative territory. Relative strength for group is awful and you can then add that SQM is underperforming both the group and the SPY. The upside stop is deep and could be pared back if you wish. I've set it at 9% or $60.14.
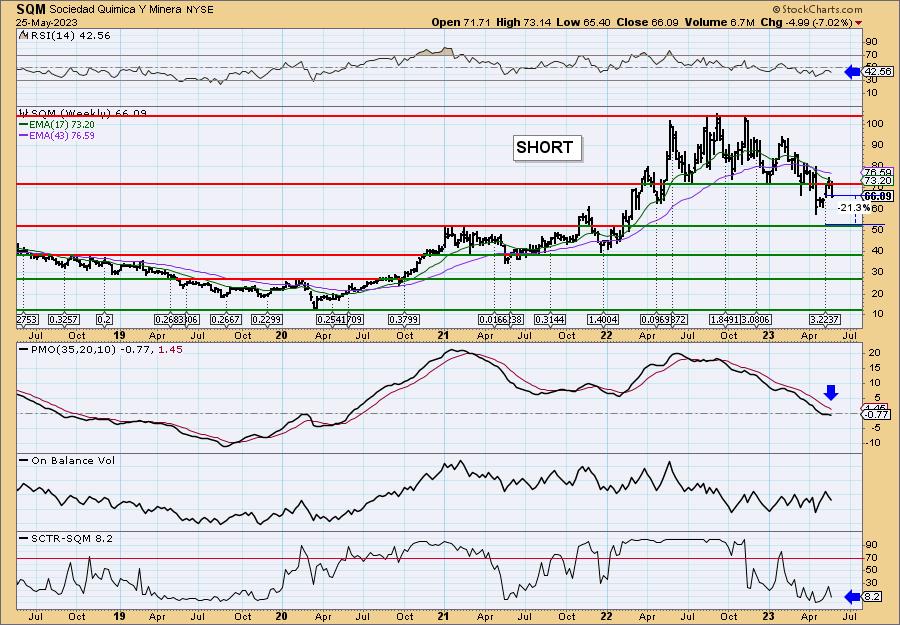
The weekly chart looks no better. The declining trend has been in effect since it topped at the end of 2022. The weekly RSI is topped in negative territory. The weekly PMO shows a top beneath the signal line which is especially bearish. The SCTR is falling and is at an already weak reading of 8.2%. If price drops to the next level of strong support it would be an over 21% gain.
Don't forget, on Thursdays I look at reader-requested symbols, click HERE to send me an email. I read every email I receive and try to answer them all!
Current Market Outlook:
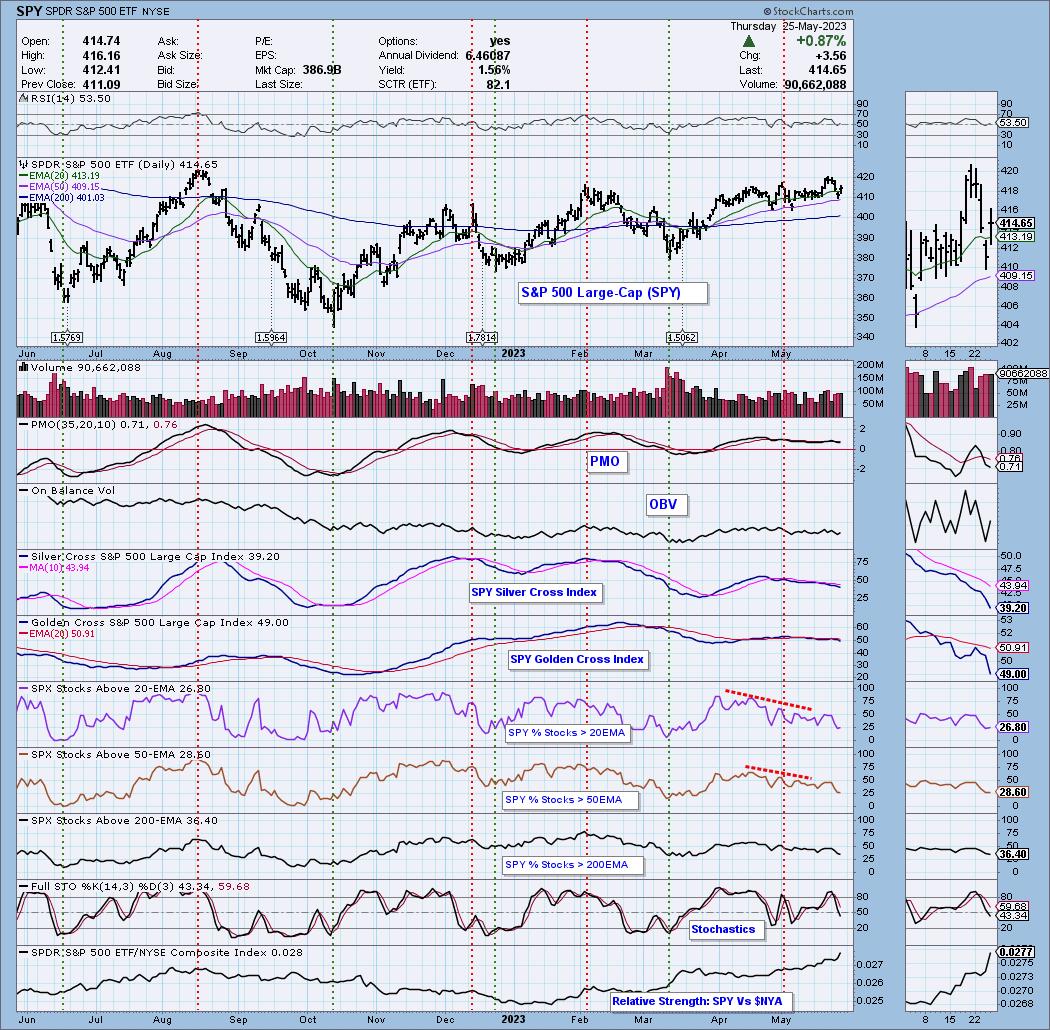
Market Environment: It is important to consider the odds for success by assessing the market tides. The following chart uses different methodologies for objectively showing the depth and trend of participation for intermediate- and long-term time frames.
- The Silver Cross Index (SCI) shows the percentage of SPX stocks on IT Trend Model BUY signals (20-EMA > 50-EMA)
- The Golden Cross Index (GCI) shows the percentage of SPX stocks on LT Trend Model BUY signals (50-EMA > 200-EMA)
Don't forget that as a "Diamonds" member, you have access to our GCI/SCI curated ChartList on DecisionPoint.com. You'll find it under "Members Only" links on the left side on the Blogs and Links Page.
Here is the current chart:
Full Disclosure: I am 14% long, 7% short. I may add one of these shorts.
I'm required to disclose if I currently own a stock I mention and/or may buy/short it within the next 72 hours.
"Technical Analysis is a windsock, not a crystal ball." - Carl Swenlin
(c) Copyright 2023 DecisionPoint.com
Watch the latest episode of DecisionPoint Trading Room with Carl & Erin Swenlin on Mondays 7:00p EST or on the DecisionPoint playlist on the StockCharts TV YouTube channel here!
NOTE: The stocks reported herein are from mechanical trading model scans that are based upon moving average relationships, momentum and volume. DecisionPoint analysis is then applied to get five selections from the scans. The selections given should prompt readers to do a chart review using their own analysis process. This letter is not a call for a specific action to buy, sell or short any of the stocks provided. There are NO sure things or guaranteed returns on the daily selection of "Diamonds in the Rough."
Regarding BUY/SELL Signals: The signal status reported herein is based upon mechanical trading model signals and crossovers. They define the implied bias of the price index/stock based upon moving average relationships and momentum, but they do not necessarily call for a specific action. They are information flags that should prompt chart review. Further, they do not call for continuous buying or selling during the life of the signal. For example, a BUY signal will probably (but not necessarily) return the best results if action is taken soon after the signal is generated. Additional opportunities for buying may be found as price zigzags higher, but the trader must look for optimum entry points. Conversely, exit points to preserve gains (or minimize losses) may be evident before the model mechanically closes the signal.
Helpful DecisionPoint Links:
DecisionPoint Shared ChartList and DecisionPoint Chart Gallery
Price Momentum Oscillator (PMO)
Swenlin Trading Oscillators (STO-B and STO-V)
For more links, go to DecisionPoint.com